PRE-SEMESTER BULLETIN - July 2018 to June 2019 REGION VI - Western Visayas Region - Pest Risk Identification and ...
←
→
Page content transcription
If your browser does not render page correctly, please read the page content below
PRE-SEMESTER BULLETIN
July 2018 to June 2019

     REGION VI – Western Visayas Region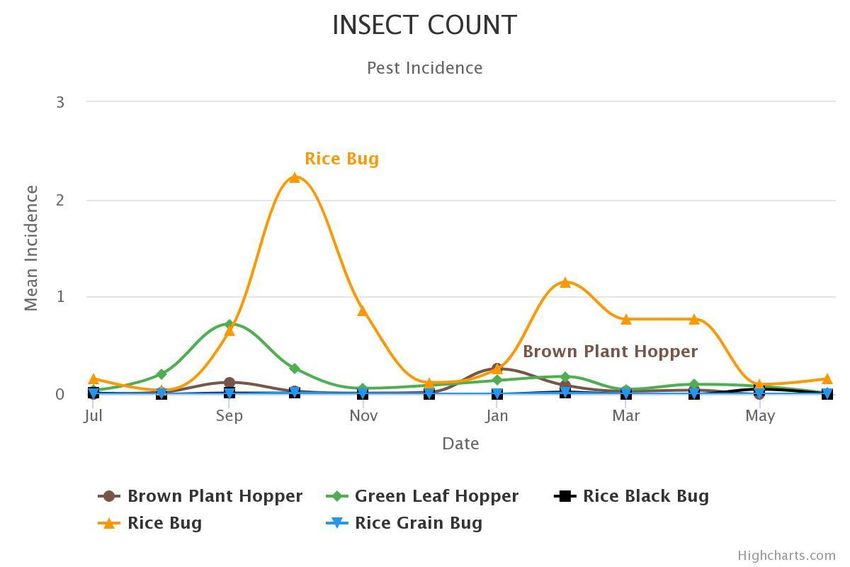
AT A GLANCE

   Table. Mean incidence of pest injuries, count of insect pests, and percentage of weed cover by month.

   Disclaimer: All the data presented in this report are based on the monthly monitoring of farmers’ fields by regional data
   collectors of PRIME.
Monitored fields and data collectors

     Municipalities surveyed:                         Aklan: Altavas, Lezo, Numancia
                                                      Antique: Culasi, and Sibalom
                                                      Capiz: Cuartero, Dumalag, and Sigma
                                                      Guimaras: San Lorenzo
                                                      Iloilo: Badiangan, Banate, Dingle, Lemery, Miagao,
                                                      New Lucena, Passi City, Pavia, San Miguel, and
                                                      Tigbauan
                                                      Negros Occidental: Bago City, and Valladolid

     Monitoring date:                                 July 2018 – June 2019

     Number of monitored fields:                      147 monitoring fields

     Data collectors:                                 Anthony Mark Hondrade, April Rose Parinasan, Arniel
                                                      Ramos, Bonn Adam Icasas, Ellen Joy Tabaque, Felix
                                                      Jamilla, Fe Pollentes, Gregorie Gicana, Jemma
                                                      Magbanua, Jen lyn Gantalao, Jepee Palma, Jepty
                                                      Cabanilla, Jofel Junsay, Jona lyn Lantiza, Joy Tabaque,
                                                      Lucita Diano, Ma.Fe Escorpiso, Maria Lisa Mayandia,
                                                      Marlon Narida, Melmar Mendoza, Mirasol Coste, Nerisa
                                                      Capungan, Pablo Yamuyam, Phil Roland Cabrera,
                                                      Randy Carmen, Renea Talaman, Reynaldo Filamo,
                                                      Rodrigo, Jr. Molina, Ryza Nievares, Winnie Tagle, and
                                                      Ziroh Elerio

     Disclaimer: All the data presented in this report are based on the monthly monitoring of farmers’ fields by regional data
     collectors of PRIME.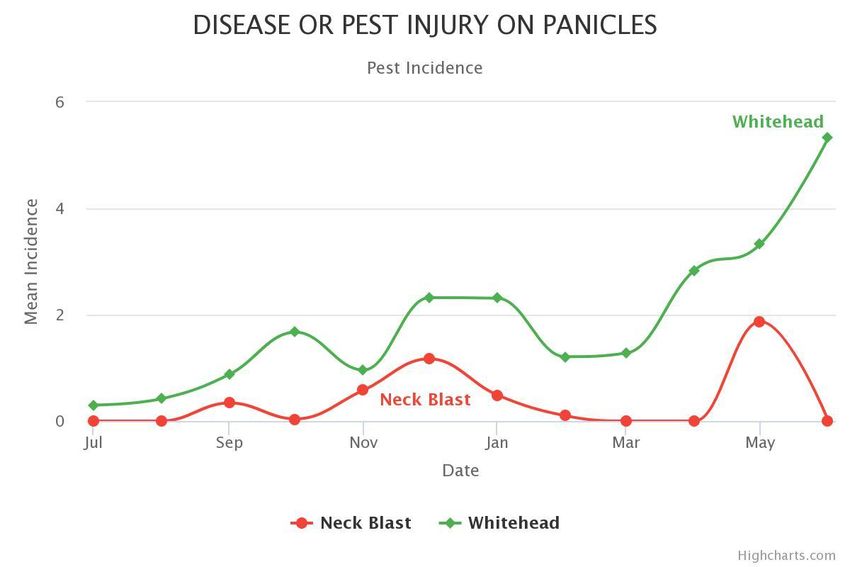
Growth stages
   In the second semester of 2018, most of the monitored fields were at the vegetative stage in
   August and the peak of harvest occurred in October (Figure 1). Majority of the fields were fallow
   in September to October. Crop establishment in the first semester of 2019 peaked in December
   2019 and most of the fields were harvested in February. A large proportion of the fields were
   fallow in April to June 2019.

   Figure 1. Proportion of crop growth stages of fields by month.

   Disclaimer: All the data presented in this report are based on the monthly monitoring of farmers’ fields by regional data
   collectors of PRIME.
Pest injuries, insect count and weed cover
Box plots, also known box-and-whisker plots, are presented to facilitate the visualization the
distribution or range of collected data (Figures 2 to 8). The black closed circle in or near each
bar represents the mean of each pest injury. The black vertical line in each bar represents the
median which refers to the midpoint of the range of data. Since it is not affected by extreme
values or outliers like the mean, the median represents the most common value of a variable.
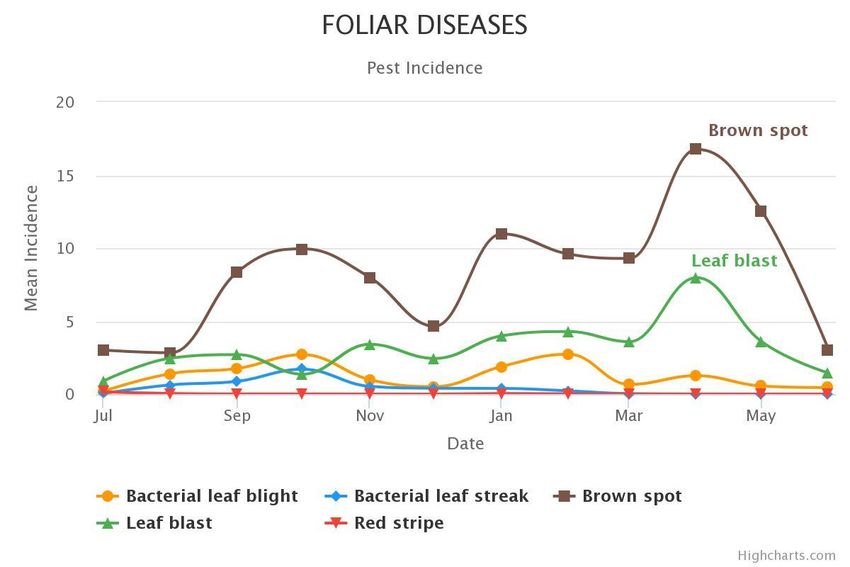
A. Foliar diseases
Brown spot, bacterial leaf blight and leaf blight were observed in all months (Figure 2). Brown
spot was the most important foliar disease in the region. The mean incidence was slightly higher
in the first semester than in the second semester (10% and 6%, respectively). Mean brown spot
incidence was higher than 5% in most months and higher than 10% in January, April and May
2019). The highest median of brown spot incidence (5%) was observed in October 2018,
January 2019, and February 2019. The highest mean incidence of leaf blast (8%) was observed
in April 2019, but the median in any month did exceed 0.5%.
Figure 2. Incidence of foliar diseases in Region VI from July 2018 to June 2019.
Disclaimer: All the data presented in this report are based on the monthly monitoring of farmers’ fields by regional data
collectors of PRIME.
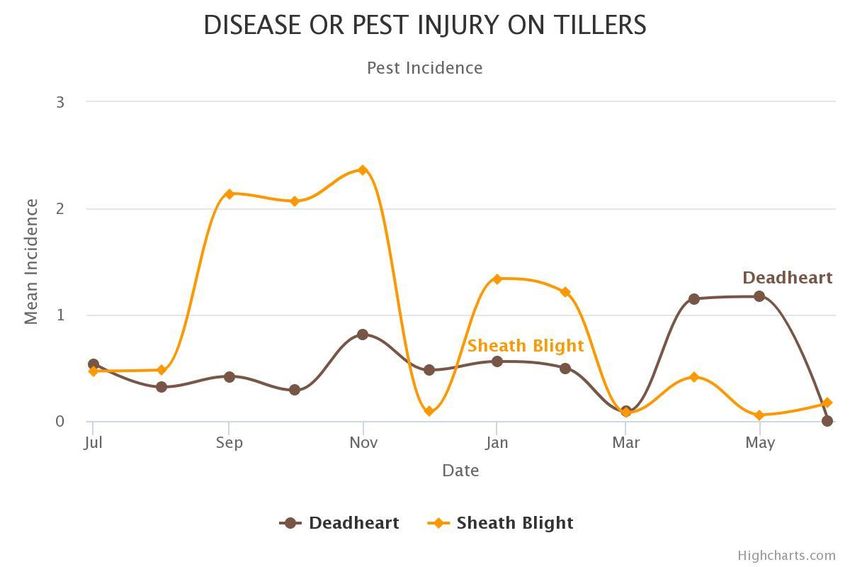
B. Insect pest injuries and diseases on tillers
 The incidence of deadheart and sheath blight was negligible during the year (Figure 3). The
 highest mean sheath blight incidence of 2% was observed in September to November 2018.
 The median of deadheart and sheath blight was 0 in all months.

Figure 3. Incidence of deadheart and sheath blight in Region VI, July 2018 to June 2019.

Disclaimer: All the data presented in this report are based on the monthly monitoring of farmers’ fields by regional data
collectors of PRIME.
C. Insect pest injuries and diseases on panicles
Neck blast incidence was negligible during the year. The highest whitehead incidence of 5%
was observed in June 2019 (Figure 4). The median incidence of neck blast was 0 in all months
and that of whitehead was 0 in all months except in May and June 2019.

Figure 4. Incidence of neck blast and whitehead in Region VI, July 2018 to June 2019.

Disclaimer: All the data presented in this report are based on the monthly monitoring of farmers’ fields by regional data
collectors of PRIME.
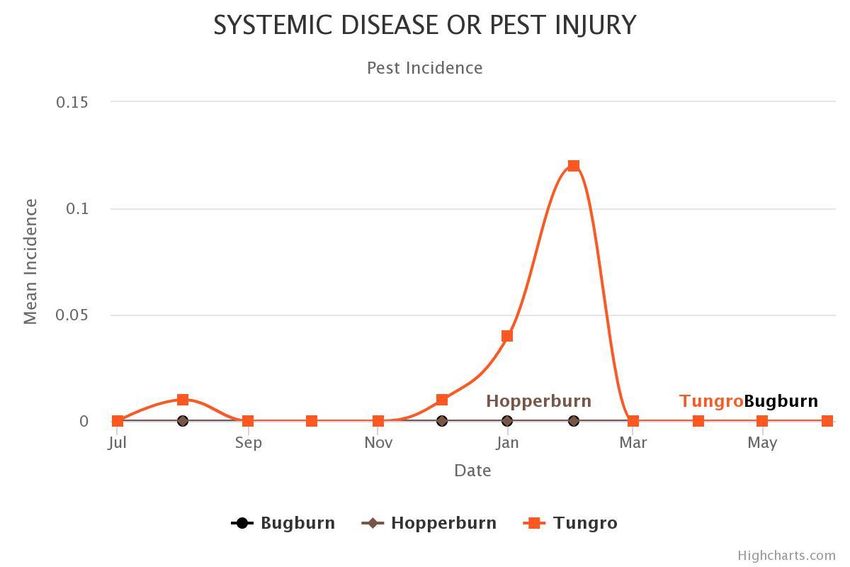
D. Systemic insect pest injuries and diseases
Bugburn and hopperburn caused by brown planthoppers were not observed and
tungro was negligible during the year (Figure 5).

Figure 5. Incidence of systemic pest injuries in Region VI, July 2018 to June 2019.

Disclaimer: All the data presented in this report are based on the monthly monitoring of farmers’ fields by regional data
collectors of PRIME.
E. Count of insect pests
The count of insect pests was negligible during the year (Figure 6). The highest mean count of
rice bug was 2 insects per square which was observed in October 2018. The median count of
insect pests was 0 in almost all the months.

Figure 6. Count of insect pests in Region VI, July 2018 to June 2019.

Disclaimer: All the data presented in this report are based on the monthly monitoring of farmers’ fields by regional data
collectors of PRIME.
F. Rat injury
The incidence of rat injury was negligible during the year (Figure 7).

Figure 7. Incidence of rat injury in Region VI, July 2018 to June 2019.

Disclaimer: All the data presented in this report are based on the monthly monitoring of farmers’ fields by regional data
collectors of PRIME.
G.       Weed cover
Weed infestation was high and can be considered as the major pest constraint in Region VI
during the year. The mean percentage of weed cover was higher than 5% in all months except
in July 2018 and was higher than 10% in February to May 2019 (Figure 8). The highest median
weed incidence of 5% was observed in January to February and April to May 2019. Weed cover
was higher than 50% in some fields.

Figure 8. Percentage of weed cover in Region VI, July 2018 to June 2019.

Disclaimer: All the data presented in this report are based on the monthly monitoring of farmers’ fields by regional data
collectors of PRIME.
Management of major pests

     This section describes the management of the most important pests during the reporting period.
     A pest is operationally considered important if the mean incidence of injury (for insect pests and
     diseases) or percentage of cover (for weeds) in at least one month was at least 5%, or in the
     case of insect pests, the count was at least 5 per square meter.

     Weeds

     1. Plow and harrow the field several times before crop establishment. If feasible, start land
         preparation 3−4 weeks before planting.
     2. If weedy rice is a problem, apply glyphosate before land preparation or seeding. The
         application of pretilachlor with fenchlorim during final land preparation or levelling has also
         been reported to reduce weedy rice.
     3. Practice stale seedbed technique. According to the IRRI Knowledge Bank
         (http://www.knowledgebank.irri.org/step-by-step-production/growth/weed-management/stale-
         seedbed-technique), this technique is done as follows:
         a. Perform tillage operations. Plow, harrow, and level the field.
         b. Stimulate weed emergence by light irrigation.
         c. Irrigate the field at least two weeks before sowing.
         d. Maintain enough soil moisture to allow weeds to germinate.
         e. Kill the emerged seedlings using non-selective herbicides (e.g., glyphosate) or light
              cultivation.
         f. If the soil condition is suitable for sowing, broadcast seeds without further tillage
              operations. Tillage could bring more weed seeds near the soil surface, thus promoting
              weed germination.
     4. Level the field to ensure a constant water level. Avoid high spots where weeds can grow.
     5. Apply pre-emergence herbicide (e.g., pretilachlor + fenclorim) 2−3 days after sowing. Follow
         recommended amount and timing of product and water condition in the field as indicated
         in the label. Do not use the same herbicide over long periods to prevent herbicide
         resistance.
     6. If grass weeds are the main weed problem, apply early post-emergence herbicide.
     7. Maintain a 2-5 cm water level in the field to minimize weed emergence. If water is sufficient,
         flood the fields until closure of the plant canopy.
     8. Apply nitrogen fertilizer just after weeding to minimize rice-weed competition for nitrogen.
     9. If feasibile, consider the use of biological control agents to suppress growth or reduce
         population of weeds.
     10. If feasible, plow the field during fallow to kill weeds and prevent the build-up of weed seeds
         in the soil.

     Brown spot

     1. The most practical and economical approach to manage brown spot is to grow a resistant
        variety.
     2. When feasible, improve soil fertility by regularly monitoring nutrients in the soil. and the
        application of required fertilizers.
     3. If possible, determine the occurrence of Akiochi, a nutritional disorder, in the field. Brown
        spot develops on plants affected by Akiochi and has, in fact, been used as its indicator.
        It is caused by excessive concentration of hydrogen sulfide in the soil and results in reduced
        nutrient uptake. Akiochi occurs in irrigated fields that are poorly drained and have excessive
     Disclaimer: All the data presented in this report are based on the monthly monitoring of farmers’ fields by regional data
     collectors of PRIME.
organic matter. Low decomposition of stubbles, which usually occurs in areas with short
fallow period, results in high organic matter.
4. Use certified seeds or clean seeds. Brown spot is a seedborne disease which means that
growing an infected seed will result in diseased plants during the cropping season. Seeds
can be cleaned manually using flotation method which consists of the following steps:
a. Dissolve 1.5 kg salt in 40 liters of water.
b. Soak seeds in the salt solution.
c. Stir to float diseased, unfilled and broken seeds.
d. Remove floating seeds by hand or with a sieve.
e. Wash seeds 3 to 4 times with clean water.
f. Dry in the shade thoroughly before sowing.
5. The pathogen in the seeds can be eliminated by hot water seed treatment. This treatment is
not recommended if seeds had been chemically treated or primed (pre-soaked to promote
germination). It consists of the following steps:
a. Soak seeds for 1 to 3 hours in tap water.
b. Preheat water bath. To ensure uniform temperature in the container, the amount of
water should allow seeds to move freely and constantly stir the mixture. Maintain
temperature by adding room temperature water.
c. Prepare packets made of cheese cloth or nets and fill half of each packet with seeds.
d. Transfer and soak seeds in hot water bath (52 to 57°C) for 15 mins. Put weights to keep
the seeds submerged. Constantly check the temperature.
e. Immediately remove and cool the seeds by washing with room temperature water.
f. Spread and dry the seeds in the shade completely before sowing.
A disadvantage of the hot water seed treatment is that it requires careful handling.
However, it is more effective than fungicide treatment because fungicides may not
penetrate the seed coat.
6. Use optimum seeding rate (e.g., 80 kg per hectare) for direct-seeded rice and optimum
plant spacing (e.g., 20 cm x 20 cm) for transplanted rice. A dense plant canopy reduces
sunlight penetration, increases leaf wetness duration and lowers temperature in the plant
canopy, creating a favorable microclimate for disease development.
7. Apply potassium and other required nutrients in addition to nitrogen. Potassium reduces the
amount of most rice diseases.
8. Apply calcium silicate fertilizer or silicon fertilizer before crop establishment if the soil is
deficient in silicon.
9. Apply fungicides, such as azoxystrobin, ready mixture of azoxystrobin and difenoconazole,
and propiconazole, as foliar spray. Seeds may also be treated with fungicides, such as
carbendazin and benomyl. Use fungicides as a last resort in controlling the disease.
Pathogens become resistant to chemical pesticides if these are not used properly. Avoid
repetitive use of a single active ingredient and mix or alternate an active ingredient with an
appropriate partner. Integrate the use of chemical pesticides with cultural practices or non-
chemical methods. Wherever feasible, several strategies should be used together.
10. If possible, irrigate the field continuously until one week before harvest. Do not drain the field
for long periods because drought stress favors brown spot.
11. Remove alternate hosts in the field, such as Echinochloa spp. and weedy rice.
12. If harvested plants had severe disease, immediately plow or rotavate the field after harvest
to incorporate infected stubbles and crop residues in the soil.
13. Dry grains immediately after harvest to moisture content of at least 14%.
Disclaimer: All the data presented in this report are based on the monthly monitoring of farmers’ fields by regional data
collectors of PRIME.14. Store grains in sealed containers with moisture content of at least 14%.
Leaf blast and neck blast
1. The most practical and economical approach to manage blast is to grow a resistant variety.
Rotate varieties with different levels of resistance because a resistant variety may later
become susceptible if grown continuously across several cropping seasons.
2. Practice planting synchrony with defined fallow period in your area. If this is not possible, a
farmer who intends to grow a susceptible variety should not plant rice later than most
farmers’ fields.
3. Use optimum seeding rate (e.g., 80 kg per hectare) for direct-seeded rice and optimum
plant spacing (e.g., 20 cm x 20 cm) for transplanted rice. A dense plant canopy reduces
sunlight penetration, increases leaf wetness duration and lowers temperature in the plant
canopy, creating a favorable microclimate for disease development.
4. Apply only the recommended amount of nitrogen. Aside from creating a dense plant
canopy, excessive amount of nitrogen makes the plant tissues softer and facilitates the entry
of the pathogen into the plant.
5. Manage the application of nutrient fertilizers. Apply the required amount of nitrogen in splits
instead of applying all the required amount at the start of the cropping season.
6. Apply potassium and other required nutrients in addition to nitrogen. Potassium reduces the
amount of most rice diseases.
7. Apply calcium silicate fertilizer or silicon fertilizer when feasible.
8. For transplanted rice, grow seedlings in well irrigated seedbeds. After crop establishment,
irrigate the field continuously until one week before harvest. Do not drain the field for long
periods because drought stress favors blast.
9. Use fungicides as last resort in controlling the disease. Apply fungicide, such as tricyclazole
and ready mixture of tebuconazole and trifloxystrobin, at late booting and 50% heading
stages if (a) the variety is susceptible, (b) leaf blast increased before booting stage, and (c) if
the weather is rainy and cool. Apply the insecticide according to the instructions in the
product label including the pre-harvest interval (wait time between a pesticide application
and when a crop can be harvested). Avoid repetitive use of a single active ingredient and
mix or alternate an active ingredient with an appropriate partner. Pathogens become
resistant to chemical pesticides if these are not used properly. Integrate the use of chemical
pesticides with cultural practices or non-chemical methods. Wherever feasible, several
strategies should be used together.
10. If plants had severe disease, cut the stubbles close to the ground and remove them from the
field. A less laborious option is to immediately plow or rotavate the field after harvest to
incorporate infected stubbles and crop residues in the soil. Avoid ratooning because the
pathogen can survive on ratoon.
11. Keep the field dry during the fallow period to control the pathogens in infected stubbles.
Whitehead caused by stemborer
1. Monitor the peak of yellow stem borer population in the area. This can be done using light
traps. Do not transplant or sow seeds when insect population is high.
2. Consider the use of pheromones to control stemborers.
Disclaimer: All the data presented in this report are based on the monthly monitoring of farmers’ fields by regional data
collectors of PRIME.3. The most practical and economical approach to manage whitehead is to grow a resistant
variety. Rotate varieties with different levels of resistance because a resistant variety may
later become susceptible if grown continuously across several cropping seasons.
4. Practice planting synchrony with defined fallow period in your area. Asynchronous planting
results in overlapping generations of stemborer throughout the year. If this is not possible, a
farmer who intends to grow a susceptible variety should not establish his crop later than most
farmers’ fields.
5. Raise level of irrigation water periodically to submerge the eggs on the lower parts of the
plant.
6. Remove egg masses manually in the nursery and field.
7. Manage the application of nutrient fertilizers. Apply the required amount of nitrogen in splits
instead of applying all the required amount at the start of the cropping season. Nitrogen
makes the plant tissues softer and facilitates penetration of stemborer larvae.
8. Remove alternate hosts during the cropping season and fallow period.
9. If high infestation occurred, cut stubbles close to the ground and dry or remove stubbles
from the field. A less laborious option is to plow the field during fallow to bury stubbles.
10. Do not apply insecticides during the early vegetative stage. Systemic insecticides may be
applied after the vegetative stage. Systemic insecticides were found to be more effective
than contact insecticides because the larvae and pupae stay inside the stem. Insecticides
should be used with extreme caution. Monitor the population of stemborers and intensity of
deadheart or whitehead prior to the application of insecticides because its efficacy is low
when generations of stemborer overlap and when damage is already severe. Apply the
insecticide according to the instructions in the product label including the pre-harvest
interval (wait time between a pesticide application and when a crop can be harvested).
Insecticides should be used as the last resort and should be integrated with other methods to
conserve natural enemies.
Disclaimer: All the data presented in this report are based on the monthly monitoring of farmers’ fields by regional data
collectors of PRIME.Annex Figure 1. Incidence of pest injuries, count of insect pests, and weed cover in July 2018. Horizontal bar shows the proportion of fields in each range of pest injury incidence, insect count, or weed cover. Disclaimer: All the data presented in this report are based on the monthly monitoring of farmers’ fields by regional data collectors of PRIME.
Annex Figure 2. Incidence of pest injuries, count of insect pests, and weed cover in August 2018.
Horizontal bar shows the proportion of fields in each range of pest injury incidence, insect count,
or weed cover.

Disclaimer: All the data presented in this report are based on the monthly monitoring of farmers’ fields by regional data
collectors of PRIME.
Annex Figure 3. Incidence of pest injuries, count of insect pests, and weed cover in September
2018. Horizontal bar shows the proportion of fields in each range of pest injury incidence, insect
count, or weed cover.

Disclaimer: All the data presented in this report are based on the monthly monitoring of farmers’ fields by regional data
collectors of PRIME.
Annex Figure 4. Incidence of pest injuries, count of insect pests, and weed cover in October
2018. Horizontal bar shows the proportion of fields in each range of pest injury incidence, insect
count or weed cover.

Disclaimer: All the data presented in this report are based on the monthly monitoring of farmers’ fields by regional data
collectors of PRIME.
Annex Figure 5. Incidence of pest injuries, count of insect pests, and weed cover in November
2018. Horizontal bar shows the proportion of fields in each range of pest injury incidence, insect
count or weed cover.

Disclaimer: All the data presented in this report are based on the monthly monitoring of farmers’ fields by regional data
collectors of PRIME.
Annex Figure 6. Incidence of pest injuries, count of insect pests, and weed cover in December
2018. Horizontal bar shows the proportion of fields in each range of pest injury incidence, insect
count or weed cover.

Disclaimer: All the data presented in this report are based on the monthly monitoring of farmers’ fields by regional data
collectors of PRIME.
Annex Figure 7. Incidence of pest injuries, count of insect pests, and weed cover in January
2019. Horizontal bar shows the proportion of fields in each range of pest injury incidence, insect
count or weed cover.

Disclaimer: All the data presented in this report are based on the monthly monitoring of farmers’ fields by regional data
collectors of PRIME.
Annex Figure 8. Incidence of pest injuries, count of insect pests, and weed cover in February
2019. Horizontal bar shows the proportion of fields in each range of pest injury incidence, insect
count or weed cover.

Disclaimer: All the data presented in this report are based on the monthly monitoring of farmers’ fields by regional data
collectors of PRIME.
Annex Figure 9. Incidence of pest injuries, count of insect pests, and weed cover in March 2019.
Horizontal bar shows the proportion of fields in each range of pest injury incidence, insect count
or weed cover.

Disclaimer: All the data presented in this report are based on the monthly monitoring of farmers’ fields by regional data
collectors of PRIME.
Annex Figure 10. Incidence of pest injuries, count of insect pests, and weed cover in April 2019.
Horizontal bar shows the proportion of fields in each range of pest injury incidence, insect count
or weed cover.

Disclaimer: All the data presented in this report are based on the monthly monitoring of farmers’ fields by regional data
collectors of PRIME.
Annex Figure 11. Incidence of pest injuries, count of insect pests, and weed cover in May 2019.
Horizontal bar shows the proportion of fields in each range of pest injury incidence, insect count
or weed cover.

Disclaimer: All the data presented in this report are based on the monthly monitoring of farmers’ fields by regional data
collectors of PRIME.
Annex Figure 12. Incidence of pest injuries, count of insect pests, and weed cover in June 2019.
Horizontal bar shows the proportion of fields in each range of pest injury incidence, insect count
or weed cover.

Disclaimer: All the data presented in this report are based on the monthly monitoring of farmers’ fields by regional data
collectors of PRIME.
Annex Figure 13. Mean incidence of foliar diseases in Region VI, July 2018 to June 2019.

Annex Figure 14. Mean Incidence of deadheart and sheath blight in Region VI, July 2018 to June
2019.

Disclaimer: All the data presented in this report are based on the monthly monitoring of farmers’ fields by regional data
collectors of PRIME.
Annex Figure 15. Mean incidence of neck blast and whitehead in Region VI, July 2018 to June
2019.

Annex Figure 16. Mean incidence of bugburn, hopperburn and tungro in Region VI, July 2018 to
June 2019.
Disclaimer: All the data presented in this report are based on the monthly monitoring of farmers’ fields by regional data
collectors of PRIME.
Annex Figure 17. Mean count of insect pests in Region VI, July 2018 to June 2019.

Annex Figure 18. Mean incidence of rat injury and weed infestation in Region VI, July 2018 to
June 2019.

Disclaimer: All the data presented in this report are based on the monthly monitoring of farmers’ fields by regional data
collectors of PRIME.
You can also read