Comparison K-Medoids Algorithm and K-Means Algorithm for Clustering Fish Cooking Menu from Fish Dataset - IOPscience
←
→
Page content transcription
If your browser does not render page correctly, please read the page content below

IOP Conference Series: Materials Science and Engineering

PAPER • OPEN ACCESS

Comparison K-Medoids Algorithm and K-Means Algorithm for Clustering
Fish Cooking Menu from Fish Dataset
To cite this article: Nana Suarna et al 2021 IOP Conf. Ser.: Mater. Sci. Eng. 1088 012034

View the article online for updates and enhancements.

                               This content was downloaded from IP address 46.4.80.155 on 23/05/2021 at 01:29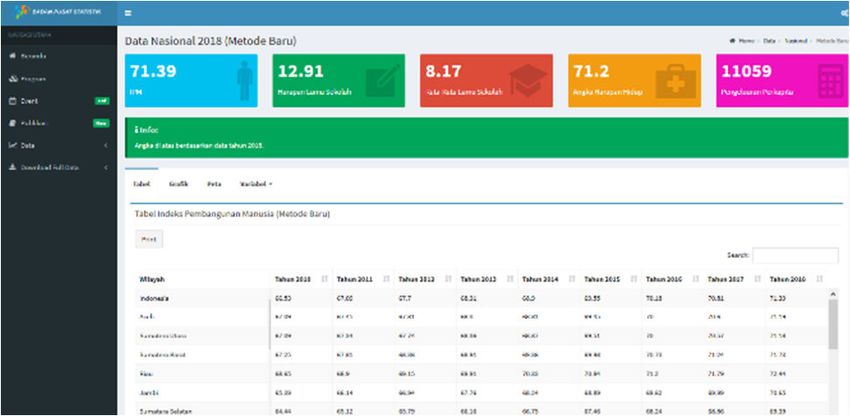
Annual Conference on Computer Science and Engineering Technology (AC2SET) 2020                                           IOP Publishing
IOP Conf. Series: Materials Science and Engineering              1088 (2021) 012034           doi:10.1088/1757-899X/1088/1/012034

Comparison K-Medoids Algorithm and K-Means Algorithm for
Clustering Fish Cooking Menu from Fish Dataset

                   Nana Suarna1*, Yudhistira Arie Wijaya2, Mulyawan3, Tuti Hartati4, Tati Suprapti5

                   STMIK IKMI Cirebon, Cirebon, Indonesia

                   *st_nana@yahoo.com

                   Abstract. The production of fish-based food processing has become a commodity for restaurants,
                   restaurants, catering and home consumption, but there are still many people who don't know how
                   fish can be processed in various dishes for their daily needs. To find out how to make fish-based
                   dishes, the researchers provide a solution to cooking any kind of food, starting from the grouping
                   of types of dishes, the basic ingredients that must be prepared, how to cook them, to the address
                   of the cooking link with ingredients from fish. This study aims so that people can cook various
                   menus whose basic ingredients come from fish. This research uses clustering algorithm, k-means
                   and k-medoids. The stages of this research consisted of data collection, data selection, modeling,
                   data training, data testing and evaluation. The object in the study of menu data for various
                   processed fish dishes consisted of 978 datasets of processed fish dishes. The data used for data
                   relating to fish food ingredients with fish food attributes and the number of likes via the website,
                   the fish dataset is sourced from https://ipm.bps.go.id/data/dataset/ikan. From the two algorithms,
                   the best accuracy results are -1.777 for the k-means algorithm, while -1.535 results are obtained
                   for the accuracy of the k-medoids algorithm.

1. Introduction
Clustering analysis is a multivariate technique which has the main objective of grouping objects based
on their characteristics, that the data is reliable and widely used in scientific studies [1]. Clustering as
an exploratory mapping tool to analyze accurate data, can also group data objects that are expressed as
observational features into subsets or clusters associated with members or data objects from the same or
similar sub data, while the sub data groups can differ in the same perception[2]. The aim of the analysis
of individual patient data was to identify groups of patients with the same baseline symptom pattern, in
evaluating the effectiveness of VEN vs placebo in each group, to explore the effect of dose on the
efficacy of VEN in each group [3]The k-means algorithm is a non-parametric clustering method for
grouping functional data, in the literature the k-means clustering algorithm is based on two-norms from
the original functional data [4]
    K-means clustering algorithm for image segmentation, remedial measures of each are proposed for
two shortcomings namely randomness of cluster number and initial cluster center. The segmented image
is handled by morphological processing to obtain complete contours. This algorithm is improved to
realize the separation between fish and background images in complex conditions, compared to other
segmentation algorithms, the result has high accuracy and stability[5]
    The k-medoids algorithm is a form of grouping of similar data objects of the same value in one
cluster. The decision boundary resulting from the given k-medoid model is the perpendicular hyper
              Content from this work may be used under the terms of the Creative Commons Attribution 3.0 licence. Any further distribution
              of this work must maintain attribution to the author(s) and the title of the work, journal citation and DOI.
Published under licence by IOP Publishing Ltd                          1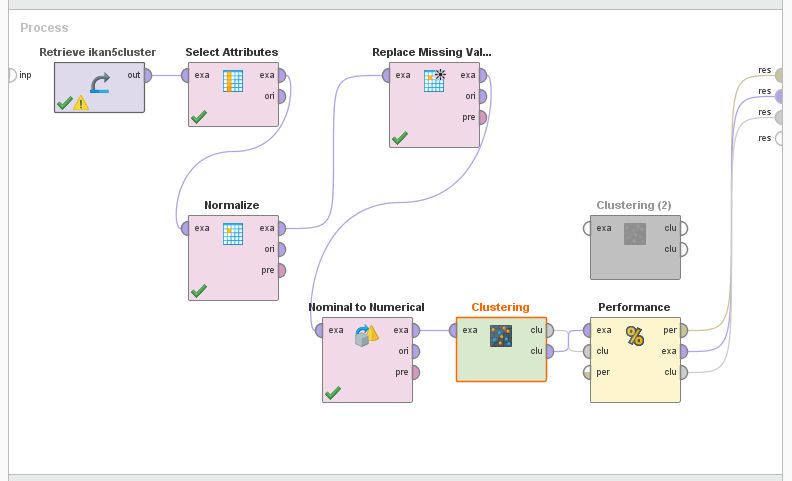
Annual Conference on Computer Science and Engineering Technology (AC2SET) 2020                   IOP Publishing
IOP Conf. Series: Materials Science and Engineering   1088 (2021) 012034    doi:10.1088/1757-899X/1088/1/012034

bisector plane of the line segment from the medoid of one cluster to another [5]. Another opinion
suggests that the k-medoids algorithm is well known, supported by various datamining and machine
learning software packages, including heuristics, pam, clara, claras, and affinity propagation [6].
Clustering algorithms are widely applied in various fields such as data mining, statistics, and machine
learning. however, the number of initial groupings and central grouping can affect clustering accuracy.
In research, the entropy function and the average information density are used to determine the initial
clustering number and center, respectively based on fuzzy c-means clustering [7]
   Research conducted by S. Gangga and Dr. T.Meyyappan in his journal discusses grouping data using
the K-Means algorithm to find the closest possibility and group similar groups [7]. According to Saeful
Anwar and Yudhistira in their journal entitled Classifying the Level of Understanding of the KKNI-
Based Curriculum Using the X-Means Clustering Method. In this study, using the clustering method
with the X-Means algorithm on the questionnaire results on the understanding of the KKNI curriculum
in the students of STMIK IKMI Cirebon[8]. Fuzzy set theory was introduced by Zadeh, and was
successfully applied to image segmentation. The fuzzy c-means algorithm, proposed by Bezdek is based
on fuzzy theory, is the most widely used algorithm in image segmentation because of its simplicity and
ability to store more information [9].

2. Methodology
2.1 Object and data
Objects in the research menu data for various processed fish dishes consisted of 1392 datasets of fish
dishes. The data used for data related to fish cooking ingredients with fish food data attributes and the
number of likes via the https page or via the web, fish dataset according to data at
https://ipm.bps.go.id/data/ fish data set as shown in figure 2.1

                                              Figure 1. Site of IPM BPS
The data analysis steps in this study are as follows
1. Collecting secondary data, which is based on the types of fish dishes including: shredded, pickled,
    tamarind, meatball, balado, milkfish, skipjack, capcay, brengkes, cireng, mortar, dory, pomfret,
    chilli, omelette, dancis, bloated, curry, garang, snapper, fish, pindang, grilled, catfish, tilapia,
    catfish, tilapia, pempek, soup, tuna, woku, mackerel, mangut, stir-fry, tuna, stir-fry, sardines, carp.
2. Coding the predictor variables, 3. Divide the data into training data and testing data, 4. Clustering
    using the Clustering algorithm, k-means and k-medoids, 5. Determining the number of label values
    and calculating clustering predictions.
   Literature that uses data mining techniques related to food menus sourced from fish has been widely
shared on several internet media. This research focuses on Comparing Cdp Optimization On the
Algorithm Of Fish Based Cooking Menu Clasterization, namely the k-means, k-medoids clustering
algorithm, by comparing the predicted results of the algorithm to get the best results.

                                                         2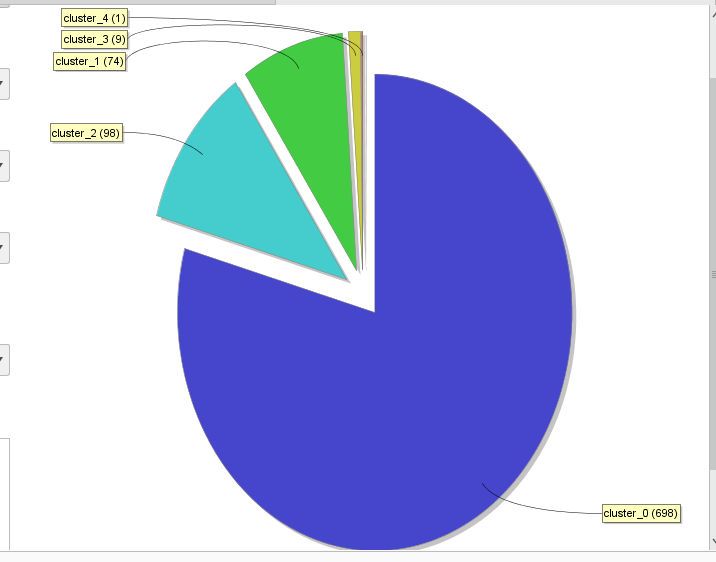
Annual Conference on Computer Science and Engineering Technology (AC2SET) 2020                        IOP Publishing
IOP Conf. Series: Materials Science and Engineering      1088 (2021) 012034      doi:10.1088/1757-899X/1088/1/012034

2.2 Dataset
In this case the data set used in the clustering process is a public dataset obtained from
https://ipm.bps.go.id, namely the structure of the fish dataset as in table 1 below:

                                          Table 1. Fish Dataset Structure
                                Name                     Type                 Information
                                  id                    Integer                attribute
                           Type of cuisine            polynominal              attribute
                                Love                    integer                attribute
                                 url                  polynominal               atribut

2.3 Process Model using Rapid Miner
The model is made, starting with data collection, then preprocessing, where preprocessing is done data
normalization and attribute selection. The next step was cross validation which divided the data into
90% training data and 10% test data. Then the next process is to perform classification using several
machine learning algorithms. One of the algorithms used is k-means and k-medoids, as described in the
steps in Figure 2.

                                        Figure 2. Rapid Miner Process Mode

1. Clustering
Clustering is a process for grouping data into several clusters so that the data in one cluster has a
maximum similarity level and the data between clusters has a minimum similarity. A good clustering
result will result in a high level of similarity within one class and a low level of similarity between
classes. The similarity in question is a numerical measurement of two objects. The similarity value
between the two objects will be higher if the two objects being compared have high similarities.
Likewise, vice versa. The quality of the clustering results really depends on the method used[10] The
following formula is used to calculate the distance with the Euclidean distance:

    Information:
    N = Number of data records
    K = Order data fields
     r=2
    µk = Field weight given by user

                                                            3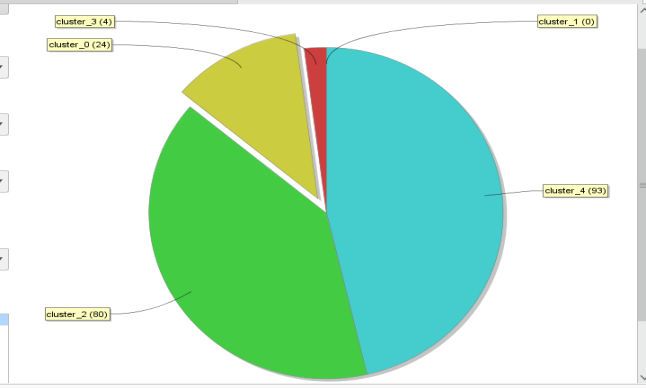
Annual Conference on Computer Science and Engineering Technology (AC2SET) 2020                        IOP Publishing
IOP Conf. Series: Materials Science and Engineering       1088 (2021) 012034     doi:10.1088/1757-899X/1088/1/012034

2. K-Means
K-means clustering is a non-hierarchical cluster analysis method that attempts to partition existing
objects into one or more clusters or groups of objects based on their characteristics, so that objects that
have the same characteristics are grouped into the same cluster and objects that have different
characteristics. grouped into other clusters. The K-Means Clustering method seeks to classify existing
data into several groups, where the data in one group have the same characteristics as each other and
have different characteristics from the data in other groups[11]. The K-Means Clustering method aims
to minimize the objective function set in the clustering process by minimizing the variation between
data in a cluster and maximizing variation with data in other clusters. It also aims to find groups in the
data, with the number of groups represented. by variable K. The variable K itself is the number of
clusters desired. Divide data into groups. This algorithm accepts input in the form of data without class
labels. This is different from supervised learning which accepts input in the form of vectors (¬x¬1, y1),
(¬x¬2, y2), ..., (¬x¬i, yi), where xi is data from a training data and yi is the class label for xi

3. K-Medoids
K-Medoid is a classic partition clustering technique that groups data sets of ni objects into k groups
known a priori. Compared to K-Mens, K-Medoid is more powerful for noise (noise) and outliers because
it minimizes the number of paired dissimilarities, not the sum of squares of the Euclidean distance. A
medoid can be defined as a cluster object whose average difference for all objects in the cluster is
minimal, namely the most located point in the cluster some data [12]. K-Medoid algorithm steps:
a. Initialize k cluster centers (number of clusters)
b. Allocate each data (object) to the nearest cluster using the Euclidian Distance measure equation with
    the equation:

c. Randomly select from a new medoid candidate cluster object
d. Calculate the distance of each object in each cluster with the new medoid candidate.
e. Calculate thetotal deviation(S) by calculating the value of the new total distance - the old total
   distance. If S
Annual Conference on Computer Science and Engineering Technology (AC2SET) 2020 IOP Publishing
IOP Conf. Series: Materials Science and Engineering 1088 (2021) 012034 doi:10.1088/1757-899X/1088/1/012034
Figure 3. Graph of AVG Value Within Centroid Distance k-Means
a. Davies Bouldin Indexs
The Davies bouldin index (DBI) is one of the methods introduced by David L. Davies and Donald W.
Bouldin. Davies Bouldin Index is used to evaluate clusters in general based on the quantity and
proximity between cluster members. The calculation of the value of the Davies Bouldin Index is based
on the ratio of the ratio of the ith cluster to the jth cluster. The smaller the Davies Bouldin Index value,
the better the resulting cluster. Calculation of the DBI value with an accuracy of -1.777
3.2 Algorithm K-Medoids
a. The K-Means Algorithm
From the results of processing the dataset using the K-Medoids clustering algorithm, the avg distance
between centroids is -4,241, while for cluster 0 model is 698 items, cluster 1 is 74 items, cluster 2 is 98
items, cluster 3 is 9 items and cluster 4 is 1, of a total of 880 items. For more details, please note in table
3:
Table 3. Results of the Cluster Distance Performance Process
Algorithm Cluster 0 Cluster 1 Cluster 2 Cluster 3 Cluster 4
K-MEANS 698 items 74 items 98 items 9 items 1 items
So that when it is depicted in the graph about the results of the AVG Within Distance Algorithm K-
Medoids in Figure 3.
Figure 4. Graph of AVG Value Within Centroid Distance K-Medoids
b. Davies Bouldin Index’s
The Davies bouldin index (DBI) is one of the methods introduced by David L. Davies and Donald W.
Bouldin. And used to evaluate clusters in general based on the quantity and proximity between cluster
members. The calculation of the value of the Davies Bouldin Index is based on the ratio of the ratio of
the with cluster to the jth cluster. The smaller the Davies Bouldin Index value, the better the resulting
cluster. Calculation of the DBI value with an accuracy of -1.535.
5Annual Conference on Computer Science and Engineering Technology (AC2SET) 2020 IOP Publishing
IOP Conf. Series: Materials Science and Engineering 1088 (2021) 012034 doi:10.1088/1757-899X/1088/1/012034
4. Conclusion
The results of the two research scenarios that have been carried out show consistent DBI values between
K-means and K-medoids. clustering to measure the results of the fish dataset is grouped into 5 clusters,
with the best DBI results on the k-means algorithm with an accuracy of -1.535, while the DBI results on
the k-medoids algorithm are accurate to -1.777.
References
[1] C. C. Blanco, F. Caro, and C. J. Corbett, “Do carbon abatement opportunities become less
profitable over time? A global firm-level perspective using CDP data,” Energy Policy, vol. 138,
no. October 2018, p. 111252, 2020, doi: 10.1016/j.enpol.2020.111252.
[2] K. K. Sharma and A. Seal, “Clustering analysis using an adaptive fused distance,” Eng. Appl.
Artif. Intell., vol. 96, no. September, p. 103928, 2020, doi: 10.1016/j.engappai.2020.103928.
[3] M. Kato et al., “Clustering patients by depression symptoms to predict venlafaxine ER
antidepressant efficacy: Individual patient data analysis,” J. Psychiatr. Res., vol. 129, pp. 160–
167, 2020, doi: 10.1016/j.jpsychires.2020.06.011.
[4] A. B. S. Serapião, G. S. Corrêa, F. B. Gonçalves, and V. O. Carvalho, “Combining K-Means and
K-Harmonic with Fish School Search Algorithm for data clustering task on graphics processing
units,” Appl. Soft Comput. J., vol. 41, pp. 290–304, 2016, doi: 10.1016/j.asoc.2015.12.032.
[5] H. Yao, Q. Duan, D. Li, and J. Wang, “An improved K-means clustering algorithm for fish image
segmentation,” Math. Comput. Model., vol. 58, no. 3–4, pp. 790–798, 2013, doi:
10.1016/j.mcm.2012.12.025.
[6] P. S. Lai and H. C. Fu, “Variance enhanced K-medoid clustering,” Expert Syst. Appl., vol. 38,
no. 1, pp. 764–775, 2011, doi: 10.1016/j.eswa.2010.07.030.
[7] A. V. Ushakov and I. Vasilyev, “Near-optimal large-scale k-medoids clustering,” Inf. Sci. (Ny).,
vol. 545, pp. 344–362, 2021, doi: 10.1016/j.ins.2020.08.121.
[8] S. Anwar, N. D. Nuris, and Y. A. Wijaya, “Pengelompokkan Tingkat Pemahaman Kurikulum
Berbasis KKNI Menggunakan Metode X-Means Clustering,” vol. 04, no. 2, pp. 187–190, 2019,
doi: 10.30591/jpit.v4i2-2.1869.
[9] W. Zhu, J. Jiang, C. Song, and L. Bao, “Clustering algorithm based on fuzzy c-means and
artificial fish swarm,” Procedia Eng., vol. 29, pp. 3307–3311, 2012, doi:
10.1016/j.proeng.2012.01.485.
[10] A. N. Benaichouche, H. Oulhadj, and P. Siarry, “Improved spatial fuzzy c-means clustering for
image segmentation using PSO initialization, Mahalanobis distance and post-segmentation
correction,” Digit. Signal Process. A Rev. J., vol. 23, no. 5, pp. 1390–1400, 2013, doi:
10.1016/j.dsp.2013.07.005.
[11] P. Verma and R. D. S. Yadava, “Polymer selection for SAW sensor array based electronic noses
by fuzzy c-means clustering of partition coefficients: Model studies on detection of freshness
and spoilage of milk and fish,” Sensors Actuators, B Chem., vol. 209, pp. 751–769, 2015, doi:
10.1016/j.snb.2014.11.149.
[12] M. Sun, X. Sun, and D. Shan, “Pedestrian crash analysis with latent class clustering method,”
Accid. Anal. Prev., vol. 124, no. November 2018, pp. 50–57, 2019, doi:
10.1016/j.aap.2018.12.016.
6You can also read