(ROAM) User Guide Response Outreach Area Mapper - www.census.gov/roam
←
→
Page content transcription
If your browser does not render page correctly, please read the page content below
Response Outreach Area Mapper
                 (ROAM)
                User Guide

                www.census.gov/roam

ROAM                                   June 2019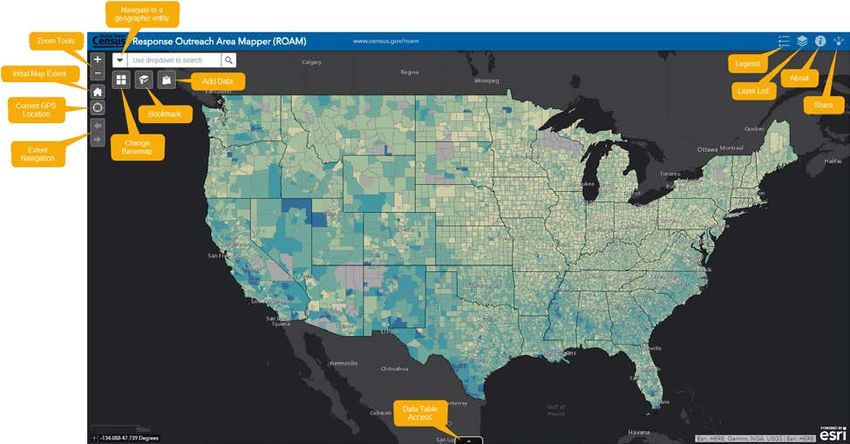
Table of Contents

1     General Purpose of the Response Outreach Area Mapper (ROAM) ............................................. 3
2     Census Bureau Planning Database (PDB) ................................................................................. 4
3     Low Response Score.............................................................................................................. 4
4     General Application Use ........................................................................................................ 5
5     Application Interface Overview............................................................................................... 6
    5.1       Navigate to a geographic entity ........................................................................................ 6
    5.2       Zoom Tools ................................................................................................................... 7
    5.3       Initial Map Extent .......................................................................................................... 7
    5.4       Current GPS Location ..................................................................................................... 7
    5.5       Extent Navigation........................................................................................................... 7
    5.6       Change Basemap ............................................................................................................ 7
    5.7       Bookmark ..................................................................................................................... 7
      5.7.1         Create a Bookmark .................................................................................................. 7
      5.7.2         Go back to a Bookmark............................................................................................ 7
      5.7.3         Delete a Bookmark .................................................................................................. 8
    5.8     Add Data ....................................................................................................................... 8
    5.9     Legend .......................................................................................................................... 8
    5.10    Layer List ...................................................................................................................... 9
    5.11    About...........................................................................................................................10
    5.12    Share ...........................................................................................................................10
    5.13    Data Table Access .........................................................................................................10
6     Pop-Up Overview .................................................................................................................10
7     Data Table Overview ............................................................................................................11
    7.1       View Full Variable Name ...............................................................................................12
    7.2       Data Dictionary for Data Table .......................................................................................13
      7.2.1         Spatial Fields .........................................................................................................14
      7.2.2         PDB Fields/Additional Documentation .....................................................................15
      7.2.3         FCC Fields/Additional Documentation .....................................................................15
      7.2.4         2020 Census Audience Segmentation Field/Additional Documentation .........................15
8     Using the Data Table ............................................................................................................15
    8.1       Sort .............................................................................................................................15

                                                                                                                                      1|P a g e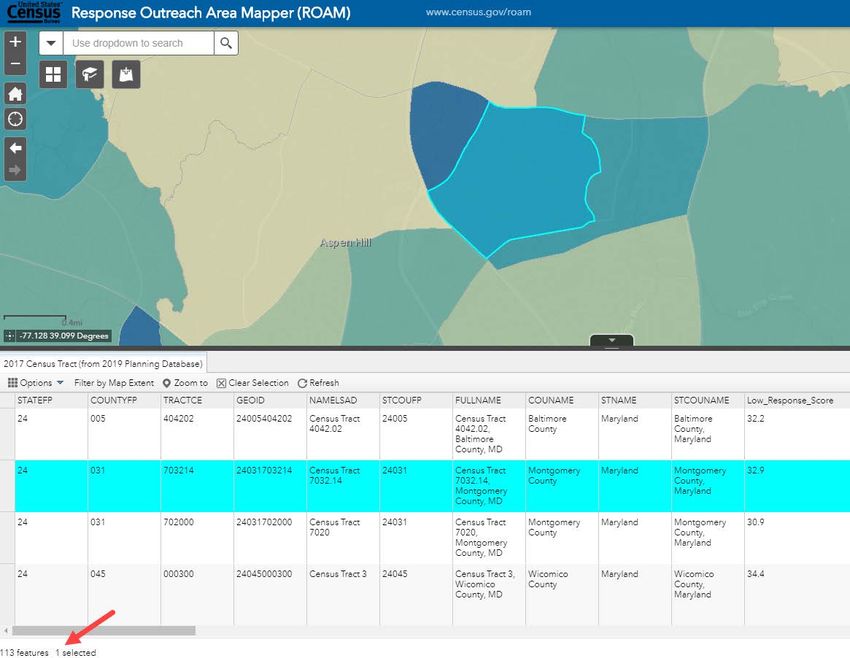
8.2       Filter ............................................................................................................................16
       8.2.1         Add a filter expression ............................................................................................16
       8.2.2         Add an expression set .............................................................................................17
     8.3      Download.....................................................................................................................18
     8.4      Microsoft Excel.............................................................................................................19
9      Resources ............................................................................................................................22
10         Known Issues ...................................................................................................................22

                                                                                                                                        2|P a g e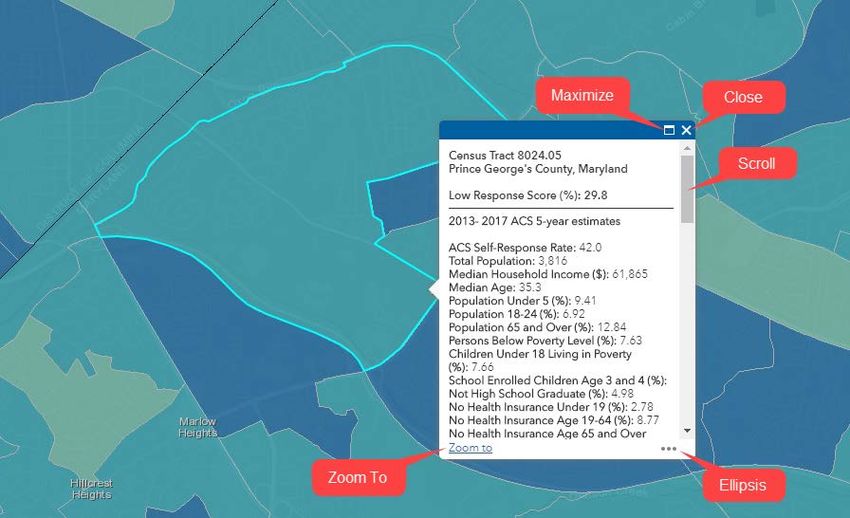
1 General Purpose of the Response Outreach Area
  Mapper (ROAM)

The Census Bureau’s Response Outreach Area Mapper (ROAM) application was developed to
make it easier to identify hard-to-survey areas and to provide a socioeconomic and
demographic characteristic profile of these areas using American Community Survey (ACS)
estimates available in the Planning Database. Learning about each hard-to-survey area allows the
U.S. Census Bureau to create a tailored communication and partnership campaign, and to plan
for field resources including hiring staff with language skills. These and other efforts can
improve response rates.

Users include Census Bureau Field staff, regional office staff, local officials, other external
stakeholders and partners, and the public. The intent is to make this dataset more accessible to
assist outreach and planning efforts. Users visualize areas by predicted mail non-response rates
to determine the location of harder-to-count areas. Socioeconomic and demographic
characteristics provided by the American Community Survey (ACS) are available with a mouse
click for users to learn more about an area. Outreach and planning efforts can be well informed
and tailored by area.

This web mapping application provides the opportunity to make the Planning Database,
including a metric called the Low Response Score (LRS)—or more simply, predicted mail non-
response rate—much easier to use and access. The Planning Database is publicly available now,
but it is a large comma-delimited file and requires software (e.g., Excel, SAS, R) to open and
explore it. Beyond that, mapping the LRS requires an entirely different set of software and user
skills. Users can now simply open a web browser, look at a map of census tracts classified and
shaded by their LRS score, and quickly review a subset of the Planning Database variables
(including American Community Survey estimates) to help reveal why an area may be harder to
count. For example, a census tract where 52.6% of the households have no one in the household
age 14 or above who speaks English “very well” is helpful in understanding why response rates
may be lower there.

Specifically, the Census Bureau will use this tool to 1) plan outreach, marketing, and
promotional efforts, as well as 2) aide in the planning of recruitment activities and staffing.

                                                                                             3|P a g e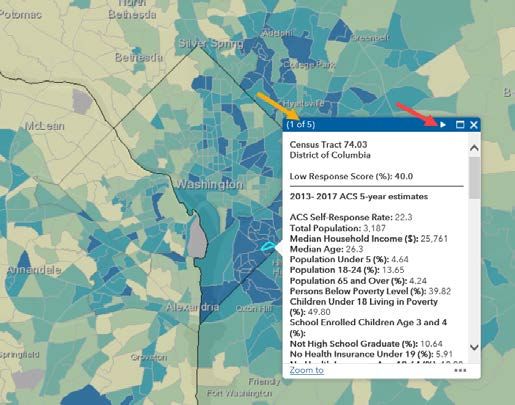
2 Census Bureau Planning Database (PDB)

Available online: https://www.census.gov/topics/research/guidance/planning-databases.html

The Census Bureau Planning Database (PDB) exists to plan field activities and for research
purposes. The PDB includes the Low Response Score, 2010 Census operational data, and select
American Community Survey (ACS) estimates. In its raw form, the PDB can be used in many
ways, including the following:

   •   Identifying areas where special outreach and promotion efforts could be considered.
   •   Linking spatial map data files to create thematic maps.
   •   Generating reports, cross tabulations, and simple analyses.
   •   Planning recruitment activities.

Hard-to-survey areas—those identified by higher Low Response Scores—across the country are
hard-to-survey for different reasons. Learning about each hard-to-survey area allows the Census
Bureau to create a tailored communication and partnership campaign, and to plan for field
resources including hiring staff with language skills. These and other efforts can improve
response rates.

The PDB is released at two levels of geography: 1) census tract, and 2) census block group. The
ROAM application exists at the census tract level.

3 Low Response Score

Nationwide, 79.3 percent of households that received a 2010 Census mail questionnaire
completed it and mailed it back. The resulting non-response rate of 20.7 percent was not evenly
distributed across the country, but rather varied greatly by location. The Low Response Score
(LRS) Ordinary Least Squares (OLS) regression model attempts to assign these variations in
response rate for individual census tracts given a set of characteristics available in the Planning
Database. In order to predict areas that are less likely to respond, we subtract the return rate from
100 and use that as the dependent variable in calculating the LRS. In other words, the LRS, or
fitted value from the OLS regression, is synonymous with "predicted mail non-response rate." As
an example, an LRS value of 17.7 should be interpreted as 17.7% of households in that census
tract are predicted to NOT self-respond to the decennial census.

                                                                                             4|P a g e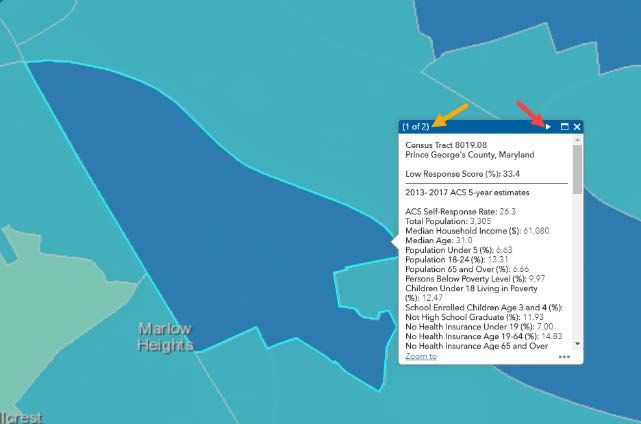
Reasons that an LRS is not calculated for a census tract can include:

   •   a census tract contains zero housing units.
   •   a census tract falls below a minimum threshold for qualifying addresses in the 2010
       Census mailback areas.
   •   a census tract has its 2013-2017 ACS 5-year estimates suppressed to avoid data
       disclosure.
   •   a census tract experiences a geographic boundary change between its 2010 Census
       geography and 2017 geography for which the 2013-2017 ACS 5-year estimates are
       based, making it non-comparable.

In this application, an LRS with no data value (null) indicates an LRS was not calculated.

4 General Application Use
Simply, users can click on a census tract to reveal additional information. In this application, no
data value (null) for the LRS indicates an LRS was not calculated. No data value (null) for the
ACS 5-year estimates indicates the data are not available in the Planning Database.

   •   Click on a census tract to generate a pop-up window.
       • The pop-up indicates:
           1. Identifying information.
           2. Low Response Score.
           3. List of ACS 5-year estimates.

On more advanced terms, users can query/filter a Data Table to reveal a subset of census tracts
that meet desired criteria. See Section 8, Using the Data Table.

                                                                                             5|P a g e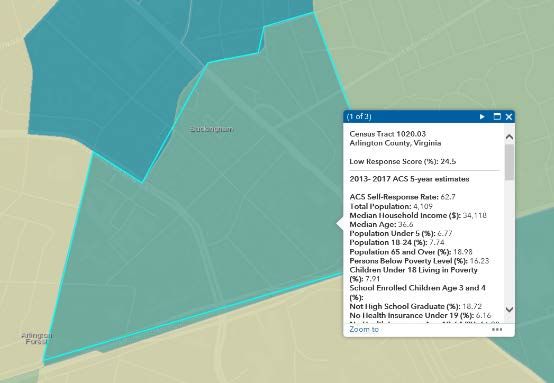
5 Application Interface Overview
The screenshot and descriptions below identifies the different buttons and features of the
application.

       5.1 Navigate to a geographic entity
       Allows you to search for a particular geographic entity to zoom to.

       Search by:
       •   Address
       •   State
       •   County
       •   Census Tract
       •   Regional Census Center (RCC)
       •   Area Census Office (ACO)
       •   Tribal Areas: American Indian Reservation and/or Off-Reservation Trust Land; Hawaiian
           Home Land (HHL); Tribal Statistical Areas including Alaska Native Village Statistical Areas
           (ANVSAs), Oklahoma Tribal Statistical Area (OTSAs), State Designated Tribal Statistical
           Area (SDTSAs), Tribal Designated Statistical Areas (TDSAs)
       •   Alaska Native Regional Corporation (ANRC)
       •   Minor Civil Division
       •   School Districts: Elementary, Secondary, and Unified

                                                                                              6|P a g e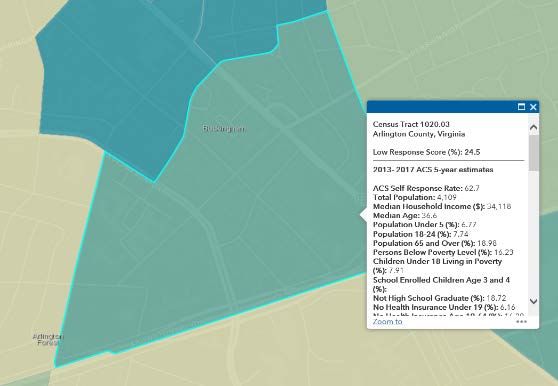
•   116th Congressional District
•   State Legislative District: Upper and Lower Chamber
•   ZIP Code Tabulation Area (ZCTA)
•   Place

5.2 Zoom Tools
Click the plus sign to zoom in. Click the minus sign to zoom out. Use the mouse wheel to zoom
in/zoom out or double click to zoom in.

5.3 Initial Map Extent
Refresh the view back to the contiguous United States. In other words, zoom out to the initial
map extent.

5.4 Current GPS Location
Zoom the map to your current GPS Location (functionality limited based on device/device
settings).

5.5 Extent Navigation
Click the arrow pointing left to go to the previous extent. Click the arrow pointing right to go the
next extent.

5.6 Change Basemap
Choose from various basemaps including satellite imagery and OpenStreetMap.

5.7 Bookmark
Save map extents that you need to revisit. Four bookmarks already exist within the application to
help navigate to Alaska, Hawaii, Puerto Rico, and the continental United States.

        5.7.1 Create a Bookmark
        Navigate to an area of interest, click the Bookmarks button, type a Bookmark Name, and
        click the plus sign.

        5.7.2 Go back to a Bookmark
        Click the Bookmarks button and click on the desired bookmark.

                                                                                            7|P a g e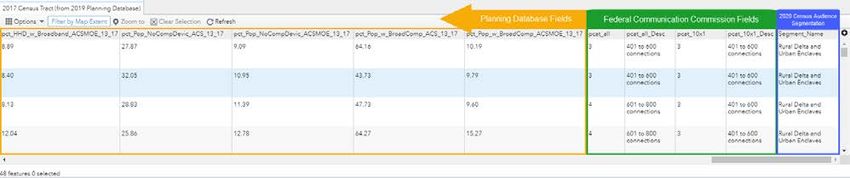
5.7.3 Delete a Bookmark
       Click the Bookmarks button, click the bookmark to delete, and click “Delete” at
       the bottom of the Bookmarks window.

5.8 Add Data
Allows you to look for other spatial datasets that already exist on the web. You can
temporarily add layers to the map. They will not be saved to the map for next time. The
layers you add with Add Data are visible in the Legend and Layers List.

You can use the “Search” tab to look for and add data from a pre-defined existing catalog
of data.

You can use the “URL” tab for other web-based spatial datasets. For example, you can
add any of the Census Bureau TIGERweb REST Services into the map. A good example
of a layer you may want to add is the Transportation (Roads and Railroads) layers. You
can click on the “Map Service Links” URL for the desired layer on the TIGERweb REST
Services webpage and then copy/paste the resulting URL into the Add Data “URL” tab:

https://tigerweb.geo.census.gov/arcgis/rest/services/TIGERweb/Transportation/MapServer

5.9 Legend
Defines the geographic boundaries included in the map by name and symbology as well
as the Low Response Score classification scheme. The layers visible in the Legend reflect
the layers currently visible on the map.

                                                                                     8|P a g e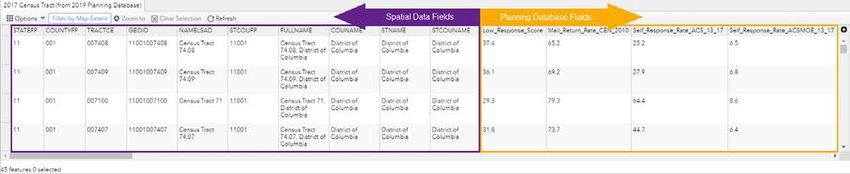
5.10 Layer List
       Allows you to turn on/off spatial layers.

       In the left screenshot below, the red arrows point to a couple of checkboxes. Clicking any
       checkboxes in the Layers List turn on (checked) or off (unchecked) the layers. Please
       note if the “Additional Layers” checkbox is off/unchecked, any of the content nested
       below will also turn off.

In the right screenshot below, the purple arrows point you to the “Transparency” slider bar,
which you can manipulate to make the Low Response Score thematic map darker or lighter.

       The “Transparency” slider bar is revealed once you click on “Transparency”; you can
       click on the slider marker as indicated below and drag it to the left (darker) or right
       (lighter).

                                                                                          9|P a g e
5.11 About
The place to find basic information about the Planning Database and the Low Response Score
and how to interpret it. Also contains source information.
5.12 Share
Allows you to share the application with others by creating a URL to send or to post on social
media. You can simply copy/paste the link generated automatically or you can click on Link
Options to define how the map will get shared. You can define where the map is centered so that
you can share a specific area with someone else. In the Link Preview box, a URL will be
generated for you to copy/paste, or you can go back to the main pane and click one of the social
media icons to share your newly customized URL in that manner.
You can also copy code to embed the application in another website from this pane.
5.13 Data Table Access
The spatial identifier information and data from the Planning Database; Can filter/query;
Show/Hide columns.
6 Pop-Up Overview
The screenshot below identifies the functions of the pop-up that results when you click on a census tract.
• Close – close pop-up
• Maximize – make the pop-up larger
• Scroll – scroll through the data in the pop-up
10 | P a g e• Zoom to – zoom to the extent of the selected tract
• Ellipsis – click to access additional pan to, add a marker, and view in attribute table
Note: When you click on a census tract you are not zoomed into, the application may indicate that several
census tracts were selected. If you would like to click a specific census tract, zoom in further to that area
before clicking on it. The yellow arrow in the screenshot below indicates you have selected two census
tracts. If you click the white arrow head in the pop-up window, you can scroll through all two. This may
also happen if you have several different layers of geographies turned on. Click the white arrow head to
circulate through the selected features.
7 Data Table Overview
The screenshot below identifies the functions available within the Data Table.
11 | P a g e1. Options Menu
a. Show Selected Records – if you have selected records, this field will be active and
only show the selected records in the Data Table
b. Show Related Records – not an available option; it will always be grayed out
c. Filter – use this to Filter/Query the Data Table; see Section 8, Using the Data
Table section for details
d. Show/Hide Columns
e. Export All to CSV (.csv is a simple file format used to store tabular data)
2. Filter by Map Extent – when clicked as indicated by a blue rectangle around the button
the Data Table will only contain records for census tracts in view: . When
off (as in the screenshot above) the Data Table will include all census tract records
3. Zoom to – zoom to the selected census tract; can also double click on a record in the Data
Table to zoom to a given area
4. Clear Selection – deselect any selected records
5. Refresh – click if the Data Table becomes unresponsive
7.1 View Full Variable Name
To see the full extent of a variable name in the Data Table, hover over the column
division in the header of the table until your cursor becomes ‘ ’. At that point, you can
click and drag the column to the right to reveal the full column name. Please see Section
7.2.2 Planning Database Fields/Additional Documentation, Section 7.2.3 Federal
Communications Commission Fields/Additional Documentation, and Section 7.2.4 2020
Census Audience Segmentation Data/Additional Documentation for information about
the column/attribute names.
12 | P a g eFull column/attribute name as seen below:
7.2 Data Dictionary for Data Table
The screenshot below identifies the category of fields included in the data table. Below, is
a description of these:
• Spatial Fields
• Planning Database Fields
• Federal Communications Commission (FCC) Fields
• 2020 Census Audience Segmentation Field
13 | P a g e7.2.1 Spatial Fields
These fields are defined as:
FIELD TYPE DESCRIPTION
STATEFP Text value State FIPS codes
COUNTYFP Text value County FIPS codes
TRACTCE Text value Census tract codes
Census tract identifier; a
concatenation of state FIPs
GEOID Text value
code, county FIPS code , and
census tract code
Translated legal/statistical
NAMELSAD Text value area description and the
census tract name
Census tract identifier;
concatenation of
FULLNAME Text value
NAMELSAD, COUNAME,
and STNAME fields
COUNAME Text value County name
STNAME Text value State name
Concatenation of COUNAME
STCOUNAME Text value
and STNAME fields
7.2.1.1 Spatial Fields Additional Documentation
Census Tract Information
https://www2.census.gov/geo/pdfs/maps-
data/data/tiger/tgrshp2017/TGRSHP2017_TechDoc_Ch3.pdf
• See “3.4 Census Tracts” for general background
information
• See “3.4.1 Census Tract State-based Shapefile Record
Layout (Current)” for description of the spatial-related
fields
American National Standards Institute (ANSI) Codes Reference
Information
https://www.census.gov/library/reference/code-lists/ansi.html
State FIPS Codes information
https://www.census.gov/library/reference/code-lists/ansi.html#par_textimage_3
14 | P a g eCounty FIPS Codes information
https://www.census.gov/library/reference/code-lists/ansi.html#par_statelist
Or reference the entire nation’s worth of counties and FIPS codes directly:
https://www2.census.gov/geo/docs/reference/codes/files/national_county.txt
7.2.2 PDB Fields/Additional Documentation
Within the application, the Planning Database Fields in the Data Table
match exactly as they are in the actual PDB so that users can download
data from the application and then refer back to the full PDB for additional
variables. Full definitions and explanations of these are here:
https://www.census.gov/research/data/planning_database/2016/docs/2016-Tract-
PDB-Documentation.pdf
7.2.3 FCC Fields/Additional Documentation
Within the application, the FCC Fields in the Data Table match exactly as
they are in the actual FCC dataset. Full definitions of the fields can be
found in ROAM’s data dictionary at census.gov/roam. For additional
information:
https://www.fcc.gov/reports-research/maps/residential-fixed-internet-access-
service-connections-per-1000-households-by-census-tract/
7.2.4 2020 Census Audience Segmentation Field/Additional
Documentation
Within the application, the 2020 Census Audience Segmentation Field is
the last column in the Data Table. A full definition of the field can be
found in ROAM’s data dictionary at census.gov/roam. For additional
information:
https://www.census.gov/programs-surveys/decennial-census/2020-
census/research-testing/communications-research/2020-tract-segments.html
8 Using the Data Table
8.1 Sort
15 | P a g eClick on any column heading in the Data Table to Sort the Data Table by that column.
Choose to sort ascending or sort descending.
8.2 Filter
Under the Options menu, click Filter option. Filtering allows you to limit the rows of data
in the Data Table. Only features that meet the criteria will be visible in the Data Table.
You can filter based on any of the columns that are available in the Data Table.
8.2.1 Add a filter expression
To create a simple query, use this option.
16 | P a g eExample: Show records where the Low_Response_Score is between 25
and 35.
8.2.2 Add an expression set
Use this option when you would like to create multiple filters at once.
Resulting Data Table below shows that 113 features meet ALL criteria;
All of the records where Low_Response_Score is greater than 30 in the
state of Maryland:
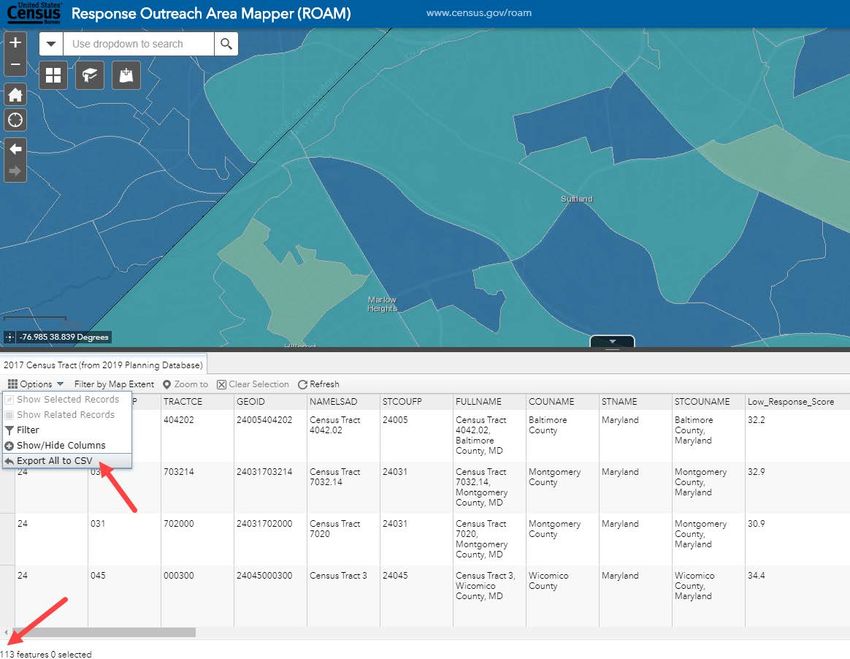
17 | P a g e8.3 Download
To download data from the Data Table, click the Options Menu Export All to CSV.
Keep in mind that “All” either means 1) ALL the features, or census tract records,
currently in the Data Table, or 2) ALL the selected features currently in the Data Table.
In the example below, 113 features will be exported to a CSV because there are no
selected features.
In the example below, a user selected one of the census tract records by clicking on it in
the Data Table. Now, the 1 selected feature will be the only feature downloaded into the
CSV. Use the “Clear Selection” button on the Data Table if you would like to download
all of the current census tract records. Or, Shift+Click multiple rows in the Data Table if
you only want to download a handful.
18 | P a g eFeature Selected
8.4 Microsoft Excel
To open the resulting .csv download in Microsoft Excel with the proper leading zeroes on
the STATEFP, COUNTYFP, TRACTCE, and GEOID fields, follow the steps below:
1. Open Microsoft Excel first rather than double-clicking on the .csv file.
2. File Open
3. Navigate to the downloaded .csv file; you may have to select “All Files” from
the file type drop dox to be able to see it; click “Open”
19 | P a g e4. Make sure the “Delimited” radio button is chosen; click “Next”
5. Check the “Comma” option from the “Delimiters” section; click “Next”
20 | P a g e6. Shift+Click the STATEP, COUNTYFP, TRACTCE, GEOID columns in the
Data Preview so that all four fields are highlighted and then click the “Text”
radio button; click “Finish”:
7. You now have the subset of data you downloaded from the application in a
format where the leading zeroes are not lost.
21 | P a g e9 Resources
Refer to www.census.gov/roam for additional information.
Questions about the Low Response Score or Planning Database can be directed to:
Census.PDB.questions@census.gov
10 Known Issues
• When you click on a census tract you are not zoomed into, the application may indicate
that several census tracts were selected. If you would like to click a specific census tract,
zoom in further to that area before clicking on it. The yellow arrow indicates you have
selected five census tracts. If you click the white arrow head in the pop-up window, you
can scroll through all five.
• When you click on a census tract you are not zoomed into and click “Zoom to” in the
pop-up window, you may see that the entire census tract is not selected once you are
zoomed to it (see below left). Re-click on that particular census tract to see the actual
boundary of the census tract (see below right).
22 | P a g e• You can access this application on a smartphone or other web-connected device.
However, the Filter actions are not very device friendly at the moment.
23 | P a g eYou can also read