Long-term variation of Chlorophyll-a concentration in Qingdao coastal area from MODIS data - IOPscience
←
→
Page content transcription
If your browser does not render page correctly, please read the page content below
IOP Conference Series: Earth and Environmental Science

PAPER • OPEN ACCESS

Long-term variation of Chlorophyll-a concentration in Qingdao coastal
area from MODIS data
To cite this article: Yan Zhou et al 2021 IOP Conf. Ser.: Earth Environ. Sci. 631 012007

View the article online for updates and enhancements.

                               This content was downloaded from IP address 46.4.80.155 on 10/05/2021 at 12:43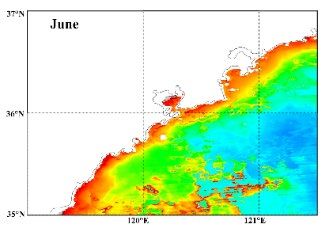
3rd International Conference on Air Pollution and Environmental Engineering                  IOP Publishing
IOP Conf. Series: Earth and Environmental Science 631 (2021) 012007      doi:10.1088/1755-1315/631/1/012007

Long-term variation of Chlorophyll-a concentration in
Qingdao coastal area from MODIS data

                     Yan Zhou *, Yingying Gai and Xiaoyan Liu
                     Institute of Oceanographic Instrumentation, Qilu University of Technology (Shandong
                     Academy of Sciences), Shandong Provincial Key Laboratory of Marine monitoring
                     instrument equipment technology, National Engineering and Technological Research
                     Center of Marine Monitoring Equipment, Qingdao, China

                     *Corresponding author e-mail: zhouyan_ocrs@qlu.edu.cn

                     Abstract. Qingdao coastal water is an important area that provides with traveling,
                     mariculture, etc. On the basis on MODIS satellite remote sensing data from July 2002
                     to June 2014, the spatial-temporal variation of Chlorophyll-a concentration in Qingdao
                     coastal area are presented, and the results show that, an obvious decrease of
                     Chlorophyll-a concentration from offshore to onshore in a pattern parallel to the coastal
                     line is revealed. The monthly mean Chl-a concentration is the lowest outside the
                     Jiaozhou Bay, the highest in the bay in summer, and the lowest in the bay, the highest
                     in the bay mouth in winter. The variation of yearly average Chl-a concentration shows
                     that it keeps the volatility in the bay and the bay mouth, but slowly rising outside the
                     bay. The temporal and spatial features of the Chl-a concentration in the Qingdao coastal
                     area were affected by the variations of the marine environmental factors, such as light,
                     nutrients, ocean currents, sea surface temperature, mixed layer depth, also related with
                     ingestion of zooplankton and so on.

1. Introduction
As primary producers of marine organisms, marine phytoplankton plays an important role in the process
of material cycle and energy conversion in marine ecosystem. Chlorophyll a concentration (Chl-a) is an
important index for marine phytoplankton quantity, and also an important parameters in quality and
degree of organic pollution evaluation of sea water. Spatial-temporal features of Chl-a concentration
contain basic ecological information of sea area, and closely related with light, temperature, salinity,
wind tide and other marine environmental factors [1].
    Compared with conventional ways in Chl-a concentration measurement, remote sensing technique
has advantages of fast detection speed, low cost, large-scale synchronous measurement and so on. With
the development of ocean color remote sensing, many scholars use ocean color remote sensing data to
study Chl-a concentration distribution characteristic in some typical waters of China Sea. Zhao hui el al
investigated the spatial-temporal distributions of the monthly mean chlorophyll-a concentration and
related environmental factors in the South China Sea (SCS) on the basis of the Chl-a data remote sensed
by SeaWiFS from 1997 to 2002 [2]; Lin xueju observed the vertical distribution and diel variation of
Chl-a concentration in the typical areas of East China Sea and Southern Yellow Sea from
“Dongfanghong 2” Autumn voyage in 2000 [3], according to Chlorophyll and primary productivity data

              Content from this work may be used under the terms of the Creative Commons Attribution 3.0 licence. Any further distribution
              of this work must maintain attribution to the author(s) and the title of the work, journal citation and DOI.
Published under licence by IOP Publishing Ltd                          1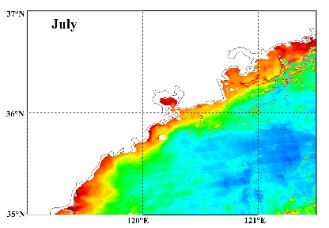
3rd International Conference on Air Pollution and Environmental Engineering IOP Publishing
IOP Conf. Series: Earth and Environmental Science 631 (2021) 012007 doi:10.1088/1755-1315/631/1/012007
measured during four expeditions to the Northern Yellow Sea during the summer and winter of 2006,
and the spring and autumn of 2007, Gao shuang assessed their spatial and seasonal variability as well as
controlling factors, and also the comparison of chlorophyll and primary productivity is made among the
continental shelf seas of China [4]; Qian li used statistical methods including anomaly, sliding average,
power spectral density to analyze the spatial-temporal variation of Chlorophyll-a concentration in the
Bohai Sea from Auqa/MODIS data was analyzed since the starting of MODIS mission in July 2002 till
December 2009 [5].
Qingdao coastal water is an important area that provides with traveling, mariculture, etc. Here,
MODIS level-1B data are used to study Chl-a concentration distribution characteristic in Qingdao
coastal water, and taken a preliminary analysis on the relationship between spatial-temporal variation of
Chl-a concentration and marine environmental factors to provide reference for the marine productivity,
ecological and environment research.
2. Data and methods
2.1. Data
The daily level-1B calibrated reflectance data retrieved by MODIS were acquired from the NASA ocean
color website (http://oceancolor.gsfc.nasa.gov). MODIS aboard on the Terra (EOS AM) and Aqua (EOS
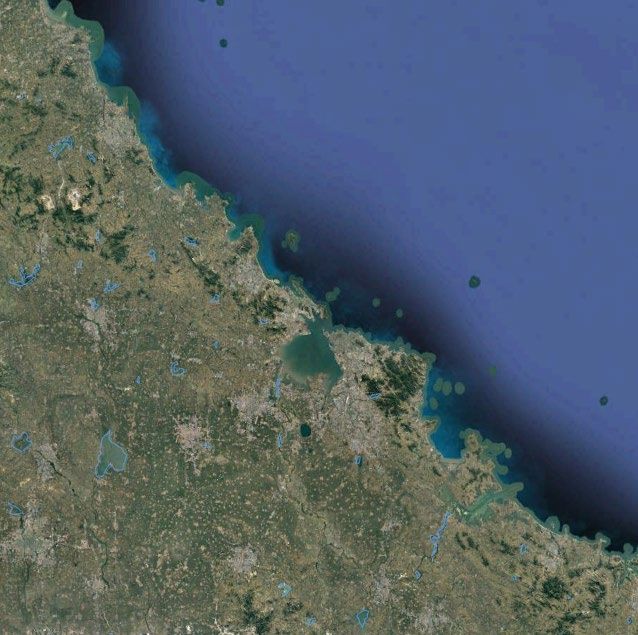
PM) satellites transit twice every day [6]. The study area includes the Jiaozhou Bay and Qingdao coastal
area, and the data available fully cover Qingdao coastal area (35°-37°N, 119°-121.5°E). Combined with
the concrete conditions of Qingdao coastal water, 10 typical study stations were selected according to
major geographic locations, as shown in figure 1. QD_1 station is located in Jiaozhou Bay, and other
stations are in the Qingdao offshore area outside the Jiaozhou Bay. In study area, the 14yr time series of
near-cloud-free satellite images data from July 2002 to June 2014 are selected to investigate the spatial-
temporal variation of Chl-a concentration, and all data are re-gridded to a cylindrical equidistant
projection at 250 meters resolution.
37°N
Qingdao
QD_01
36°N QD_05
QD_02 QD_06
QD_08 QD_03 QD_07
QD_09 QD_04
QD_10
km
0 20 40 60 80
35°N
120°E 121°E
Figure 1. Study region and stations showing the major geographic locations
2.2. Methods
At present, the operational production of ocean color satellite is mostly obtained from empirical
algorithms, and the chlorophyll data is produced with standard NASA algorithms OC3M and OC4 [7,
8]. OC3M algorithm is used in this paper:
2
+ 0.659 R 3 −1.403 R 4 Rrs 443 > Rrs 488
Chl-a = 100.283− 2.753 R +1.457 R , R = log10 ( ) (1)
Rrs 551
Where, Rrs is remote sensing reflectance. Due to the wide variations of optical properties in global
ocean, an empirical relationship could not apply to all water bodies unless case I waters. In addition,
2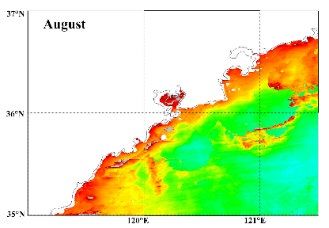
3rd International Conference on Air Pollution and Environmental Engineering IOP Publishing
IOP Conf. Series: Earth and Environmental Science 631 (2021) 012007 doi:10.1088/1755-1315/631/1/012007
empirical relationship is difficult to take error sources analysis and error budget evaluation. The error of
Chl-a operational inversion is about 30% in case I waters, but the very big error exists in case II waters.
Through processing of SeaDAS software, level-2 chlorophyll data is achieved from level-1B dataset,
and applied statistical methods to get spatial-temporal distribution features. The built-in algorithm of
Chl-a inversion in SeaDAS is developed for open ocean waters (case I waters), but it would overestimate
inversion value in case II waters. Though the sea water in Qingdao coastal area belongs to case II waters,
the variability tendency in SeaDAS processing obtained is the same as in-situ measurements. In this
paper, we only use the data achieved from SeaDAS processing to analyze variation tendency.
3. Results
The spatial-temporal variability of chlorophyll can display basic ecological information of study sea
area, and the marine environmental factors (light, nutrients, temperature, mixed layer depth and
monsoons, etc.) as well as zooplankton have great influence on the variations of phytoplankton and
chlorophyll in ocean waters.
3.1. Seasonal variability
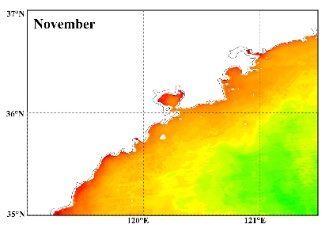
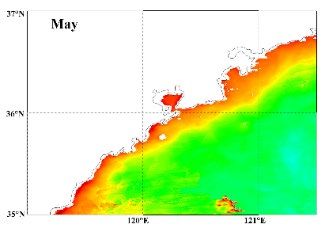
As taken average on 14yr time series Chl-a concentration data in study area by month, monthly average
Chl-a concentration image data are obtained, as shown in Figure 2.
Figure 2. Seasonal distribution of Chl-a concentration in Qingdao coastal water
According to monthly Chl-a concentration statistic, taken 4×4 pixels average value on each station,
and seasonal variability graph of Chl-a concentration are obtained, as shown in figure 3(a). From statistic
curve on each station, the monthly mean Chl-a concentration is the lowest outside the Jiaozhou Bay,
higher in the bay mouth, the highest in the bay during the summer, and the lowest in the bay, higher
outside the bay, the highest in the bay mouth during the winter. A systematic decrease of Chl-a
concentration from onshore to offshore in a pattern parallel to the coastal line is revealed in figure 3(b).
Such a distribution is expected as the bottom portion is constantly mixing and exchanging waters with
the nearby clear oceanic waters by tides and currents, whereas the waters with higher Chl-a value are
affected by land and river runoff. These spatial variations clearly indicate the different forces (tides,
river flows, ocean current, etc.) in modulating optical properties of coastal ecosystem. Chl-a
concentration of QD_1 station in the Jiaozhou Bay is rather changeable month by month and showing
3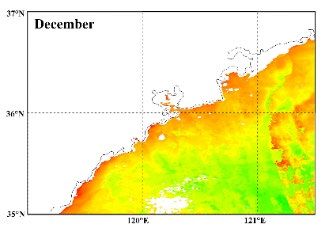
3rd International Conference on Air Pollution and Environmental Engineering                  IOP Publishing
IOP Conf. Series: Earth and Environmental Science 631 (2021) 012007      doi:10.1088/1755-1315/631/1/012007

two peaks in August in summer and February in winter, the summer peak sharply higher than the winter
peak, corresponding to two algal blooms in summer and winter, monthly average chlorophyll
concentrations of sea surface water varies from 0.57 to 14.41 mg/m3. Attribute to some factors as rapid
development of aquaculture industry and intensive growing of human activities, coastal water in
Jiaozhou Bay has serious problems with eutrophication. Besides nutriment from land-runoff inputs, the
pollutants produced by human activity are difficult to spread to the offshore waters due to confinement
of coastal current, so it provides conditions for the growth of phytoplankton and lead to a higher Chl-a
concentration in coastal area [9]. According to reports [10], annual mean fog days in Northern Yellow
Sea are 78 days, up to 96 days, at least 69 days, and fog days are gradually increased from the beginning
of March, mainly concentrated in May to July, especially most occurrence in July for monthly average
of 24 days, end with the seasonal movement of the subtropical high in mid-to-end of August, and less
of fog days in other months. It suggests that autumn light conditions are far better than every other
season of the year, and it might become one of the important reasons for high Chl-a value in autumn.
For the difference on two peaks in one year, it is caused by some environment factors between summer
and winter, and such environment factors as light and temperature that go with the seasons have an
important effect on the growth of planktonic algae.

                                                                              (a)

                   (b)                            (c)                               (d)
                 Figure 3. Seasonal variability of Chl-a concentration on each station

   Figure 3(c) displays the Chl-a variation on the stations with the same distance along the coast. In
Qingdao coastal waters, the sea water in the bay are exchanged with the clear oceanic water outside the
bay through QD_2 station at the bay mouth, and the sea water on QD_5 station and QD_8 station are
more affected by land. Despite the differences on exchanges of water masses, the variation tendency of
Chl-a value among the three stations are basically the same. The minimum Chl-a value is appeared in
July, mainly caused by the Cold Water Mass Yellow Sea, forming the thermocline, causing the nutrient
deficiency in sea surface and affecting the phytoplankton growth. As sea water temperatures rise and
the intensifying of sunlight that lead to the rapid growth of phytoplankton, the maximum Chl-a value is
appeared in September. The range of monthly Chl-a value variation is 2.97 to 5.69 mg/m3 at the bay

                                                     4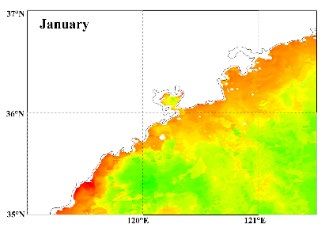
3rd International Conference on Air Pollution and Environmental Engineering                  IOP Publishing
IOP Conf. Series: Earth and Environmental Science 631 (2021) 012007      doi:10.1088/1755-1315/631/1/012007

mouth (QD_2 station), 1.54 to 3.44 mg/m3 at the northeast Qingdao coastal water (QD_5 station), and
0.78 to 2.69 mg/m3 at the southwest Qingdao coastal water (QD_8 station).
   As seen in figure 3(d), the difference of Chl-a value at QD_4, QD_7 and QD_10 station located in
offshore waters is not very big, and the variation tendencies are basically the same. With adequate
lighting, maximum sea surface temperature and shallow mixing layer in summer, convective mixing is
weaker, and then zooplankton multiplied rapidly, consuming large amounts of phytoplankton, so that
Chl-a concentration reached at the lowest value in July. After that, light began to weaken in autumn, sea
surface temperature gradually decreased and convective mixing strengthened, sea surface nutrient
replenished again, then making Chl-a concentration gradually increased.

3.2. Inter-annual variability
By means of statistic average on time series Chl-a concentration data by year, and taken 4×4 pixels
average value on each station, inter-annual variability of Chl-a concentration are obtained, as shown in
figure 4.

            Figure 4. Inter-annual variability graph of Chl-a concentration on each station

   Under the inter-annual variability graph, except for large variation range on QD_1 station in the bay,
the variation on other stations are small. The changes of Chl-a concentration represents basic biomass
variation, therefor it shows higher basic biomass in 2003, 2008 and 2012, and lower in 2005 and 2010
on QD_1 station in the bay, with Chl-a concentration range of 4.42 to 8.62 mg/m3 and yearly average
on 6.32 mg/m3. Compared to station in the bay, the QD_4 station in the offshore area has lower basic
biomass, with Chl-a concentration range of 1.16 to 1.88 mg•m-3 and yearly average on 1.55 mg/m3.

                                                 (a)                                                   (b)
                   Figure 5. Inter-annual variability tendency of Chl-a concentration

   Four representative stations are selected for long-terms analysis of Chl-a concentration, as given in
figure 5. The results showed that the variation pattern of Chl-a among different regions is not the same.
Since 2002, it keeps the volatility in the bay and the bay mouth (figure 5(a)), but slowly rising outside
the bay (figure 5(b)).

                                                       5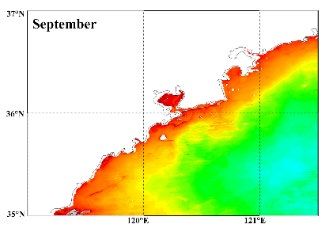
3rd International Conference on Air Pollution and Environmental Engineering                  IOP Publishing
IOP Conf. Series: Earth and Environmental Science 631 (2021) 012007      doi:10.1088/1755-1315/631/1/012007

4. Conclusion
Using MODIS satellite data provided by NASA, we studied spatial-temporal variation characteristic of
Chl-a concentration in Qingdao coastal water in this paper, and it has important influence on marine
ecosystem research. The results show that, an obvious decrease of Chlorophyll-a concentration from
offshore to onshore in a pattern parallel to the coastal line is revealed. The monthly mean Chl-a
concentration is the lowest outside the bay, the highest in the bay in summer, and the lowest in the bay,
the highest in the bay mouth in winter. The variation of inter-annual average Chl-a concentration shows
that it keeps the volatility in the bay and the bay mouth, but slowly rising outside the bay.
   Due to limitations of the measured data, this is only a preliminary study, and the current target is a
qualitative analysis of Chl-a concentration distribution and temporal variation in Qingdao coastal area.
Qingdao coastal water is typical class II water, chlorophyll a concentration retrieved by MODIS
experience algorithm will be higher relative to measured data, and more suitable chlorophyll algorithm
for the coastal waters of China Sea remains to be further studied. All manuscripts must be in English,
also the table and figure texts, otherwise we cannot publish your paper. Please keep a second copy of
your manuscript in your office.

Acknowledgments
This work was financially supported by, the National Key Research and Development Program of China,
grant number 2017YFC1404802, the Key Research and Development Program of Shandong, grant
number 2019GHY112017, State Key Laboratory of Tropical Oceanography, South China Institute of
Oceanology, Chinese Academy of Sciences, grant number LTO2017, and the Natural Science
Foundation of Shandong, grant number ZR2019PD021.

References
[1] Chu--Qun, C.; Ping, S.; Qing--Wen, M. Satellite remotely-sensed analysis of distribution
        characters of chlorophyllconcentration in South China Sea. Tropic Oceanology 2001.
[2] Zhao, H.; Qi, Y.Q.; Wang, D.X. Study on the features of Chlorophyll-a derived from SeaWiFS
        in the South China Sea. Acta Oceanol Sin 2005, 27, 45-52.
[3] Xue-Ju, L. Vertical characteristics and diel variation of Chlorophyll a in the typical areas of East
        China Sea and Southern Yellow Sea. Marine Sciences 2002.
[4] Gao, Y.; Li, Z. Spatial and Seasonal Variation of Chlorophyll and Primary Productivity in
        Summer and Winter in the Northern Yellow Sea. Periodical of Ocean University of China
        2009.
[5] Li, Q.; Wen-Ling, L.; Xiao-Shen, Z. Spatial-temporal variation of Chlorophyll-a concentration in
        Bohai Sea based on MODIS. Marine ence Bulletin 2011, 30, 683-687.
[6] Li, N.; Shi, K.; Zhang, Y.L.; Gong, Z.J.; Peng, K.; Zhang, Y.B.; Zha, Y. Decline in transparency
        of Lake Hongze from long-term MODIS observations: Possible causes and potential
        significance. Remote Sens-Basel 2019, 11.
[7] Carder, K. MODIS ccean science team algorithm theoretical basis document. ATBD 19, Case 2
        Chlorophyll a, version 7. NASA MODIS Web. http:// modis.gsfc.nasa.gov /data / atbd/
        atbd_mod19. pdf 2003.
[8] Tilstone, G.; Mallor-Hoya, S.; Gohin, F.; Couto, A.B.; Sa, C.; Goela, P.; Cristina, S.; Airs, R.;
        Icely, J.; Zuhlke, M., et al. Which ocean colour algorithm for MERIS in North West European
        waters? Remote Sens Environ 2017, 189, 132-151.
[9] S.M; Liu; and; Zhang; and; S.Z; Chen; and; H.T. Inventory of nutrient compounds in the Yellow
        Sea. Cont Shelf Res 2003.
[10] Sukong, Z.; Baochuan, Y. ENSO and variation of seafog over the North Yellow Sea. Advances
        in Marine Science 1990.

                                                     6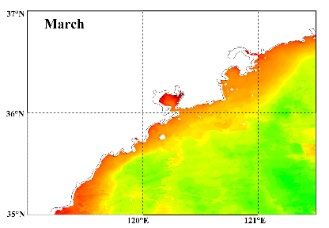
You can also read