Boat traffic at South Beach in Studland Bay, Dorset
←
→
Page content transcription
If your browser does not render page correctly, please read the page content below
Boat traffic at South Beach in Studland Bay, Dorset
Neil Garrick-Maidment FBNA
Executive Director
The Seahorse Trust
www.theseahorsetrust.org
neil.seahorses@tesco.net

Introduction
The number of boating events, anchoring and mooring at South Beach in Studland Bay,
Dorset has been the subject of much contention in recent years, especially since the area
(Studland Bay as a whole) has been nominated as a proposed Marine Conservation Zone
(pMCZ) in 2014.

There have been a number of guesses at boats numbers on the site and with the exception
of a limited study by the ecological survey company Seastar (The Seastar Report) nothing
else has been actually been recorded, except by The Seahorse Trust and NOC at
Southampton University. However there are two very good reports by Drs Jackson and
Collins listed below that can be relied upon for accurate information about the seagrass
meadows of Studland Bay.

The Seahorse Trust did not set out to collect boat event data as this is not its prime
objective at South Beach, which was to study the seahorses on the site, however we have
made some observations during our time studying the site and this report represents these
limited observations. Although limited they are a true representation of boating events and
show clearly that the Dr Simons report Estimating the Degree of Exposure to Leisure Vessel
Anchoring (BORG website, May 2014) has through not observing the boats directly severely
underestimated the actual number of boats that visit South Beach. We are sure this is not
intentional but with limited actual data and anecdotal local observations from a biased
group it would give Dr Simons limited and inaccurate data to work with and so it is not a
surprise he has come to the conclusions he has, through no fault of his own.

Seastars report (reference below) on the seagrass and boat numbers has often been quoted
as the definitive boat count in the area but a number of observations by Seahorse Trust staff
and volunteers and members of Natural England (and many others) have cast doubt on the
accuracy of the observations by a team of students who only occasionally turned up, and
when they were there, they only started at 10 am or 11 am and usually left to 2 pm or 3pm,
giving only the briefest glimpse of what actually occurs in the bay.

                                                                                           1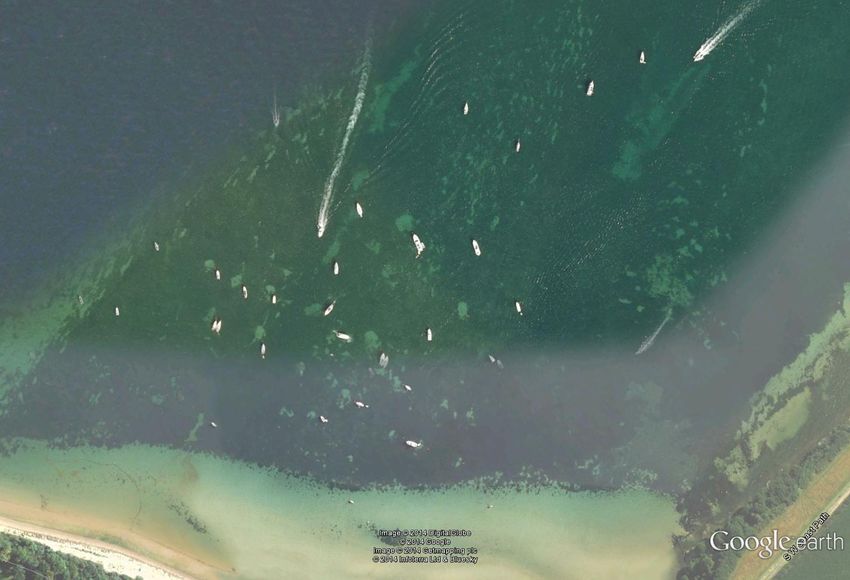
A number of boats turn up late in the evening and overnight before going off early morning
to sail up or down the coastline. They also turn up in the late afternoon to either spend the
evening eating and drinking in the area (on board, in the local pub or having a barbeque on
the beach), some stay for a few hours before leaving and some stay overnight. The Seastar
Report fails to take any of this into account and as such should be dismissed as an
incomplete report or at best a snapshot of the middle of the day; it is certainly not safe to
rely on it as the definitive report of boating events in the bay,

The purpose of this report is to give another viewpoint to the boating events in the bay as
put forward by Dr Simons (BORG) based on actual data collected by The Seahorse Trust as
opposed to an underestimate based on anecdotal biased evidence. In his report Dr Simons
through no fault of his own has an over-estimate of seagrass coverage (in the seagrass
meadow) and an underestimate of actual boat numbers and he also extends the area
included in his report to be much larger northwards, including a large area of sand bed
rather than the seagrass meadow which is subject to the seahorse study. By including an
extra area into the report Dr Simons gives greater exaggeration to the habitats that make up
the study area, especially a sandy bed bias.
By using a lower number of boats than actually use the site it also dissipates the boat
numbers over a much large area, (see figures below) diluting the data to give each boat
more area than actually occurs in reality.
We need to make it clear we do not hold Dr Simons responsible for this because he has
been given data by a biased group of observers and so only has that data to work with,
whereas we have actually counted boats on the site and so can make an informed
judgement based on actual data.

Background to data
It is worth noting this report is only a snapshot of events in the bay for a number of reasons;
however where data is quoted it is come to by the simple process of having a number of
persons present count the boats and an average is derived from the total number put
forward by each person and then divided by the number of people counting to give a mean
average.

The data and information contained in this report is from the 11th of April 2010 until the 7th
of September 2013. Data prior to this was recorded in the diaries of the author but these
have since been accidently discarded, unfortunately without recording the data in them;
data for 2014 to date has not been included to allow for whole years not partial ones.

The dates contained in this report do not represent only diving days; there are a number of
days where diving was not possible for a wide variety of reasons and so observations were
made on land; we estimate there are about 68 to 83 dive days during this period where no
boat data was recorded (counting boats was not our prime objective) but the exact number

                                                                                             2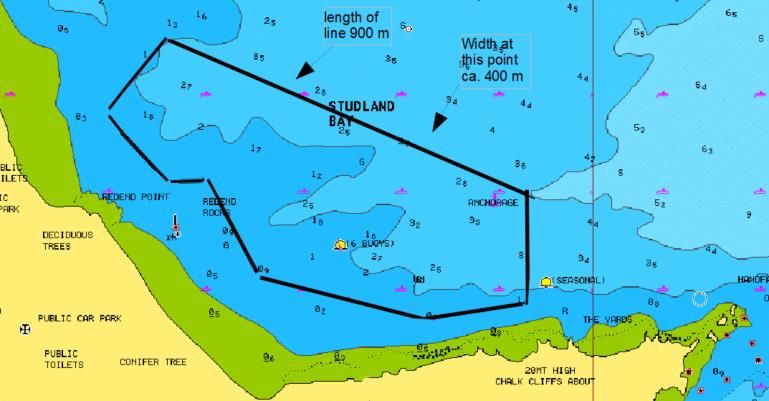
of dive days with no boat data cannot be confirmed, this is a best guess for the period of
11/4/2010 to 7/9/2013.
It is very important to note that most Sundays and Bank Holidays throughout the whole of
the survey have been avoided in the interest of safety to the volunteer divers involved in the
survey work at South Beach. With the sheer number of boats on the site, there is a strong
possibility of an accident between boats and divers and it is a conscious decision to not dive
on these days (there have also been several deliberate attempts to run divers over);
however it is Sundays and Bank Holidays, especially when the weather is fine that the most
number of boats are around and so this needs to be bourne in mind when considering this
report. If the numbers for these days were added to the overall figures it would not only
show very high numbers of boats for these days, it would also put the overall total up
considerably and it would increase the daily average by a very large margin.
We conducted an experiment recently with 6 volunteers to see how accurate a guess of
numbers of boats in the area compared to the exact number of boats present was. The
results of this informal (non-scientific) experiment were quite a surprise. On the day there
were 64 boats present (concluded by actual boat counts and an average gained by dividing
counters by the numbers each person counted). Prior to the actual count each person was
asked to guess (without counting) the number of boats on the site and an average was
derived from each person guess; the average came out at approximately 40; roughly two
thirds of the actual number of boats present.
Although this experiment was not scientific and is accepted as such, it illustrates a point that
on average a guess of numbers is a lot lower than actual figures.
Figure 1. Image taken from Dr Simons report showing his study area in black as opposed to the
actual seahorse study area (in red), represented in figure 2.
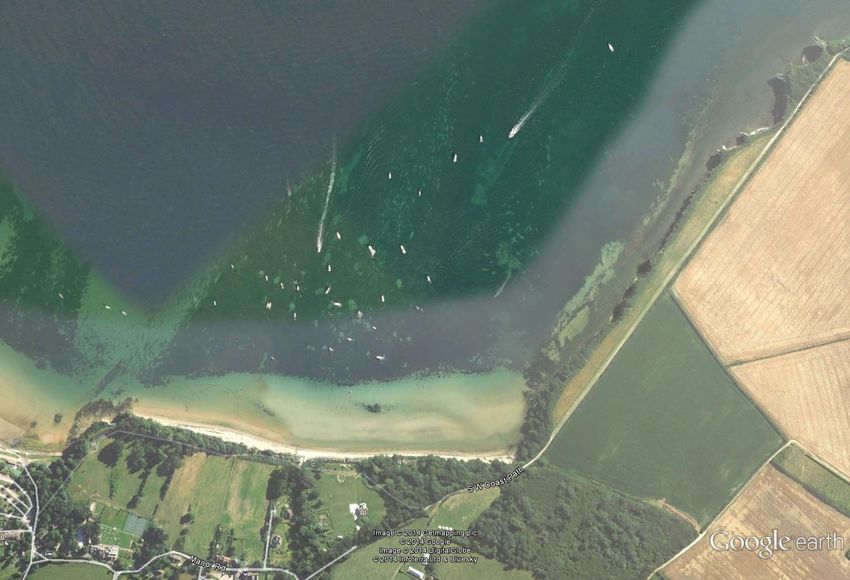
3Figure 2. The Seahorse Trust, seahorse study area. (Courtesy of Google Earth, image 2009)
Although this report is primarily concerned with boat numbers for the South Beach area, the
reasons behind all of the studies and research at South Beach is the state of the habitat of
the Spiny Seahorses (Hippocampus guttulatus), the seagrass. Figure three shows the study
area with red circles on it. Each of these red circles represents damage to the seagrass
through anchor or mooring damage and the whole site has been ground truthed by divers.
This fragmentation has been illustrated by Dr Collins in his paper The impacts of anchoring
and mooring in seagrass, Studland Bay, Dorset, UK and in Drs Jackson and Collins paper, the
MAIA report: A Guide to assessing and managing anthropogenic impact on marine
angiosperm habitat (full references below), both of which clearly show the effect of the
damage which has led to fragmentation of the seagrass meadow.
It is worth noting the Spiny Seahorses (Hippocampus guttulatus) are a fully protected
species under the Wildlife and Countryside Act (1981 as amended) under schedule 5,
section 9 in which the place of shelter of the protected seahorses is also afforded
protection. It is also an offence under this act to disturb a species with this level of
protection in its place of shelter.
Not only are there protected seahorses on the site; the Short Snouted Seahorse
(Hippocampus hippocampus) has also been recorded on the site but other species which
have full protection such as Undulate Rays, English Oysters and truncated Anemones and
possibly one count of a Fan Mussel Shell (Neil Garrick-Maidment; 2014)
4Figure 3. All red circles represent holes created by anchor damage or mooring chains in the
seagrass, as ground truthed by Seahorse Trust divers and others such as National Oceanography
Centre (NOC) divers under the supervision of Dr Ken Collins. (Courtesy of Google Earth, image
2009)
It is worth noting that The Seahorse Trust volunteers (well in excess of 1,020 hours) and
divers from NOC have spent a great deal of time underwater ground truthing surveying the
site at South Beach in Studland Bay, whereas Dr Simons and his colleagues have spent no or
very little time under the water on site and so have little idea as to what truly is happening
under the water. Most observations they have made have been from over the side of the
boat, which can and is confusing as the anchor and mooring holes are often filled in with
drifting algae and weed and so from a boat at the surface it looks as though it is one
continuous seagrass meadow which it is not.
Data
Again it is worth noting in the data collected there are very few Sundays or Bank Holidays
which have the highest level of boat traffic and so the figures below offer a very low average
for the total period of time. If Sundays and Bank holidays had been included then it is
reasonably expected that the daily average would be considerably higher, possibly up to 100
or more per day during the season.
It has been observed that numbers of boats at South Beach can be confusing because boats
are coming and going all the time and so the total numbers of anchoring or mooring events
5are very difficult to ascertain, however observations by Seahorse Trust volunteers (and
others) regularly note boats coming and going all day long and a turnover of total boat
numbers 3 or 4 times in a day is very feasible and highly likely.
The data collected in this report is only a very small part of the total number of boats that
have actually visited South Beach but even using this very small amount of available data it
works out to 75.67 boats per day of observations.
The averages number of boats work out at 75.67 per day as opposed to Dr Simons’ estimate
of 50 but it is worth noting that Sundays and Bank holidays are missing due to safety
concerns for diving amongst so many boats and these days would have a very high level of
boat traffic
This snapshot only represents one or two days a week, so one sixth or one seventh of the
total number of boats on site in a week. It also needs to be taken in consideration that there
are approximately 200 boating days on South Beach per annum, which if you take the
average per day based on the figures presented would account for 15,134 boats per annum
(or 20,000 if the estimate of numbers includes Sundays and Bank Holidays) since 2008 this
would amount to 90,804 mooring or anchoring events (or 120,000 if the estimate of
numbers includes Sundays and Bank Holidays) in 6 years in an area that is two thirds the size
quoted by Dr Simons, or more if the 100 per day average is used.
Dr Simons estimates the main anchoring area at 245,000 sq m which in our opinion it is
much smaller, however even if it was the 245,000 sq m, then 90,000 to 120,000 anchoring
or mooring events in 6 years is a very heavy usage of the site and it is no wonder there is
severe damage to the seagrass meadow with a strong risk the fragmentation as reported by
Drs Jackson and Collins could lead to a collapse of the whole eco-system. All of this bearing
in mind that the seagrass, seahorses and a host of other creatures are protected and the
positive benefits of a seagrass meadow as stated by Ben Jones of the Seagrass Project
(http://www.project-seagrass.co.uk/ ). Positive benefits such as a CO2 sink, a diffuser of
strong weather, protection against coastal erosion, a nursery for commercially sensitive
species and a home to many species such as the seahorses which are legally protected (WCA
2008).
The data collected and estimated relate to an absolute minimum of boat numbers for the
reasons stated above and we estimate numbers to be greatly higher than stated.
The highest number of boats counted in one day was in 2011 where 379 were counted with
the lowest number being in 4 in 2012
6No Date TOTAL No Date TOTAL No Date TOTAL
1 11/04/2010 28 22 12/08/2011 78 43 10/08/2012 146
2 23/04/2010 44 23 13/08/2011 234 44 25/08/2012 4
3 22/05/2010 277 24 17/08/2011 18 45 01/09/2012 42
4 06/06/2010 167 25 20/08/2011 221 46 08/09/2012 94
5 07/08/2010 47 26 25/08/2011 54 47 04/05/2013 43
6 10/08/2010 45 27 27/08/2011 92 48 21/05/2013 9
7 28/08/2010 127 28 10/09/2011 6 49 01/06/2013 26
8 01/09/2010 10 29 28/09/2011 74 50 19/06/2013 46
9 06/09/2010 15 30 30/09/2011 60 51 22/06/2013 6
10 18/09/2010 51 31 27/02/2012 50 52 29/06/2013 103
11 19/09/2010 48 32 30/2/2012 40 53 06/07/2013 275
12 28/09/2010 51 33 13/04/2012 4 54 18/07/2013 122
13 16/04/2010 36 34 19/05/2012 15 55 20/07/2013 97
14 20/04/2010 36 35 25/05/2012 16 56 27/07/2013 66
15 02/06/2010 39 36 31/05/2012 10 57 31/07/2013 93
16 21/06/2010 10 37 30/06/2012 19 58 10/08/2013 133
17 26/07/2011 131 38 06/07/2012 26 59 17/08/2013 44
18 10/11/2011 310 39 14/07/2012 28 60 24/08/2013 64
19 03/08/2011 379 40 20/07/2012 24 61 31/08/2013 79
20 05/08/2011 77 41 27/07/2012 118 62 07/09/2013 36
21 11/08/2011 26 42 03/08/2012 22
TOTALS
Dates 4691
Chart 1 Dates with boat numbers (source, The Seahorse Trust)
400
300
200
100
0
11/04/2010
22/05/2010
07/08/2010
28/08/2010
06/09/2010
19/09/2010
16/04/2010
02/06/2010
26/07/2011
03/08/2011
11/08/2011
13/08/2011
20/11/2011
27/08/2011
28/11/2011
27/02/2012
13/04/2012
25/05/2012
30/06/2012
14/07/2012
27/07/2012
10/08/2012
01/09/2012
04/05/2013
01/06/2013
22/06/2013
06/07/2013
20/07/2013
31/07/2013
17/08/2013
31/08/2013
Graph 1 Dates with boat numbers (source, The Seahorse Trust)
7Conclusion
South Beach at Studland Bay in Dorset has been put forward as a proposed Marine
Conservation Zone for a variety of reasons but mainly due to the presence of seagrass and
more importantly the Spiny Seahorses (Hippocampus guttulatus) which have been shown to
be declining on the site from 40 known individuals in 2008 down to 4 in 2013. During this
same period of time the seagrass meadow has been recorded as fragmenting and is at risk
of degrading beyond repair.
Seagrass meadows are an important site for so many reasons such as CO2 sinks, diffusers of
wave action and they help to protect against coastal erosion, nurseries for commercially
sensitive fish species such as bass and a home to a wide variety of protected species, such as
Undulate Ray, truncated Anemone, English Oyster and in the case of South Beach the Spiny
Seahorses.
It was never The Seahorse Trust’s intention to collect boat traffic data and so our data set is
small but importantly it is an accurate observation of boat numbers as opposed to the
supposition of boats numbers as stated in Dr Simons report ‘Estimating the Degree of
Exposure to Leisure Vessel Anchoring’ published in May 2014 on the BORG website and
presented to a number of authorities.
We have noted in Dr Simons report that the area included in the report is larger than the
study area that has been used by The Seahorse Trust and contains a great deal more sand,
he has also severely underestimated this guess when considering boats numbers on the site,
especially when it comes to the movement of boats in and out all day, which from our
observations could be a turnover of 3 or 4 times on a busy day.
In our calculations we have quite reasonably allowed for 200 boat days per annum as boats
are in attendance on the site in good and bad weather, so our estimate is probably on the
low side but in the interests of fairness it has been kept at this.
Studland Bay has quite rightly been put forward as a proposed Marine Conservation Zone
for a wide variety of reasons and reports such as Drs Simons, Jackson and Collins and work
by The Seahorse Trust are vital in understanding this site so management protocols can be
put into place even if it does not attain its MCZ status. This does not mean no more boating
activity but what is does mean is that measures such as Environmentally Friendly Moorings
should be put in to stop the pressure on the protected seagrass meadow and to allow for
regeneration of the seagrass and in turn an increase in seahorse and other protected and
non-protected species numbers.
Studland Bay can become a model of marine conservation and human usage with the
correct management protocols in place and we hope this report goes some way to helping
others understand the pressures on this very sensitive site.
8Illustrations
Figure 1 Image taken from Dr Simons report showing his study area in black as
opposed to the actual study area (in red), represented in figure 3.
Figure 2 The Seahorse Trust study area. (Courtesy of Google Earth, image 2009)
Figure 3 All red circles represent holes created by anchor damage or mooring chains in
the seagrass as ground truthed by Seahorse Trust divers. (Courtesy of Google Earth, image
2009)
Chart 1 Dates with boat numbers (source, The Seahorse Trust)
Graph 1 Dates with boat numbers (source, The Seahorse Trust)
References
Estimating the Degree of Exposure to Leisure Vessel Anchoring
by M.J.Simons. Published online by Boat Owners’ Response Group, May 2014
http://boatownersresponse.org.uk/anchoring-density.pdf
The Seastar Survey report
(http://www.thecrownestate.co.uk/media/313222/Seastar%20survey%20Studland%20Bay
%20second%20s
eagrass%20monitoring%20report.pdf )
MAIA Report. A Guide to assessing and managing anthropogenic impact on marine
angiosperm habitat
Jackson, E.L., The Marine Biological Association of the UK; Griffiths, C. A., The Marine
Biological Association of the UK; Durkin, O., The Marine Biological Association of the UK;
Collins, K., School of Earth and Ocean Sciences, University of Southampton.
Natural England website.
The impacts of anchoring and mooring in seagrass, Studland Bay, Dorset, UK
KJ Collins, AM Suonpää and JJ Mallinson School of Ocean and Earth Science, University of
Southampton, National Oceanography Centre, Southampton, UK
International Journal of the Society for Underwater Technology, Vol 29, No 3, pp 117-123,
2010
Project Seagrass http://www.project-seagrass.co.uk/
2nd of July 2014. Neil Garrick-Maidment The Seahorse Trust
9You can also read