DELIVERY: DINING IN IS THE NEW DINING OUT - Equity Research - Food On ...
←
→
Page content transcription
If your browser does not render page correctly, please read the page content below
Equity Research

DELIVERY: DINING IN IS THE NEW DINING OUT

Equity Research

MARCH 20, 2018
Andrew M. Charles, CFA
646 562 1332
andrew.charles@cowen.com

                           Please see pages 14 to 16 of this report for important disclosures.

                                                                                                 Source: someecard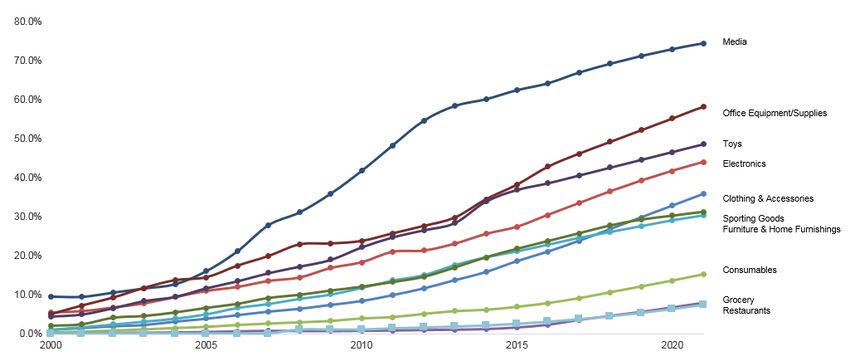
12 Month Restaurant Stock Performance; Investors Appreciate
the Delivery Theme!
                                             WING
                                             NDLS
                                               DIN
                                             TXRH
                                             BLMN
                                              WEN
                                             SHAK
                                             YUM
                                                DRI
                                              MCD
                                               DPZ
                                           S&P 500
                                               BJRI
                                             DNKN
                                             RRGB
                                               QSR
                                             SBUX
                                             SONC
                                             PBPB
                                             LOCO
                                              JACK
                                                EAT
                                             ZOES
                                             CHUY
                                              FRGI
                                             PZZA
                                             CAKE
                                               CMG
                                             BOJA
                                             HABT

                                  -60%   -40%   -20%    0%   20%   40%   60%   80%   100%   120%

Chart Excludes GRUB’s +221% Move!
Source: Thomson Reuters; stocks as of close on 3/9/18
2   |   March 2018
Cumulative and Average Number of Delivery Mentions on Restaurant Industry Earnings Conference Calls All Brands (27) 4Q15 1Q16 2Q16 3Q16 4Q16 1Q17 2Q17 3Q17 4Q17 Total 42 54 60 73 150 206 294 254 208 Average 2 2 2 3 6 8 11 9 8 Sequential q/q growth 29% 11% 22% 105% 37% 43% -14% -15% y/y growth 257% 281% 390% 248% 44% Source: Cowen and Company, Company reports 3 | March 2018
Estimated Restaurant Delivery Market vs Total Restaurant
Industry ($BN)
                                                                                                                         $639.6
                                                                                                                $618.0
                                                                                                       $597.1
                                                                                              $576.9
                                                                                     $557.4
                                                                            $538.5
                                                                   $516.8
                                                          $497.1
                                                $478.0
                              $446.6 $460.5
                     $427.8

                                                                                                                  $66.9    $75.9
                                                                      $38.1 $42.5       $47.4    $52.8 $59.2
                        $23.2    $25.5     $28.3     $30.8 $34.3

                      2011      2012     2013      2014    2015     2016     2017E 2018E 2019E 2020E 2021E 2022E

                                   Total Restaurant Industry Dollars ($, BN)            Total Delivery GMV ($, BN)

Our delivery model is premised on delivery driving about 30% of restaurant industry
sales growth on average from 2017-22, from a starting point of 20% in 2017.
Source: NPD, Cowen and Company

4   |   March 2018
Rapid Growth in Delivery is Complemented by Rapid Shift from
Offline to Online; Est 26% in 2012, 46% in 2017 and 73% in 2022
$75.9
$66.9
$20.6
$59.2
$52.8 $21.1
$47.4
$21.6
$42.5
$38.1 $22.2
$34.3
$22.7
$30.8
$28.3 $22.8
$25.5 $22.6 $55.3
$23.2 $22.1 $45.8
$21.0 $37.6
$20.2
$17.6 $18.8 $30.6
$24.7
$19.7
$12.3 $15.5
$6.7 $8.1 $9.8
$5.6
2011 2012 2013 2014 2015 2016 2017 2018 2019 2020 2021 2022
Total Online Delivery GMV ($) Total Offline Delivery GMV ($)
Total Delivery GMV ($, BN)
Source: Cowen and Company, NPD
5 | March 2018E-Commerce Penetration by Consumer Vertical, 2000-2022E Source: Cowen and Company, U.S. Census Bureau 6 | March 2018
Delivery Users Clearly Prioritize Convenience and Time Over the
Specific Restaurant’s Food
                        40%

                                       36%
                        35%

                                                            30%
                        30%

                        25%
                                                                          23%

                        20%

                        15%

                        10%
                                                                                             7%

                         5%                                                                                     3%
                                                                                                                              1%
                         0%
                                 Delivery from       Cooked food @ Pick-Up from same Pick-up prepared     Cooked food @      Other
                               another restaurant home w/ ingredients  restaurant    food from a grocery home from a meal
                                                  from a grocery store                       store        subscription kit

“During the typical occasion when you order delivery from a restaurant, what would you have eaten
instead during that time had delivery from the restaurant you selected been unavailable?”

Implies delivery occasions are 77% incremental!

 Source: Cowen Proprietary Delivery Survey May 2017, N = 2800

 7    |   March 2018
Who is the Delivery Customer? Survey Conclusions…
Deliv ery Usage
High Medium Low
Age 18-34 35-44 45+
Suburb of Major Metro, Smaller Metro, Small
Geography Major Metro Area
Mid-Sized Metro City
Income >$100k $50k-$100kMonthly Proprietary Survey Data Shows Declining Number of Non-Delivery Users & Corresponding Increase in Light Users Source: Cowen Consumer Tracking Survey, n=~2500, January 2018 9 | March 2018
Have You Used An Online Food Delivery Service (e.g. ordered
prepared food from a restaurant via a web site or app)?

Source: Cowen Consumer Tracking Survey, n=~2500, January 2018

10 |   March 2018
The Four Key Delivery Criteria: The Better Restaurants Can Meet These
Criteria, The More Likely Delivery Will Be A Prosperous Sales Driver

Source: Cowen and Company

11 |   March 2018
Cuisine is Not an Inhibiting Factor!
        0.8

        0.6      0.6
                            0.5
                                     0.4   0.4
                                                 0.4
        0.4
                                                       0.3
                                                             0.2
                                                                   0.2
        0.2

                                                                         0.0
        0.0

        -0.2

                                                                               -0.2
                                                                                      -0.3
        -0.4

        -0.6                                                                                 -0.5
                                                                                                    -0.6

        -0.8

  Correlation between changes in cuisine mix and growth in restaurants added to the
  GrubHub platform

  Implies Steakhouse and Hamburger Are Gaining the Most Delivery Share of Delivery as
  Markets Grow while Pizza and Asian Are Losing the Most Share
Source: Cowen and Company, GrubHub

 12 |     March 2018
Contact Information
Andrew Charles
646.562.1332
andrew.charles@cowen.com
Source: someecard
13 | March 2018ADDENDUM Analyst Certification Each author of this research report hereby certifies that (i) the views expressed in the research report accurately reflect his or her personal views about any and all of the subject securities or issuers, and (ii) no part of his or her compensation was, is, or will be related, directly or indirectly, to the specific recommendations or views expressed in this report. Important Disclosures This report constitutes a compendium report (covers six or more subject companies). As such, Cowen and Company, LLC chooses to provide specific disclosures for the companies mentioned by reference. To access current disclosures for the all companies in this report, clients should refer to https://cowen.bluematrix.com/sellside/Disclosures.action or contact your Cowen and Company, LLC representative for additional information. Cowen and Company, LLC compensates research analysts for activities and services intended to benefit the firm's investor clients. Individual compensation determinations for research analysts, including the author(s) of this report, are based on a variety of factors, including the overall profitability of the firm and the total revenue derived from all sources, including revenues from investment banking, sales and trading or principal trading revenues. Cowen and Company, LLC does not compensate research analysts based on specific investment banking transactions or specific sales and trading or principal trading revenues. Information contained in this report from The NPD Group, Inc. and its affiliates is the proprietary and confidential property of NPD and was made available for publication herein by way of limited license from NPD. Such NPD data may not be re-published in any manner, in whole or in part, without the express written consent of NPD. Disclaimer Our research reports are simultaneously available to all clients are on our client website. Research reports are for our clients only. Not all research reports are disseminated, e-mailed or made available to third-party aggregators. Cowen and Company, LLC is not responsible for the redistribution of research by third party aggregators. Selected research reports are available in printed form in addition to an electronic form. All published research reports can be obtained on the firm’s client website, https://cowenlibrary.bluematrix.com/client/library.jsp. The information, opinions, estimates and forecasts are as of the date of this report and subject to change without prior notification. We seek to update our research as appropriate, but various regulations may prevent us from doing so. Research reports are published at irregular intervals as appropriate in the analyst’s judgement. Further information on subject securities may be obtained from our offices. This research report is published solely for information purposes, and is not to be construed as an offer to sell or the solicitation of an offer to buy any security in any state where such an offer or solicitation would be illegal. Other than disclosures relating to Cowen and Company, LLC, the information herein is based on sources we believe to be reliable but is not guaranteed by us and does not purport to be a complete statement or summary of the available data. Any opinions expressed herein are statements of our judgment on this date and are subject to change without notice. The opinions and recommendations herein do not take into account individual client circumstances, objectives or needs and are not intended as recommendations of investment strategy. The recipients of this report must make their own independent decisions regarding any securities subject to this research report. In some cases, securities and other financial instruments may be difficult to value or sell and reliable information about the value or risks related to the security or financial instrument may be difficult to obtain. To the extent that this report discusses any legal proceedings or issues, it has not been prepared to express or intended to express any legal conclusion, opinion or advice. Our salespeople, traders and other professionals may provide oral or written market commentary or trading strategies to our clients that reflect opinions that are contrary to the opinions expressed in our research. Our principal trading area and investing businesses may make investment decisions that are inconsistent with recommendations or views expressed in our research. Cowen and Company, LLC maintains physical, electronic and procedural information barriers to address the flow of information between and among departments within Cowen and Company, LLC in order to prevent and avoid conflicts of interest with respect to analyst recommendations. For important disclosures regarding the companies that are the subject of this research report, please contact Compliance Department, Cowen and Company, LLC, 599 Lexington Avenue, 20th Floor, New York, NY 10022. In addition, the same important disclosures, with the exception of the valuation methods and risks, are available on the Firm's disclosure website at https://cowen.bluematrix.com/sellside/Disclosures.action. Equity Research Price Targets: Cowen and Company, LLC assigns price targets on all companies covered in equity research unless noted otherwise. The equity research price target for an issuer's stock represents the value that the analyst reasonably expects the stock to reach over a performance period of twelve months. Any price targets in equity securities in this report should be considered in the context of all prior published Cowen and Company, LLC equity research reports (including the disclosures in any such equity report or on the Firm's disclosure website), which may or may not include equity research price targets, as well as developments relating to the issuer, its industry and the financial markets. For equity research price target valuation methodology and risks associated with the achievement of any given equity research price target, please see the analyst's equity research report publishing such targets. Cowen Credit Research and Trading: Due to the nature of the fixed income market, the issuers or debt securities of the issuers discussed in “Cowen Credit Research and Trading” research reports do not assign ratings and price targets and may not be continuously followed. Accordingly, investors must regard such branded reports as providing stand-alone analysis and reflecting the analyst’s opinion as of the date of the report and should not expect continuing analysis or additional reports relating to such issuers or debt securities of the issuers. From time to time “Cowen Credit Research and Trading” research analysts provide investment recommendations on securities that are the subject of this report. These recommendations are intended only as of the time and date of publication and only within the parameters specified in each individual report. “Cowen Credit Research and Trading” investment recommendations are made strictly on a case-by-case basis, and no recommendation is provided as part of an overarching rating system or other set of consistently applied benchmarks. The views expressed in this report may differ from the views offered in the firm’s equity research reports prepared for our clients. Notice to UK Investors: This publication is produced by Cowen and Company, LLC which is regulated in the United States by FINRA. It is to be communicated only to persons of a kind described in Articles 19 and 49 of the Financial Services and Markets Act 2000 (Financial Promotion) Order 2005. It must not be further transmitted to any other person without our consent. 14 | March 2018
Notice to European Union Investors: Individuals producing recommendations are required to obtain certain licenses by the Financial Regulatory Authority (FINRA). You can review the author’s current licensing status and history, employment
history and, if any, reported regulatory, customer dispute, criminal and other matters via “Brokercheck by FINRA” at http://brokercheck.finra.org/. An individual’s licensing status with FINRA should not be construed as an endorsement by
FINRA. General biographical information is also available for each Research Analyst at www.cowen.com.

Additionally, the complete preceding 12-month recommendations history related to recommendation in this research report is available at https://cowen.bluematrix.com/sellside/Disclosures.action

The recommendation contained in this report was produced at March 14, 2018, 12:22 ET. and disseminated at March 14, 2018, 12:22 ET.
Copyright, User Agreement and other general information related to this report
© 2018 Cowen and Company, LLC. . All rights reserved. Member NYSE, FINRA and SIPC. This research report is prepared for the exclusive use of Cowen clients and may not be reproduced, displayed, modified, distributed, transmitted or
disclosed, in whole or in part, or in any form or manner, to others outside your organization without the express prior written consent of Cowen. Cowen research reports are distributed simultaneously to all clients eligible to receive such
research reports. Any unauthorized use or disclosure is prohibited. Receipt and/or review of this research constitutes your agreement not to reproduce, display, modify, distribute, transmit, or disclose to others outside your organization. All
Cowen trademarks displayed in this report are owned by Cowen and may not be used without its prior written consent.

Cowen and Company, LLC. New York (646) 562-1010 Boston (617) 946-3700 San Francisco (415) 646-7200 Chicago (312) 577-2240 Cleveland (440) 331-3531 Atlanta (866) 544-7009 Stamford (646) 616-3000 Washington D.C. (202)
868-5300 London (affiliate) 44-207-071-7500

COWEN AND COMPANY EQUITY RESEARCH RATING DEFINITIONS

Outperform (1): The stock is expected to achieve a total positive return of at least 15% over the next 12 months

Market Perform (2): The stock is expected to have a total return that falls between the parameters of an Outperform and Underperform over the next 12 months

Underperform (3): Stock is expected to achieve a total negative return of at least 10% over the next 12 months

Assumption: The expected total return calculation includes anticipated dividend yield

Cowen and Company Equity Research Rating Distribution
Distribution of Ratings/Investment Banking Services (IB) as of 01/02/18
Rating                                                                Count                     Ratings Distribution                       Count             IB Services/Past 12 Months
Buy (a)                                                                 462                                  60.89%                          107                                  23.06%
Hold (b)                                                                287                                  37.66%                           15                                    5.23%
Sell (c)                                                                  11                                  1.44%                            0                                    0.00%
(a) Corresponds to "Outperform" rated stocks as defined in Cowen and Company, LLC's equity research rating definitions. (b) Corresponds to "Market Perform" as defined in Cowen and Company, LLC's equity research ratings definitions. (c)
Corresponds to "Underperform" as defined in Cowen and Company, LLC's equity research ratings definitions. Cowen and Company Equity Research Rating Distribution Table does not include any company for which the equity research rating is
currently suspended or any debt security followed by Cowen Credit Research and Trading.

Note: "Buy", "Hold" and "Sell" are not terms that Cowen and Company, LLC uses in its ratings system and should not be construed as investment options. Rather, these ratings terms are used illustratively to comply with FINRA regulation.

15 |       March 2018
POINTS OF CONTACT

Analyst Profiles

               Andrew M. Charles, CFA                        Gerald Pascarelli, CFA                              Brian Vieten, CFA
               New York                                      New York                                            New York
               646 562 1332                                  646 562 1362                                        646 562 1341
               andrew.charles@cowen.com                      gerald.pascarelli@cowen.com                         brian.vieten@cowen.com

Andrew Charles is an analyst focused on        Gerald Pascarelli is an associate covering         Brian Vieten is an associate covering the
restaurants. He has spent over seven years     beverages. He joined Cowen in 2014.                restaurant sector. He joined Cowen in 2018
on the sell side covering the sector.                                                             and is a graduate of Boston College.

Reaching Cowen

Main U.S. Locations

New York                                     Boston                                         Cleveland                                     San Francisco
599 Lexington Avenue                         Two International Place                        20006 Detroit Road                            One Maritime Plaza, 9th Floor
New York, NY 10022                           Boston, MA 02110                               Suite 100                                     San Francisco, CA 94111
646.562.1010                                 617.946.3700                                   Rocky River, OH 44116                         415.646.7200
800.221.5616                                 800.343.7068                                   440.331.3531                                  800.858.9316
Atlanta                                      Chicago                                        Stamford                                      Washington D.C.
3399 Peachtree Road NE                       181 West Madison Street                        262 Harbor Drive                              2900 K Street, NW
Suite 417                                    Suite 3135                                     Stamford, CT 06902                            Suite 520
Atlanta, GA 30326                            Chicago, IL 60602                              646.616.3000                                  Washington, DC 20007
866.544.7009                                 312.577.2240                                                                                 202.868.5300

International Location

Cowen International Limited
London
1 Snowden Street - 11th Floor
London EC2A 2DQ
United Kingdom
44.20.7071.7500
                                                                                                           COWENRESEARCH                                           COWEN INC.

16 |      March 2018
You can also read