IN-BAND NETWORK TELEMETRY @ AMLIGHT: LESSONS LEARNED AFTER 2 YEARS - CI LUNCH AND LEARN / JAN 21ST, 2021 - AMLIGHT-INT
←
→
Page content transcription
If your browser does not render page correctly, please read the page content below

CI Lunch and Learn / Jan 21st, 2021

In-band Network Telemetry @ AmLight:
Lessons Learned after 2 years
                                 Jeronimo Bezerra
                                                                  1
Outline
 • In-band Network Telemetry
 • AmLight-INT project after 2 years:
    •   Original Goals
    •   What we are monitoring
    •   Challenges
    •   Rolling out to production
    •   Results
 • What happens next?
    • New projects
 • Future Challenges
 • Team and Opportunities

                                        2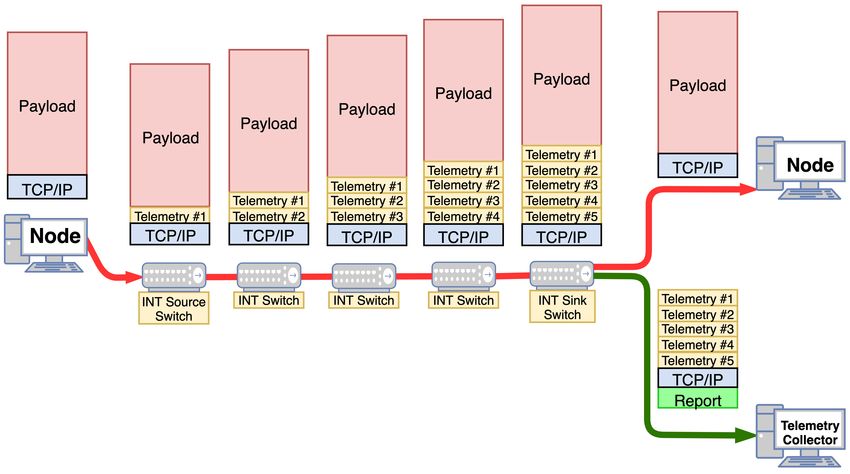
In-band Network Telemetry (INT)

§ INT is a P4 application that records network telemetry information in the packet while the
  packet traverses a path between two points in the network

§ As telemetry is exported directly from the Data Plane, Control Plane is not affected:
   §   Translating: you can track/monitor/evaluate EVERY single packet at line rate and real time.

§ Examples of telemetry information added:
   § Timestamp, ingress port, egress port, queue buffer utilization, sequence #, and many others

                                                                                              3      3
Questions addressed by INT
• How did this packet get here?
• The sequence of network devices a packet visited along its path (Proof-of-Transit).
• LAG? No problem. ECMP? No problem. Layer 2 network? No problem!
• Why is this packet here?
• The set of rules a packet matched upon at every switch along the way.
• How long was this packet delayed?
• The time a packet spent buffered in every switch, to the nanosecond, from end-to-
end.
• Why was this packet delayed?
• Who else was in the buffer that led to an increased delay?
4 4INT: How does it work?
1 – User sends a TCP or UDP
packet unaware of INT
2 – First switch (INT Source
Switch) pushes an INT header +
metadata
B
3 – Every INT switch pushes its
metadata. Non-INT switches just
ignore INT content A 4
1
4 – Last switch (INT Sink Switch) 5
extracts the telemetry and 3
forwards original packet to user 2
5 – Last switch (INT Sink Switch)
forwards the 1:1 telemetry report
to the Telemetry Collector
5 5Introduction to AmLight
• AmLight Express and Protect (AmLight-ExP) (NSF
International Research Network Connections (IRNC)
Award # OAC-2029283)
• 600Gbps of upstream capacity between the U.S. and
Latin America, and 100Gbps to Africa
• Production SDN Infrastructure since 2014
• OpenFlow 1.0, OpenFlow 1.3, and NSI
• NAPs: Florida(2), Brazil(2), Chile, Puerto Rico,
Panama, and South Africa
• Driver for deploying INT: The Vera Rubin
Observatory’s Service Level Agreement (SLA)
6 6AmLight-INT Project
• NSF IRNC: Backbone: AmLight In-band
Network Telemetry (AmLight-INT), Award#
OAC-1848746
• Started in Nov 2018
• AmLight-INT Project Goals:
• Develop and Deploy INT-capable switches
• Deploy INT Telemetry Collectors to collect and
process telemetry metadata
• Develop a new methodology to collect and export
INT data in real time to feed SDN controllers and
users with monitoring information
• Create a Network Telemetry Design Pattern to be
used by other R&E networks
7 7AmLight-INT Project [2]
• Collaboration between FIU and NoviFlow to expand AmLight SDN network
towards an INT-capable domain
• NoviFlow expanded the NoviWare OS to support INT following FIU’s requirements
• FIU developed the telemetry collector and evaluated the NoviFlow switch
• Characteristics of the NoviFlow WB5132 switches @ AmLight:
• Barefoot Tofino chip:
• Provides a software-based SDN evolution path to P4Runtime
• 32 x 100G interfaces (high throughput: 3.2 Tbps)
• NoviWare supports OpenFlow 1.3 and 1.4 with BFD and LAG (also P4Runtime)
• P4/INT 1.0 specification being followed [1]
8 8Research challenges being addressed [1]
• How many high-priority flows can be handled in real-time by the INT Telemetry Collector?
• Currently capable of “processing” 10Mpps* without extra workarounds and nodes.
• What is the impact caused by INT in a complex network such as AmLight-ExP?
• Delay: Pushing INT header takes around 450ns. No impact in a long-haul network.
• MTU: Each switch adds 24bytes. Tofino chip has MTU of 10K. Legacy devices in the path have to be
considered.
• Colocation: Every AmLight PoP needs colocation for the INT Telemetry Collector (telemetry is processed
locally)
• How to dynamically enable INT monitoring of specific flows?
• New OpenFlow 1.3 Experimenter Actions created (push_int, add_int_metadata, pop_int, send_report)
• Enables AmLight to be very specific when selecting what to monitor (per-source, per-destination, TCP and
UDP, per port, etc.)
9 9Research challenges being addressed [2]
• What is the definition of real-time for the AmLight-INT project?
• Receiving “instructions” from consolidated telemetry reports under 200ms
• Collect telemetry data, process it, send summary to central location, process summaries from multiple telemetry
collectors, generate an alert: under 200ms
• Brazil and Chile are 55ms away in propagation delay.
• How to store and process multiple Gbps of telemetry data per switch/point of presence?
• Each site has a high-speed management plane with one telemetry collector
• Process: Using eBPF/XDP for processing telemetry data (Challenge 1)
• Store: Waiting for Challenge #1. Not easy.
• How to share the network state with the users?
• Summaries and events are stored in a time series database (influxDB)
• Data visualization via Grafana
• gRPC is the goal for users interested in consuming summaries in real time
10 10What metadata is being used and how? [1]
• The AmLight INT switches leverage the Tofino chip to collect:
• Per switch:
• Switch ID
• Ingress port
• Egress port
• Ingress timestamp
• Egress timestamp
• Egress queue ID
• Egress queue occupancy
• Per report:
• Report timestamp
• Report sequence number
• Original TCP/IP headers
11What metadata is being used and how? [2]
• Proof of Transit (PoF) or path taken
• Metadata used:
• List of switches
• Per switch:
• Switch ID, Ingress port, Egress port, Egress queue ID
• AmLight is capable of path tracing EVERY packet and recording changes
• Useful for detecting LAG or ECMP hash errors/mismatches
• Useful for detecting unstable links
• Path taken even indicates egress queue ID:
• Useful for evaluating QoS policies
12What metadata is being used and how? [3]
• Instantaneous Ingress and Egress Interface utilization
• Metadata used:
• List of switches
• Per switch:
• Switch ID, Ingress port, Egress port
• From the user TCP/IP header:
• IP length
• AmLight’s telemetry collector monitors and reports egress/outgoing interface utilization
every 50ms*
• Useful for detecting microbursts and precise bandwidth utilization
• *50ms can be tuned down for shorter intervals if needed
• Bandwidth can be monitored per queue
13What metadata is being used and how? [4]
• Instantaneous Egress Interface Queue utilization (or buffer)
• Metadata needed:
• List of switches and their metadata
• Per switch:
• Switch ID, Egress port, Egress Queue ID, Queue Occupancy
• AmLight monitors every queue of every interface of every switch:
• Useful for evaluating QoS policies
• Useful for detecting sources of packet drops
14What metadata is being used and how? [5]
• Sources of jitter:
• Metadata needed:
• List of switches
• Per switch:
• Switch ID, ingress timestamp, egress timestamp
• AmLight monitors per-hop per-packet forwarding delay:
• Useful for evaluating sources of jitter along the path
• Useful for mitigating QoS policy issues (underprovisioned buffers)
• Useful for mitigating traffic engineering issues (underprovisioned links)
15Challenge 1: Receiving telemetry reports
• 100Gbps with 9000-Bytes packets è ~1.5M packets per second
• At AmLight, 4-8 switches connect Chile to the U.S.
• Telemetry reports have up to 300 bytes
• Each user packet triggers a telemetry report (1:1)
• 4.5Gbps of telemetry report for each 100Gbps flow
• Each switch creates a single flow (No hashing possible)
• Solution in place: eBPF/XDP (eXpress Data Path) [4]
16XDP - eXpress Data Path
• A thin layer at lowest levels of network stack
for incoming packets
• Not a bypass
• Run-time programmability via “hook”
• No need to recompile the Kernel
• Comparable to DPDK but simpler
• No need for dedicated CPUs, huge memory
pages, hardware requirements, or licensing)
• Can offload instructions to supported NICs if
available
• Examples: Netronome and Mellanox
• Use by service providers for DDoS mitigation
• 20Mpps per node documented!
• Performance improvements observed:
• From 5kpps with Python3 and C (user-space)
• To 3 Mpps with XDP and one CPU
• Future Lunch and Learn Talk
Source: https://github.com/iovisor/bpf-docs/blob/master/Express_Data_Path.pdf
17Challenge 2: Storing telemetry reports of interest
• Not feasible to save all telemetry reports (yet)
• Solution: XDP code only “stores” counters that report a change in the traffic behaviour:
• A queue that increased/decreased more than 20KBytes
• A flow path that changed
• A hop delay >2 microseconds
• A total delay > 50 microseconds
• An egress interface that is using more than 80Gbps for more than 50ms
• This data is stored in a time series db
• More granular metrics => more CPU usage
• Result:
• Good: Close to real time processing
• Not so good: Not so granular measurements.
[5]
18Challenge 3: Storing all telemetry reports for future research (ML/AI)
• Goal: Store as many telemetry reports as possible for future research to enable ML/AI researchers to have
grounding truth for learning algorithms
• Each Vera Rubin Telescope (LSST) 5-second 13.6GB data transfer will generate ~337MB of telemetry data.
• 1,334 observations/night: 450GB of telemetry data/night
• Challenges:
• How to save Gbps of telemetry reports without increasing OPEX (rack space, power consumption, etc.)
• How/Where/How long to store such data?
• How to make it available preserving privacy but without compromising research?
• What data is really necessary from the telemetry report?
• What has to be combined with reports to give context? Topology?
• Challenge 3 is wide-open. AmLight is looking for collaborations. Let me know if you have suggestions!
19Results and Products
20INT Dissector for Wireshark
21 21INT Telemetry Collector: Two Versions • AmLight-INT Collector Python-edition: • Developed using Python 3.7 • Parses and sends to a RabbitMQ queue to be consumed • Saves Telemetry Reports to disk • Tracks proof-of-transit • QueueTop via CLI • Useful for proof of concepts, protocol evaluations, and small testbeds (
Results
• AmLight-INT Collector’s
  QueueTop application consumes
  INT data and display realtime
  monitoring of the network’s
  queues

• Topology on the right created to
  enable experimentation
   • All links and devices are 100G
   • Novi03 switch port 04 has a
     bottleneck: Node 03 and Node 04
     are sending data to their peers.
   • Let’s see what happens next...

                                        23
Example of telemetry flow entries
24 24Example: Queue 0’s Jitter
25 25Example: Queue 0’s Occupancy
26 26One Source - One Destination - TCP - ~60Gbps
• Node 04 sending data using TCP
to Node 02 at ~50Gbps
• No other traffic
• Top:
• All Queues are using 114-
115 cells (or 9K bytes)
• Bottom:
• Hop Delay around 1
microsend (except for
Novi03 that ADDs INT
header)
27 27QueueTop – Queue Occupancy Monitor
• Monitors all switches’ interfaces’
queues in real time
28 28QueueTop + InfluxDB + Grafana
29 29QueueTop + InfluxDB + Grafana
30 30QueueTop + InfluxDB + Grafana
TCP UDP TCP UDP
31 31Ongoing Deployment
• At each pop, NoviFlow/Tofino switches are being deployed to replace existing devices
• Each INT pop has a Telemetry Collector gathering Gbps of telemetry and uploading Kbps of
network state of the SDN Looking Glass
• A new Control Plane was created to replace the legacy environment using OpenFlow 1.3,
gRPC, and P4.
32 32Conclusions
• Monitoring every and any packet is possible with in-band network telemetry!
• INT has increased the network visibility beyond our expectations
• Combining INT and legacy monitoring tools will enable AmLight to track any
performance issue and user complain
• Combining INT with learning tools will enable AmLight to create reliable trends
and move towards a closed-loop orchestration SDN network.
• What happens next?
33Future
• Maximize the benefits of the current INT substrate:
• NSF CC* Q-Factor: A Framework to Enable Ultra High-Speed Data Transfer Optimization based on Real-Time Network State Information provided
by Programmable Data Planes – Award 2018754
• FIU and ESnet
• PI(s): Jeronimo Bezerra, Julio Ibarra, and Richard Cziva
• Start Date: Oct 15th, 2020 (2 years)
• Goal: Extending the management plane to high performance DTNs for better visibility
• NSF IRNC AmLight-ExP: Americas-Africa Lightpaths Express and Protect – Award 2029283
• FIU, USC, and Vanderbilt
• PI(s): Julio Ibarra, Heidi L. Morgan, Chip Cox, and Luis Lopez
• Start Date: Dec 15th, 2020 (5 years)
• INT Goal: Developing learning systems to consume INT and policies to create a closed-loop orchestration
• NSF IRNC AtlanticWave-SDX: A Distributed Intercontinental Experimental Software Defined Exchange– Award 2029278
• FIU, USC, and RENCI
• PI(s): Julio Ibarra, Heidi L. Morgan, Yufeng Xin, and Jeronimo Bezerra
• Start Date: Dec 15th, 2020 (5 years)
• INT Goal: Developing learning and telemetry systems to export different formats of intra-domain telemetry to support inter-domain provisioning and visibility
34Q-Factor
Objective: Improve data transfers over long-haul high-bandwidth programmable networks
How: Creating an end-to-end framework where endpoints would have network state information to dynamically tune
data transfer parameters in real time
Bandwidth and resources optimization
Transformative:
Q-Factor will enable endpoints to adapt their data transfers to the network conditions in real time, avoiding packet drops, extra
jitter/delays, and excessive memory consumption.
Summary of proposed activities:
Expanding the Management Plane to endpoints
Developing a Telemetry Agent to consume network state
information and tune endpoints
Evaluating tuning at scale over multiple scenarios by
leveraging AmLight and Esnet networks and testbeds
35AmLight-ExP
INT-related objective: Closed-loop
network orchestration by
leveraging telemetry reports from
the packet and optical layers,
combined with Machine Learning
algorithms
Roadmap: Self-Optimizing the
network:
• Year 2: < 5 seconds
• Year 3: < 2 seconds
• Year 4: < 1 second
• Year 5: < 500 ms
36The Team
• FIU team: NoviFlow:
• Arturo Quintana – Sr. Software Developer Arun Paneri - Director of Engineering
Bryan Kerl - Director, Strategic Accounts
• Julio Ibarra – PI
Darrell Irons – Director, Customer
• Italo Valcy – Sr. Network Engineer
Support and Operation
• Jeronimo Bezerra – Chief Network Architect
• David Ramirez – REU Student
Positions Open! Please share them!
3x Sr. Software Developer (@FIU)
1x Network Engineer (@FIU)
1x Postgrad (@Esnet)
More info at https://careers.amlight.net
37Thank you! Questions?
In-band Network Telemetry @ AmLight:
Lessons Learned after 2 years
Jeronimo Bezerra
38References
1. INT Specification: https://p4.org/assets/INT-current-spec.pdf
2. AmLight: http://www.amlight.net
3. Bezerra, J., Arcanjo, V., Ibarra, J., Kantor, J., Lambert, R., Kollross, M., Astudillo, A.,
Sobhani,S., Jaque, S., Petravick, D., Morgan, H., Lopez, L., "International Networking
in support of Extremely Large Astronomical Data-centric Operations". Presented at
Astronomical Data Analysis Software and Systems (ADASS XXVII) conference,
Santiago, Chile, October 22-26, 2017. http://www.adass.org/
4. NoviFlow : http://www.noviflow.com
5. XDP: https://www.iovisor.org/technology/xdp
6. N. V. Tu, J. Hyun, G. Y. Kim, J. Yoo and J. W. Hong, "INTCollector: A High-
performance Collector for In-band Network Telemetry," 2018 14th International
Conference on Network and Service Management (CNSM), Rome, 2018, pp. 10-18.
39You can also read