Leveraging the OHDSI vocabulary to characterize the COVID-19 epidemic using Twitter data and NLP - 7/21/2020 Juan M. Banda www.panacealab.org ...
←
→
Page content transcription
If your browser does not render page correctly, please read the page content below

Leveraging the OHDSI vocabulary to
characterize the COVID-19 epidemic using
           Twitter data and NLP
                   7/21/2020

                 Juan M. Banda
               www.panacealab.org
                jbanda@gsu.edu
                  @drjmbanda
Preface: Twitter is gaining attention for
health-related research since 2009
                                    Number of publications per year
          900

          800

          700

          600

          500

          400

          300

          200

          100

            0
                2005 2006 2007 2008 2009 2010 2011 2012 2013 2014 2015 2016 2017 2018 2019 2020

                    Results of PubMed Query for Twitter and Health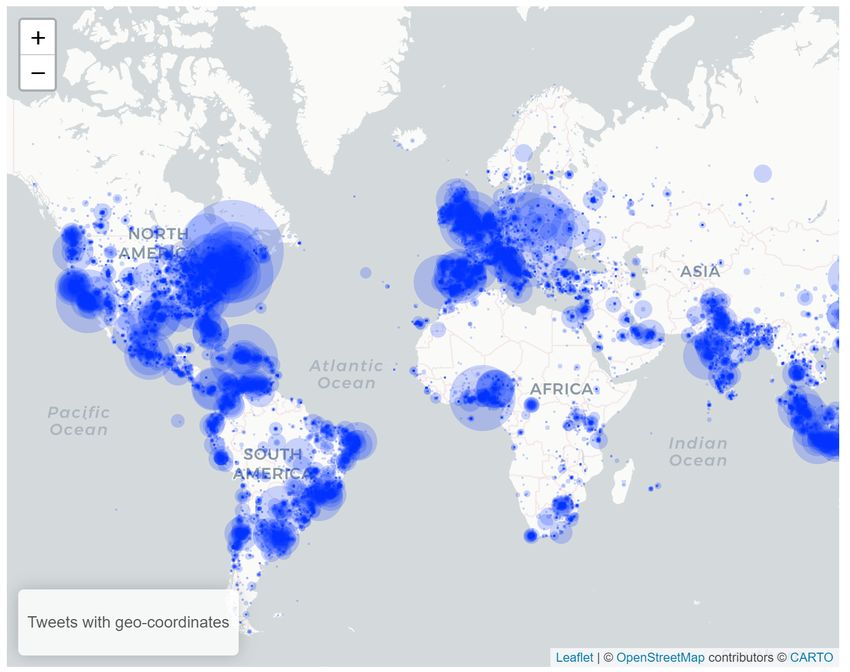
My path to working on COVID-19 research
   • Ph.D in CS – Data Mining (Image data)

   • Postdoc and Research Scientist at Stanford University – Shah Lab on
     Biomedical Informatics (Medical text data – structured and unstructured)

   • OHDSI collaborator on probabilistic phenotyping using weak supervision and
     NLP Workgroup member standardizing resources to OHDSI vocabulary

   • Assistant Professor at Georgia State University – PI of Panacea lab
      • Working with epidemiologists on identifying mobility patterns during natural disasters
        using social media data
      • Extracting drug use from social media data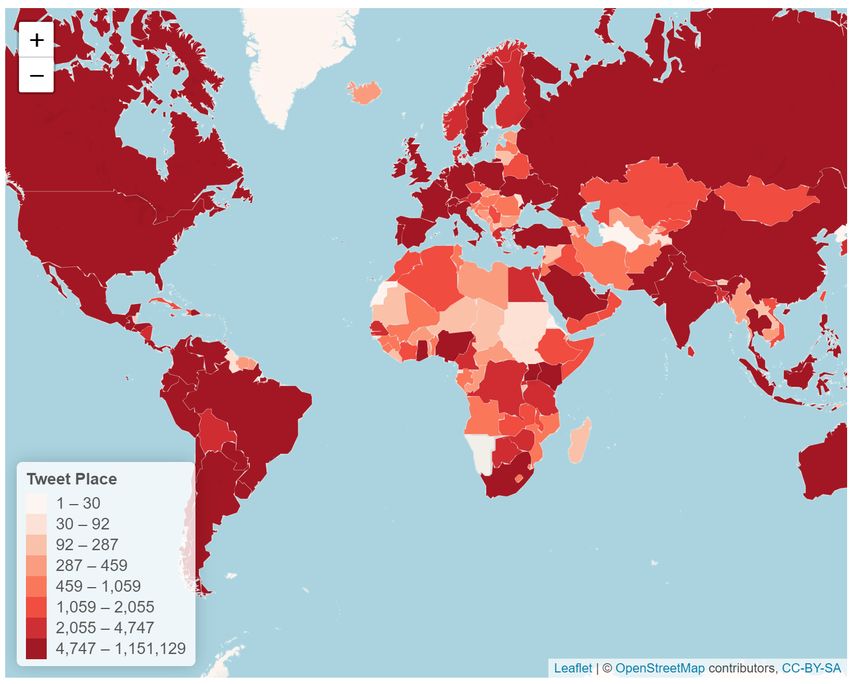
https://www.statista.com/statistics/242606/number-of-active-twitter-users-in-selected-countries/

                                                                                         Distribution of global users over
Benefits of using Twitter:                                                                          age groups

 1) Good population representation

 2) Everybody can post and have an account

 3) Anonymity = unfiltered opinions

 4) Data is freely available*
                                                                                 Number of users per country (millions)
 5) Tons of data generated each day (hundreds of millions of
    tweets get posted every day)

 6) Easy filtering (hashtag usage, people mentions)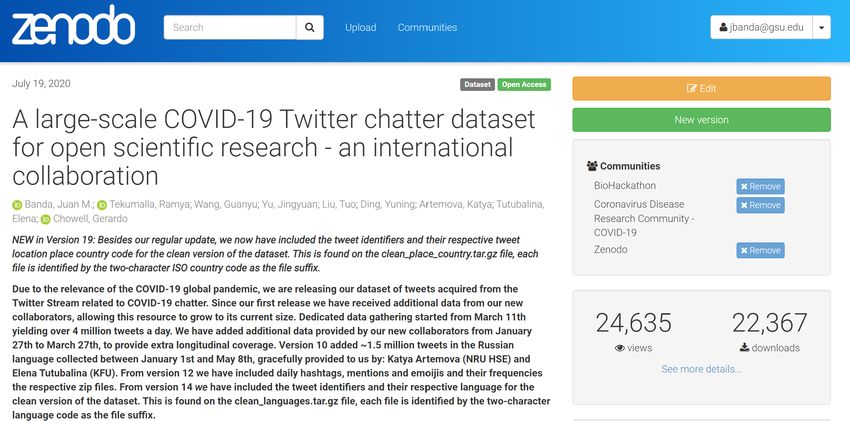
Traditional disadvantages of using Twitter:
• Messy data (plenty of misspellings, shorthand, emojis, etc.)
    • There are at least 25 different ways people misspell hydroxychloroquine

• Attribution is an issue – are people just mentioning something or did it happen to them?

• Freely available data is only a 1% sample of whole set

• Collection is hard and needs to be ongoing for days/weeks before getting considerable
  mass

• Very unique challenges
    • Short form text (up to 280 chars in Twitter)
    • More colloquial, ambiguous, and expressive in different ways (   )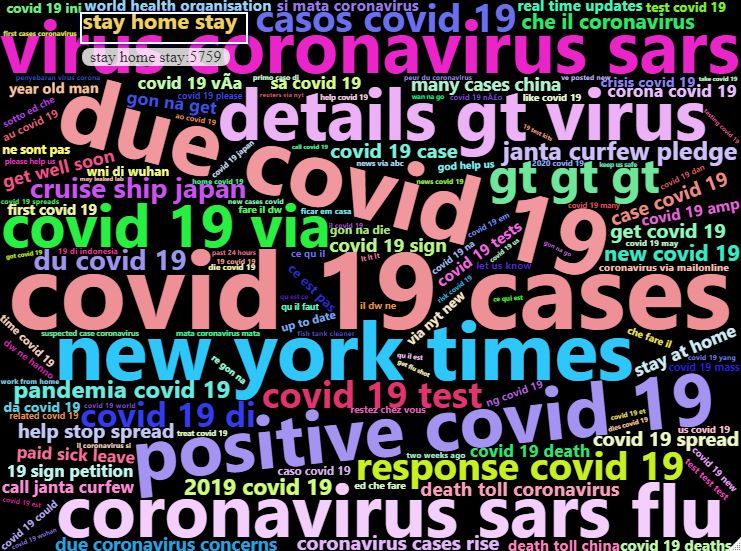
Collecting the data
• Thanks to our work with Dr. Chowell (GSU – Public Health) we started
  collecting COVID-19 data early!

• We also received contributed data for January and February from
  (new) collaborators – after we first shared our dataset publicly

……… wait, the data was released before any publications/work has
been completed on it???
Short answer……Yes!                              But it needs to be done right!
                                                and for the benefit of everybody

                     ….. within all legal and ethical responsibilities of the data being shared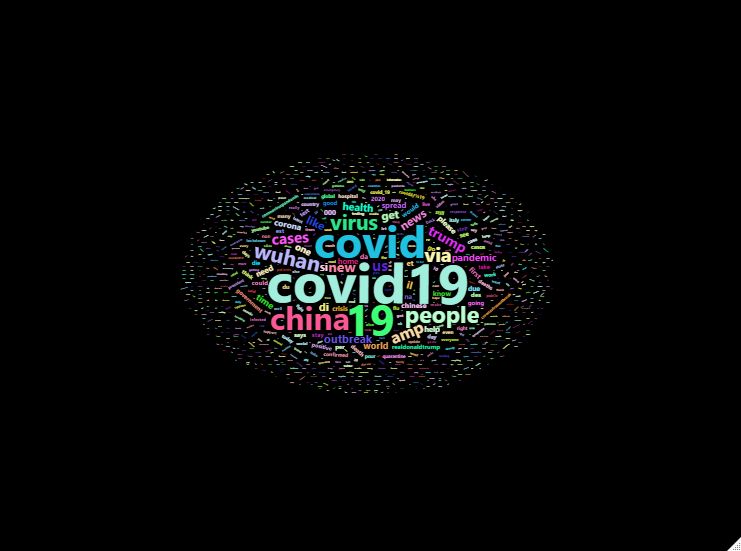
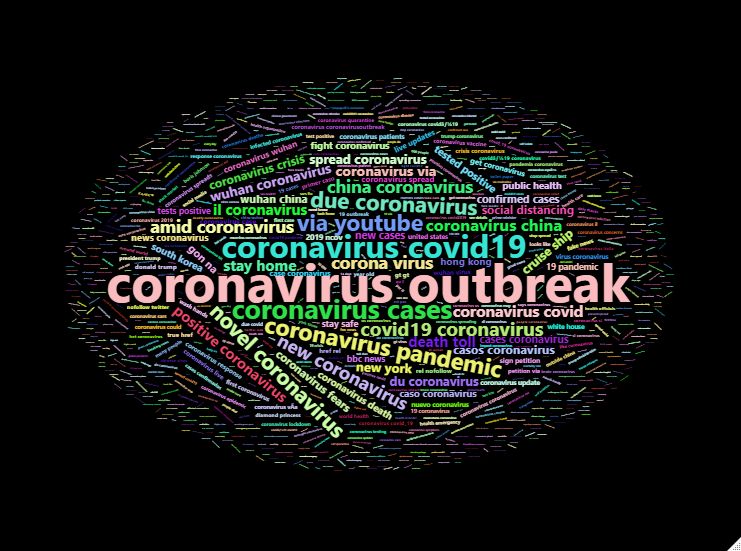
The dataset:
• 513+ Million Tweets

• ONLY COVID related
chatter is included

                                            Dataset: https://doi.org/10.5281/zenodo.3723939
Longitudinal – January   27th
                                            Pre-print: https://arxiv.org/abs/2004.03688
to today… and growing           Recent additions: https://github.com/thepanacealab/covid19_twitter
Languages
available:

69 in total
Tweets per
day (all):

             http://www.panacealab.org/covid19/
Tweets per
day (clean):
http://www.panacealab.org/covid19/Geolocations? … on some less than 1%
Tweets with place
location enabled?
… some

less than 2%
For instant NLP uses
• We include:
   • Top 1000 frequent terms

   • Top 1000 frequent bigrams

   • Top 1000 frequent trigrams
Is the dataset being used?
22K downloads since we started

Over 15 pre-prints cite us….. 3 datasets ‘aggregated’ us without attribution or even asking

Has been used on multiple hackathons: MIT-COVID19 challenge, Lumiata COVID hackathon,
COVID-19 biohacktahon

We have been invited to participate on:
      - Bay Area Summer Institutes in Computational Social Science
      - Harvard The Coronavirus Visualization Team – Xenophobia Project

Started new collaborations with over six academic institutions
So what can we do with this type of data?
https://images.app.goo.gl/YAVtt66nNxeZxQzKAPerception towards the ethnic minorities and elderly populations • Being a fellow at Stanford SAGE Research Center one of our first questions was to identify the perception of the Twitter users to ethnic minorities and elderly populations • Turns out we can! • Turns out is not as expected!
Perception towards the elderly and ethnic
minorities (1)
• What we did:
  • Curated terms to identify tweets for elderly populations and for ethnic
    minorities
  • Identify Tweets with mentions. Build machine learning models to
    disambiguate ambiguous terms after manual curation.
  • Sentiment Analysis using VADER (Valence Aware Dictionary and sEntiment
    Reasoner)
  • Manual Evaluation of identified Tweets for correctness of polarity
  • Comparison of Baseline tweets (2019) with epidemic related tweets (March)
Perception towards the elderly and ethnic minorities (2) • For ethnic minorities:
Perception towards the elderly and ethnic
minorities (3)
• The calculated proportion of negative versus positive tweets has
  increased to 28% more negative sentiment on racial minorities. This
  leads to an almost 10% increase in negative sentiments in the time
  periods we analyze.
Hashtag Evolution over time
Emoji distribution by gender
Topic modeling?
• Quite tricky with Twitter
  data!

• Too many topics, not
  enough clarity on our
  initial analyses with LDA
  and Dynamic LDA
Wait….. Isn’t this the OHDSI call?

• Yes! And the previous and the following work was 100 times easier by
  leveraging the OHDSI vocabulary!

   …. How?
OHDSI Dictionary for NLP
• A terms dictionary was created from the OHDSI vocabulary by selecting the
  uniquely distinct terms (by concept_name) with the following adjustments:
   • a) Since Twitter has a limit of 280 characters per tweet, we removed any term string
     longer than 100 characters
   • b) all the terms less than 3 characters are also removed due to their ambiguous
     nature
   • c) stop words were removed, and
   • d) all the terms were lower cased.

• The final dictionary consists of 2,938,998 unique terms.
Annotation process
• The tweet data pre-processing and automatic annotation was
performed by using the Social Media Mining Toolkit (SMMT)*, and
Spacy
• NOTE: When collapsing the vocabulary by unique terms, we lose the
domain, concept class, and vocabulary identifiers of repeated strings,
however, this is recovered after annotation by joining the annotations
back with the original vocabulary.
* https://genominfo.org/journal/view.php?number=605concept_name frequency concept_class_id vocabulary_id
What we got: concept_namefrequency
Coronavirus
People
25,766,403
5,304,705
Coronavirus
People
25,766,403 LOINC Component
5,304,705 Social Context
LOINC
SNOMED
China 2,407,265 2nd level OSM
China 2,407,265
Virus 2,323,879 Virus 2,323,879 LOINC Component LOINC
• We found a total of Time 2,078,697 Time 2,078,697 LOINC Component LOINC
1,147,782,412* terms on Home
Is a
1,532,694
1,521,450
Home 1,532,694 Visit
CMS Place of
Service
115M tweets death 1,467,443
Is a
death
1,521,450 Relationship
1,467,443 Table
Relationship
CDM
Due to 1,379,014 Due to 1,379,014 Attribute SNOMED
Spread 1,335,751 Spread 1,335,751 Attribute SNOMED
Today 1,318,637 Today 1,318,637 Brand Name RxNorm
Is this useful this way? Crisis 1,301,976 Crisis 1,301,976 Clinical Finding SNOMED
State 1,299,045 State 1,299,045 Concept Class Concept Class
Outbreak 1,225,292
Outbreak 1,225,292 Context-dependent SNOMED
Country 1,192,392
Support 1,013,937 Country 1,192,392 LOINC Component LOINC
India 897,104 Support 1,013,937 LOINC Component LOINC
Vaccine 846,643 India 897,104 Answer LOINCWhat the vocabulary gets us:
Cool story… show me some RWE
Can we characterize drug mentions?

              Figure 1. Timeline of Tweets with potential drug treatment mentions.
Charybdis-like characterization over countries (work with Dani Charybdis Prieto-Alhambra – University of Oxford) style?
Charybdis-like characterization over countries (work with Dani

Charybdis   Prieto-Alhambra – University of Oxford)

style?
Charybdis-like characterization over countries (work with Dani Charybdis Prieto-Alhambra – University of Oxford) style? … over time?
Charybdis-like characterization over countries (work with Dani
                 Prieto-Alhambra – University of Oxford)

Charybdis
style?

… over
time?
Very different
pattern for
retweets
What about symptom/condition characterization?
• Self-reported symptoms on Twitter vs EHR lists *
• Can we find related symptoms both found on EHR’s (Callahan, A., Steinberg,
E., Fries, J.A. et al. Estimating the efficacy of symptom-based screening for
COVID-19. npj Digit. Med. 3, 95 (2020). https://doi.org/10.1038/s41746-020-
0300-0) but on Twitter?
* https://github.com/thepanacealab/covid19_biohackathon/tree/master/user_symptomsIs this real RWE?..... Not quite…. Yet!
How do we get there?https://arxiv.org/abs/2007.10276 Data is very messy! • Misspellings are the norm –ignore them: lose 15% of data!
Attribution is critical
• What about attributions?
   • Others have done work on this:
       • Klein, Ari, Arjun Magge, Karen O’Connor, Haitao Cai, Davy Weissenbacher, and Graciela Gonzalez-Hernandez.
         2020. “A Chronological and Geographical Analysis of Personal Reports of COVID-19 on Twitter.” Health
         Informatics. medRxiv. https://doi.org/10.1101/2020.04.19.20069948
       • Sarker, Abeed, Sahithi Lakamana, Whitney Hogg, Angel Xie, Mohammed Ali Al-Garadi, and Yuan-Chi Yang. 2020.
         “Self-Reported COVID-19 Symptoms on Twitter: An Analysis and a Research Resource.” Health Informatics.
         medRxiv. https://doi.org/10.1101/2020.04.16.20067421
   • However, needs tons and tons of manual review

• Can this be done easier and maybe semi-supervised (like
  APHRODITE)?
   • Yes! We have done this for drugs!
• Mined 9 Billion tweets from public domain • Using heuristic we found ~6M tweets with drugs • Trained models on subsets of them • Used models to predict already existing labeled sets (~93% accuracy on them) • Subset of 3 million tweets gave us these results! No manual review on our side
So we have many pieces now:
On going super exciting work
Tracking Self-Reported symptoms after
    infection recovery
• Since we can find symptoms and drugs, we can also find people that
  had COVID and their symptoms after infection!        JAMA doi:10.1001/jama.2020.12603

   • On-going work with Dani Prieto-Alhambra and others
      • Incorporates methods shown before + manual review by clinicians

                                Some very preliminary findings:
                              fatigue                         789
                              shortness of breath=dyspnea     701

 UNDER REVIEW!!!
                              chest pain                      687
                              palpitations                    674
                              anxiety                         212
                              post-exertional malaise          36
                              Tired = fatigue                  36
                              muscle pain = myalgia            35
Identification of drug-safety signals for COVID19 drug treatments • We have found the drug mentions • We have found the adverse side effects • In process: generating PRR and OR from them • Next up: Proper attribution of signals
The future
• We have users
• We have user timelines
• We have self-reported conditions
• We have self-reported drug usage
• We have self-reported lab tests (and with results sometimes!)
• We have (some) methods to attribute these things
                      We have ‘patient’ timelines that can go into CDM
                      We have hundreds/thousands of them
The obstacles • Getting funding for Twitter research (in the Health sciences space) is super hard! • There is considerable noise on this data • Cleaning/extracting stuff from clinical notes is a cake walk in comparison • Attribution is very hard
The gory details:

• Technical stuff:
   • “Building tools and frameworks for large-scale social media mining: Creating
     data infrastructure for COVID-19 research” dair.ai meetup 7/22:
     https://www.meetup.com/dair-ai/events/271690722/
Acknowledgments
• All this work would not be possible without the help of my Ph.D student: Ramya Tekumalla
• Collaborations with: Dani Prieto-Alhambra, Gurdas Viguruji Singh, Osaid H. Alser
• Additional GSU collaborators: Dr. Gerardo Chowell
• Extra data provided by: Guanyu Wang2, Jingyuan Yu3, Tuo Liu4, Yuning Ding5.
• Dr. VJ Periyakoil at Stanford University
• Funding by: National Institute of Aging through Stanford University’s Stanford Aging & Ethnogeriatrics
Transdisciplinary Collaborative Center (SAGE) center (award 3P30AG059307-02S1)
2. Missouri school of journalism, University of Missouri, Columbia, MO
3. Department of social psychology, Universitat Autònoma de Barcelona, Barcelona, Spain
4. Department of psychology, Carl von Ossietzky Universität Oldenburg, Oldenburg, Germany
5. Language technology lab, Universität Duisburg-Essen, Duisburg, GermanyWant to get involved? • Do you have interesting questions? • Do you have funding? J • Feel free to get in touch: jbanda@gsu.edu or @drjmbanda • Access the data and related items: http://www.panacealab.org/covid19/
You can also read