Actuarial Weather Extremes: August 2021 - Historic High Temperature, Impactful Storms and Precipitation - SOA
←
→
Page content transcription
If your browser does not render page correctly, please read the page content below
Actuarial Weather Extremes: August 2021
 Historic High Temperature, Impactful Storms and
 Precipitation

September 2021
Actuarial Weather Extremes: August 2021
Historic High Temperature, Impactful Storms and Precipitation

AUTHORS        Rob Montgomery, ASA, MAAA                                     SPONSOR         Catastrophe and Climate Strategic
               Society of Actuaries Research Institute                                       Research Program Steering Committee

               Matthew Self, ASA
               Ascension Data Science Institute

               Patrick Wiese, ASA
               Society of Actuaries Research Institute

Caveat and Disclaimer
The opinions expressed and conclusions reached by the authors are their own and do not represent any official position or opinion of the Society of
Actuaries Research Institute, the Society of Actuaries or its members. The Society of Actuaries Research Institute makes no representation or warranty to
the accuracy of the information.

Copyright © 2021 by the Society of Actuaries Research Institute. All rights reserved.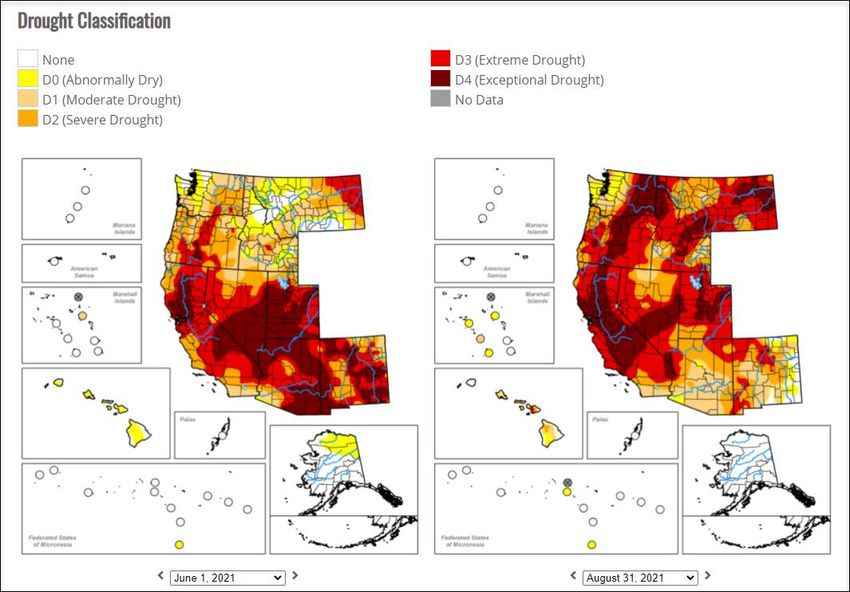
3

CONTENTS
Overview .................................................................................................................................................................. 4
Hottest Summer in U.S. and Canada Looking Back to 1960 ........................................................................................ 5
Record Precipitation Levels for August ...................................................................................................................... 7
August Storm Impacts ............................................................................................................................................... 8
Hurricane Ida (Date of Landfall: August 29, 2021) ................................................................................................... 11
Data ........................................................................................................................................................................ 12
About The Society of Actuaries Research Institute .................................................................................................. 14

                                                                                                                   Copyright © 2021 Society of Actuaries Research Institute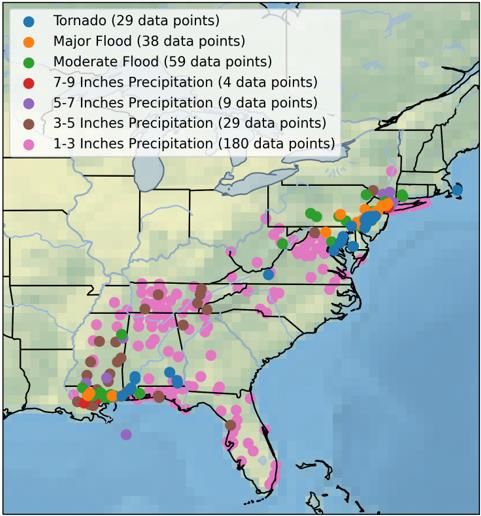
4

Actuarial Weather Extremes: August 2021
Historic High Temperature, Impactful Storms and Precipitation

Overview
This report examines weather conditions for daily maximum and minimum temperature (TMAX and TMIN), inland
storm activity from wind, hail and tornadoes, record precipitation, tropical cyclone activity and the resultant
flooding.

Hottest Summer in U.S. and Canada Looking Back to 1960: Using Global Historical Climatology Network (GHCN) data
back to 1960, the three-month period June 1 to August 31, 2021 was the hottest “full meteorological summer” in
the period of available data 1960-2021 for both the U.S. and for Canada as a whole.

Record Precipitation Levels for August: As seen in Figure 3, many GHCN weather stations had August monthly
precipitation records in 2021 in the context of Augusts in 1960-2021. A large number of stations were in or near
Tennessee. Figure 4 further illustrates the streamflow impacts during August 2021 showing that the areas of heavy
monthly precipitation led to much above normal streamflow.
August Storm Impacts: As seen in Tables 2, 3, 4 and Figures 5 and 6, August 2021 was an active month for Wind,
Hail, Tornadoes and Flooding. Many of the storms were coincidental with Tropical Storm Fred moving through the
Southeastern U.S. and into Pennsylvania in mid-August.

Hurricane Ida: Hurricane Ida brought severe precipitation, tornadoes, and moderate and major flooding from
Louisiana to New York over the August 28 to September 5, 2021 period. Figure 7 shows the geographic distribution
of observed events. As reported by AP NEWS, one risk modeling company estimates damages could exceed $50
billion, with an estimated $18 billion insured. 1 As of September 9, the official death toll attributed to Ida was 82. 2

Other Extreme Catastrophe: While not a “weather” event, it is noteworthy that outside of the US, there was a tragic
7.2 magnitude earthquake that killed 2,200 people in Haiti on August 14, 2021. The U.S. Agency for International
Development sent $32 million in aid to support humanitarian efforts. 3 Relief and recovery efforts were slowed by
the arrival of Tropical Depression Grace two days later.

.

1AP NEWS. September 1, 2021. After Ida, small recovery signs amid daunting destruction (apnews.com)
2CBS News. September 9, 2021. Hurricane Ida death toll jumps to 82 - CBS News
3 Reliefweb. August 26, 2021. USAID provides $32 million to respond to Haiti earthquake - Haiti | ReliefWeb

                                                                                                       Copyright © 2021 Society of Actuaries Research Institute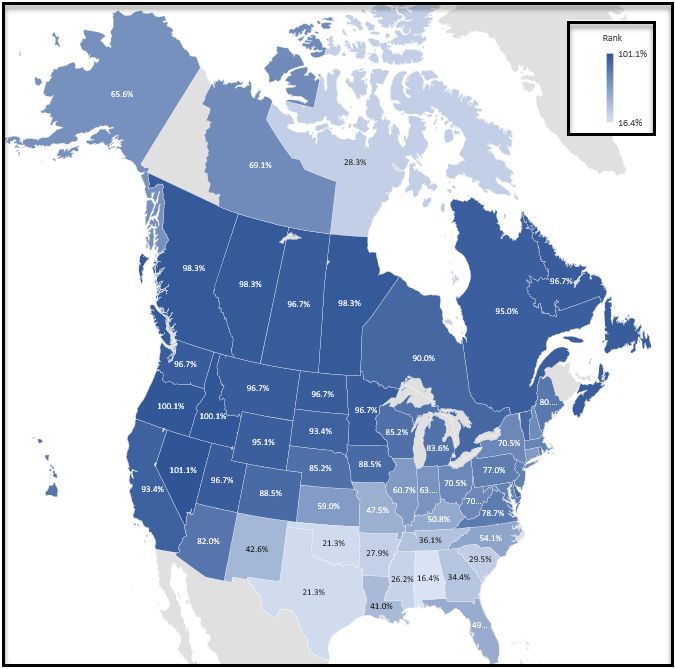
5

Hottest Summer in U.S. and Canada Looking Back to 1960
As seen in Figure 1, and in Table 1, the full meteorological summer (June 1 to August 31) was the warmest in 2021
for any year back to 1960 for several U.S. states (Figure 1) and for each of the U.S. and Canada as a whole (Table 1).
This is derived from the average Daily Maximum Temperature (TMAX) for the states and provinces and the average
of the June through August TMAX and Daily Minimum Temperature (TMIN) ranked during Augusts of the 62-year
period 1960-2021. As reported by The Weather Channel, Summer 2021 was the hottest in 126 years of record
keeping in the continental U.S. 4 As shown in Figure 2, the areas of state record temperatures (Oregon, Idaho,
Nevada) are consistent with the progression of drought conditions.

Figure 1
GHCN PERCENTILE RANKINGS OF 2021 DURING 1960-2021 FOR U.S. STATES AND CANADIAN PROVINCES DAILY
MAXIMUM TEMPERATURE (TMAX) OVER THE METEOROLOGICAL SUMMER PERIOD (JUNE, JULY, AUGUST)

Source: GHCN station data (Accessed September 7, 2021). https://www1.ncdc.noaa.gov/pub/data/ghcn/daily/

4   The Weather Channel. September 8, 2021. https://weather.com/news/climate/news/2021-09-09-summer-hottest-on-record-united-states-noaa

                                                                                                  Copyright © 2021 Society of Actuaries Research Institute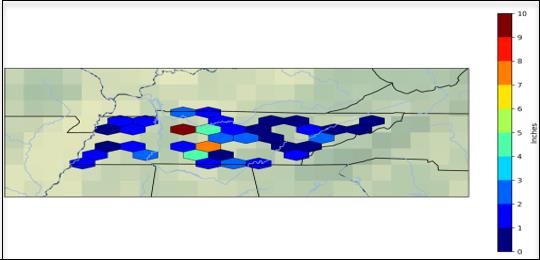
6

Table 1
AVERAGE OF DAILY MAXIMUM TEMPERATURE (TMAX) AND DAILY MINUMUM TEMPERATURE (TMIN) FOR JUNE 1-
AUGUST 31 RANKING DURING YEARS 1960 TO 2021 FOR U.S. AND FOR CANADA
           Year         Average (TMAX, TMIN) Canada        Average (TMAX, TMIN) US          Rank                Rank U.S.
                                                                                           Canada
            2021                      65.12                           73.92                   1                     1
            2011                      61.53                           73.87                  35                     2
            2012                      63.25                           73.86                   9                     3
            2016                      64.24                           73.82                   4                     4
            2010                      61.44                           73.68                  37                     5
            1988                      62.38                           73.66                  20                     6
            2020                      #N/A                            73.60                 #N/A                    7
            2018                      64.27                           73.50                   3                     8
            2006                      63.48                           73.43                   7                     9
            2002                      62.60                           73.30                  14                     10
Source: GHCN station data (Accessed September 7, 2021). https://www1.ncdc.noaa.gov/pub/data/ghcn/daily/

Figure 2
COMPARISON OF DROUGHT CONDITIONS IN THE WESTERN U.S. DURING JUNE 1 TO AUGUST 31, 2021

Source: https://droughtmonitor.unl.edu/Maps/CompareTwoWeeks.aspx The U.S. Drought Monitor is jointly produced by the
National Drought Mitigation Center at the University of Nebraska Lincoln, the United States Department of Agriculture, and the
National Oceanic and Atmospheric Administration. Map courtesy of NDMC.

                                                                                       Copyright © 2021 Society of Actuaries Research Institute
7
Record Precipitation Levels for August
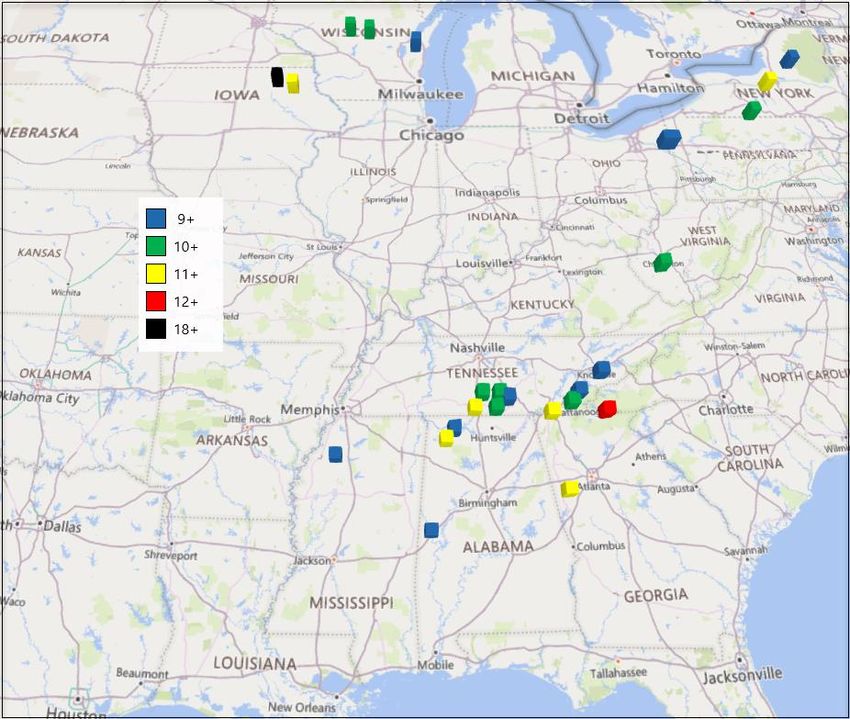
As seen in Figure 3, many stations had August monthly precipitation records in 2021 vs the period 1960-2021. The
large number of stations were in or near Tennessee. Figure 4 further illustrates the streamflow impacts during
August 2021 showing that the areas of heavy monthly precipitation led to much above normal streamflow.
Figure 3
GHCN STATIONS WITH AUGUST MONTHLY PRECIPITATION RECORDS DURING AUGUST 2021 VERSUS AUGUSTS IN
THE PERIOD 1960-2021 WHICH EXCEEDED NINE INCHES OF PRECIPITATION FOR THE MONTH
Source: GHCN station data (Accessed September 7, 2021). https://www1.ncdc.noaa.gov/pub/data/ghcn/daily/
Copyright © 2021 Society of Actuaries Research Institute8
Figure 4
UNITED STATES GEOLOGICAL SURVEY (USGS) STREAMFLOW IN AUGUST 2021 VS HISTORICAL DATA PERCENTILE
CLASSES USING STREAMGAGES WITH AT LEAST 30 YEARS OF DATA
Source: United States Geological Survey (USGS) USGS WaterWatch -- Streamflow conditions Date Accessed: 9/15/2021
August Storm Impacts
Tropical Storm Fred made landfall on August 16, 2021 in Florida and weakened into a Tropical Depression that
moved north over Georgia, South Carolina, North Carolina, and Pennsylvania. As the storm moved over these
states, there were several reported tornadoes and flood events. Tornado reports peaked on August 17, 2021, with
the National Oceanic and Atmospheric Administration (NOAA) Storm Prediction Center (SPC) recording 15 reports in
South Carolina. Flood events continued in Georgia through August 22, 2021. Table 2 shows that Georgia had the
most activity during the observation period, while Table 3 shows that August 17, 2021 was the most active day due
to the elevated number of Tornado reports in South Carolina. From the high rainfall and flooding in North Carolina
and South Carolina, there were 6 fatalities 5 and estimated $300m in damage 6 in one community.
5 WYFF News 4. August 27, 2021 Haywood County, officials recover final victim of tropical storm (wyff4.com)
6 Asheville Citizen Times. August 23, 2021. Haywood County switches to search and recovery, 1 missing in flooding (citizen-times.com)
Copyright © 2021 Society of Actuaries Research Institute9
Table 2
FLOOD AND TORNADO COUNT BY STATE AND DATE
Date GA NC SC PA Total
20210816 11 0 0 0 11
20210817 5 3 15 0 23
20210818 2 4 0 7 13
20210819 2 1 0 0 3
20210820 2 1 0 0 3
20210821 2 0 0 0 2
20210822 1 0 0 0 1
Total 25 9 15 7 56
Source: NOAA SPC (Accessed September 1, 2021). https://www.spc.noaa.gov/climo/reports/210816_rpts.html
Table 3
STORM EVENT COUNT BY DATE AND EVENT TYPE
Date Tornado Flood Moderate Total
Flood
20210816 8 3 0 11
20210817 20 3 0 23
20210818 7 5 1 13
20210819 0 2 1 3
20210820 0 3 0 3
20210821 0 2 0 2
20210822 0 1 0 1
Total 35 19 2 56
Source: NOAA SPC (Accessed September 1, 2021). https://www.spc.noaa.gov/climo/reports/210816_rpts.html
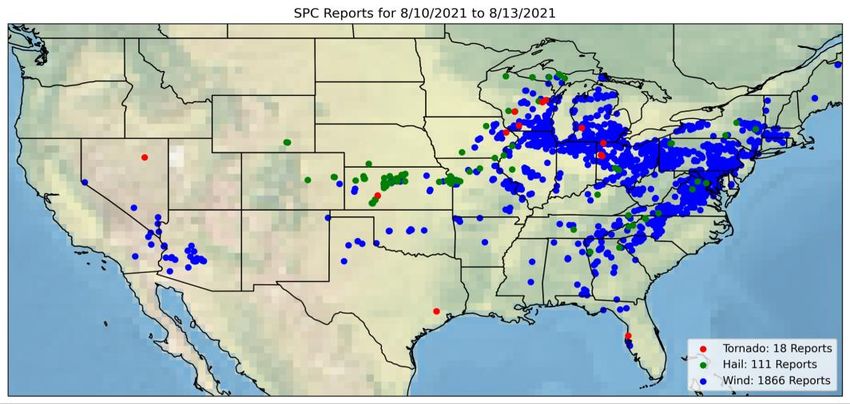
From August 10, 2021 to August 13, 2021, there were a significant number of Hail, Tornado, and, in particular, Wind
reports. In Midwestern and Eastern states, which each had over 50 storm events, there were a total of 1,705 NOAA
SPC reports over these four days. Table 4 shows that more than one-third of the reports occurred on August 11,
2021, with the highest number of reports on that date being in Michigan and Ohio. Figure 5 shows the geographic
distribution of these reports during the four-day period for the continental U.S.
Table 4
WIND, HAIL AND TORNADO REPORTS BY STATE AND DATE
State 20210810 20210811 20210812 20210813 Total
IL 52 76 45 - 173
IN 17 81 6 - 104
KS 39 2 45 - 86
MD 19 34 - 69 122
MI 57 116 1 1 175
MO 3 2 77 - 82
NC 9 15 24 4 52
NY 18 12 17 47 94
OH 14 124 38 37 213
PA 51 57 100 57 265
VA 55 72 10 117 254
WI 52 33 - - 85
Total 386 624 363 332 1,705
Source: NOAA SPC (Accessed September 1, 2021). https://www.spc.noaa.gov/climo/reports/210810_rpts.html
Copyright © 2021 Society of Actuaries Research Institute10
Figure 5
NOAA SPC TORNADO, WIND AND HAIL REPORTS FROM AUGUST 10, 2021 TO AUGUST 13, 2021
Source: NOAA SPC (Accessed September 1, 2021). https://www.spc.noaa.gov/climo/reports/210810_rpts.html
From August 18, 2021 to August 22, 2021, there was extensive precipitation through Tennessee, with one
Automated Surface Observing System (ASOS) station recording 8.17 inches on August 21, 2021. Figure 6 shows the
concentration of precipitation in Western Central Tennessee. The death toll from subsequent flooding has been set
at 20 and a federal disaster was declared for Humphreys County, TN. 7 2021 has seen the highest number of deaths
from flooding in Tennessee since 1996. 8
Figure 6
ASOS PRECIPITATION TOTALS IN TENNESSEE FROM AUGUST 18, 2021 TO AUGUST 22, 2021
Source: IA State Automated Surface Observing System (ASOS): (Accessed September 1, 2021).
https://mesonet.agron.iastate.edu/request/download.phtml
7 WKRN.com. August 24, 2021. 20 people dead, 0 considered missing after Middle Tennessee flooding (wkrn.com)
8 NOAA National Weather Service. Tennessee Flash Flood Stats (weather.gov)
Copyright © 2021 Society of Actuaries Research Institute11
Hurricane Ida (Date of Landfall: August 29, 2021)9
Hurricane Ida brought severe precipitation, tornadoes, and moderate and major flooding from Louisiana to New
York over the 8/28/2021 to 9/5/2021 period. Figure 7 shows the geographic distribution of observed events. As
reported by AP NEWS, one risk modeling company estimates damages could exceed $50 billion, with an estimated
$18 billion insured. 10 As of September 9, 2021, the official death toll attributed to Ida was 82. 11
Figure 7
DAILY WEATHER OBSERVATIONS FOR HURRICANE IDA FROM AUGUST 28, 2021 TO SEPTEMBER 5, 2021
Sources (Accessed September 1, 2021): IA State Automated Surface Observing System (ASOS)
https://mesonet.agron.iastate.edu/request/download.phtml , United States Geological Survey (USGS) https://waterservices.usgs.gov/rest/IV-
Test-Tool.html ,NOAA SPC https://www.spc.noaa.gov/climo/reports/210810_rpts.html
9 The Weather Channel. August 31, 2021. Photos of Hurricane Ida's Category 4 Landfall (PHOTOS) | The Weather Channel - Articles from The Weather
Channel | weather.com
10 AP NEWS. September 1, 2021. After Ida, small recovery signs amid daunting destruction (apnews.com)
11 CBS News. September 9, 2021. Hurricane Ida death toll jumps to 82 - CBS News
Copyright © 2021 Society of Actuaries Research Institute12
Data
Temperature data and Precipitation data used in this report was obtained from the Global Historical Climatology
Network (“GHCN”) weather database, which provides daily weather observations from over 100,000 weather
stations worldwide, covering over 180 countries. The database is publicly available through the National Oceanic
and Atmospheric Administration (NOAA) via the following FTP site:
Source: https://www1.ncdc.noaa.gov/pub/data/ghcn/daily/
Filename: ghcnd_all.tar.gz
National Weather Service Storm Prediction Center Reports
SPC: https://www.spc.noaa.gov/climo/reports/210801_rpts.html
This page will show all Tornado, Wind, and Hail reports for 8/1/2021
Select the “210802 Reports” button at the top to move to the next day
Automated Surface Observing System (ASOS) temperature and precipitation data
The steps below show how to get the hourly temperature and precipitation at the STL Airport, as an example, from
the Iowa State University Automated Surface Observing System (ASOS):
IA State: https://mesonet.agron.iastate.edu/request/download.phtml
1) Select “Missouri ASOS” as the network and click “Switch to Network”
2) In the list of available stations, select the “[STL] ST. LOUIS” station, and click “Add Selected”
3) In the “Select From Available Data” section, choose the “Air Temperature [F]” and “1 hour Precipitation [inch]”
options.
4) Set the date range to 2020-October-1 and 2020-October-31 (or whatever range is desired)
5) Select “Yes” for “Include Latitude + Longitude”
6) Click “Get Data” at the bottom
These steps would give you the results from the URL below.
https://mesonet.agron.iastate.edu/cgi-
bin/request/asos.py?station=STL&data=tmpf&data=p01i&year1=2020&month1=10&day1=1&year2=2020&month2
=10&day2=31&tz=Etc%2FUTC&format=onlycomma&latlon=yes&elev=no&missing=M&trace=T&direct=no&report_t
ype=1&report_type=2
USGS Gauge Heights
Real-Time Values: https://waterservices.usgs.gov/rest/IV-Test-Tool.html
1. Select “List of Sites” in the Major Filters section and enter the Site Number(s) of interest
Copyright © 2021 Society of Actuaries Research Institute13
2. In the Date Ranges section, select “Return all values within an absolute date range” and enter the Date
Range of interest
3. For “Parameter Codes”, enter 00060 for Discharge, cubic feet per second or 00065 for Gage Height, feet.
4. At the bottom click “Generate the URL” then click “Run the Generated URL”
Copyright © 2021 Society of Actuaries Research Institute14
About The Society of Actuaries Research Institute
Serving as the research arm of the Society of Actuaries (SOA), the SOA Research Institute provides objective, data-
driven research bringing together tried and true practices and future-focused approaches to address societal
challenges and your business needs. The Institute provides trusted knowledge, extensive experience and new
technologies to help effectively identify, predict and manage risks.
Representing the thousands of actuaries who help conduct critical research, the SOA Research Institute provides
clarity and solutions on risks and societal challenges. The Institute connects actuaries, academics, employers, the
insurance industry, regulators, research partners, foundations and research institutions, sponsors and non-
governmental organizations, building an effective network which provides support, knowledge and expertise
regarding the management of risk to benefit the industry and the public.
Managed by experienced actuaries and research experts from a broad range of industries, the SOA Research
Institute creates, funds, develops and distributes research to elevate actuaries as leaders in measuring and
managing risk. These efforts include studies, essay collections, webcasts, research papers, survey reports, and
original research on topics impacting society.
Harnessing its peer-reviewed research, leading-edge technologies, new data tools and innovative practices, the
Institute seeks to understand the underlying causes of risk and the possible outcomes. The Institute develops
objective research spanning a variety of topics with its strategic research programs: aging and retirement; actuarial
innovation and technology; mortality and longevity; diversity, equity and inclusion; health care cost trends; and
catastrophe and climate risk. The Institute has a large volume of topical research available, including an expanding
collection of international and market-specific research, experience studies, models and timely research.
Society of Actuaries Research Institute
475 N. Martingale Road, Suite 600
Schaumburg, Illinois 60173
www.SOA.org
Copyright © 2021 Society of Actuaries Research InstituteYou can also read