Computing geographical access to services: the design of an open-source multimodal client-server solution
←
→
Page content transcription
If your browser does not render page correctly, please read the page content below
Computing geographical access to services: the design of an open-
           source multimodal client-server solution
  Andrew Price*¹, Mitchel Langford†¹, Gary Higgs‡¹, and Jonathan Radcliffe††²
¹Facility of Computing, Engineering and Science, University of South Wales, Pontypridd, CF37 1DL
                            ²Sport Wales, Sophia Gardens, Cardiff CF11 9SW
                                                Summary
     This study describes the design and implementation of a web-based solution for computing
    geographic accessibility, using open-source elements. The computation of accessibility scores
  incorporates the use of multiple modes of transportation and can be adapted to any form of service
provision that can be represented as geographic points. The solution provided aims to extend previous
attempts at measuring multi-modal accessibility by integrating a new approach of generating required
      variables to perform these calculations in a fully open source, open data environment. The
 infrastructure of this solution is described, demonstrating how the transport distances are generated
                                 and applied within the FCA calculation.
KEYWORDS: Multi-modal, Potential Accessibility, Two-Step Floating Catchment Area (2SFCA),
Wales, GIS
1. Introduction
Sporting organisations and national governing bodies have an aim of ensuring the sufficient and
equitable access to both their facilities and opportunities. In order to achieve this objective, such
organisations are required to develop systems and tools that enable the calculation of accessibility and
monitoring of service provision.
This paper describes the planning, development and implementation of a web-based solution that
enables the computation and visualisation of geographic accessibility measures. The purpose of the
solution is to keep it as cost effective as possible using open source and open data, while working in a
web-based environment to allow access from any location with permission to collaborate in planning
and decision making of service locations. The measurement of accessibility specifically used in this
study is a modification of the Enhanced Two-Step Floating catchment area method (E2SFCA) that is
described by Luo and Qi (2009) to calculate localised supply-demand ratios. This modification focuses
on the implementation of multiple modes of transportation into the existing model, to incorporate the
population who access these services via different forms of transport and give a more accurate result on
the current levels of accessibility.
2. Background
Geographic accessibility is defined as the ease in which a population or set number of people from a
location can reach a point of interest or service. Measuring sufficient and equitable geographical access
has been a key topic within geographic literature for years. This discussion on accessibility has been
covered over a great variety of areas that includes subjects such as healthcare, sporting facilities, school
provision, disaster aid and employment opportunities (Billaudeu et al. 2011, Fransen et al. 2015,
Langford et al. 2012, Narboneta and Teknomo 2013, Barbieri and Jorm 2019, Wang 2007, Bao and
Deng 2011).
Previous research on accessibility within sport facilities led to the development of a plug-in within
proprietary ArcGIS software that enabled an E2SFCA analysis of access to sporting facilities (Langford,
et al., 2016). This research extends that research by implementing an open-source solution, as a
standalone C# application that incorporates the use of PostGIS and QGIS applications to process and
____________________________________________
*andrew.price@southwales.ac.uk
†mitchel.langford@southwales.ac.uk
‡gary.Higgs@southwales.ac.uk
††jonathan.radcliffe@sport.wales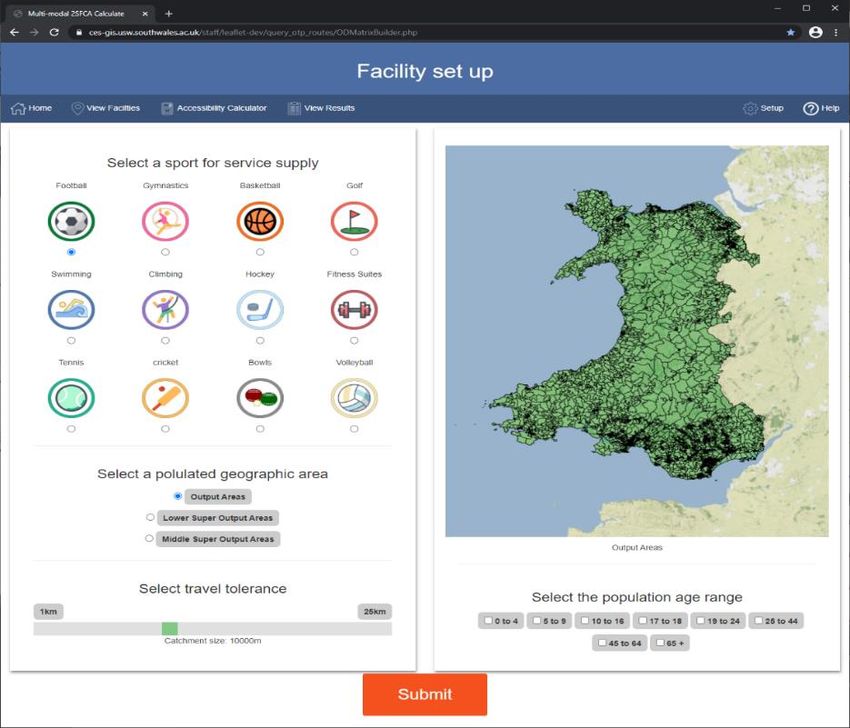
visualise the data. This work continues the open-source elements, while implementing the advantages
of a web-based environment and multi-modal capabilities for a more accurate representation of current
accessibility.
3. Data and Methods
Although the solution can calculate multiple accessibility models, the model used within this study is a
variation of the E2SFCA model that implements a method of including additional modes of transport
proposed by Langford et al. (2016). This model allows for any number of transport types to be
accommodated into the calculation by incorporating times and distances for different modes of transport
generated by a route planner.
There are several route planners available, some through paid services and subscriptions which maintain
and supply their own data for bus networks and times such as Google Maps API (2021) and Baidu Maps
(2021). Alternatives include OpenTripPlanner (2021), Open-Source Routing Machine (OSRM, 2021)
or pgRouting (2021). The route planner used within this study is OpenTripPlanner (OTP) which has
been previously been shown to prove useful when measuring distances for different modes of transport
(Tsalamanis 2018, Owen & Levinson 2015, El-Geneidy et al. 2016). OTP is built on a graph that is
generated using GTFS data that consists of bus times and routes, along with an open street map road
network (Geofabrik 2021). The GTFS data in this study has been generated from Traveline Data (2021).
Finally, during the duration of this project, the supply points and services for testing were supplied by
a national sporting organisation in Wales (Welsh Gymnastics). Although these were used during testing,
any form of service provision with geographic points of access may be used in place of these service
locations. The population demand points are based on census estimated population data. These can be
at any level, including output area (OA), lower super output area (LSOA) and middle super output area
geographic areas (MSOA).
4. System Design
The systems infrastructure, and the processes involved are outlined in figure 1. The structure mainly
comprises of four primary components. The first of these components is the web-based interface that
uses HTML/CSS for interface development. JavaScript is used for the client-side data processing during
the interaction. The second component is a server that contains PHP coding that enables server-side
data processing. The server is responsible for communicating between the web-browser interface and
the remaining two components that allow for the data processing. The third component, is the route
planner OpenTripPlanner for generating the distances, using its REST API, to produce JSON data to be
extracted. The final component in the system is a PostgreSQL spatial database, that is used to house all
the geographic data along with using its PostGIS extension for its geospatial analysis functionality.

                                                   2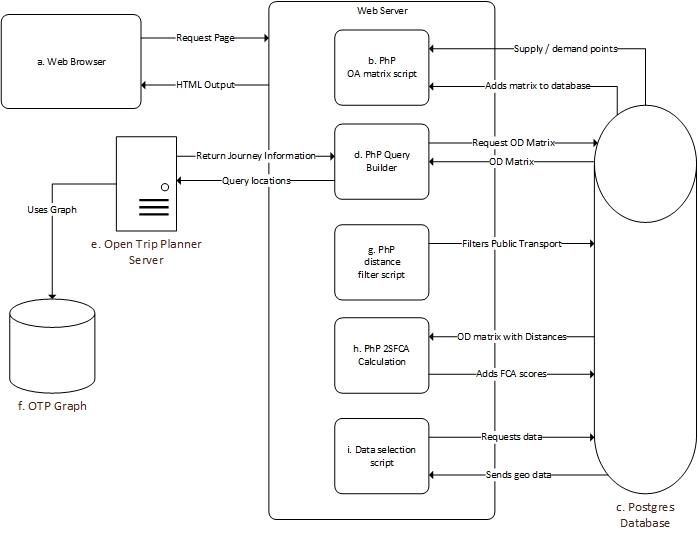
Figure 1: The infrastructure of the open-source web-based solution.
Following Figure 1, the workflow of the model involves:
a. A system user interacts with the web-browser interface (a) to input the desired values and
modelling parameters of the initial calculation in the initial setup. The browser interacts with
the web server holding each of the PHP Scripts. The initial setup is used to set a limit on the
calculation to prevent unnecessary calculation of facilities and demand points.
b. The supply points (in this study the gymnastics facilities) and demand points (population-
weighted centroids) within the Postgres Database (c) are extracted by the web server script (b)
that generates an origin to destination (OD) matrix of each point within the desired parameters
using PostGIS to calculate those points falling within a straight-line distance catchment. Figure
2 shows the interface used to set these parameters.
c. The PHP script (d) then loops through the OD matrix creating a URL string to query OTPs
REST API (e) build on the graph that contains the GTFS and road network data (f). The URL
string contains coordinates of the supply and demand locations to do this. OPT responds with
JSON data of each journey for each of the modes of transport selected. The script (d) then
extracts these journey distances and times and places them into a new table in the PostgreSQL
database.
d. As the public transport returns several journeys that range in different bus companies and
routes, a filtering script (g) is required to select the shortest distance (or based on other
parameters the user may wish such as most cost effective etc). With the public transport
distances filtered, all modes of transport journey times and distances are added to the OD
matrix.
e. The user is now able to perform the calculation using the OD matrix with the journeys and
times. Script (h) builds a SQL string using the parameters entered in Figure 3. The SQL string
is then applied to the PostgreSQL database to generate the scores of each demand location.
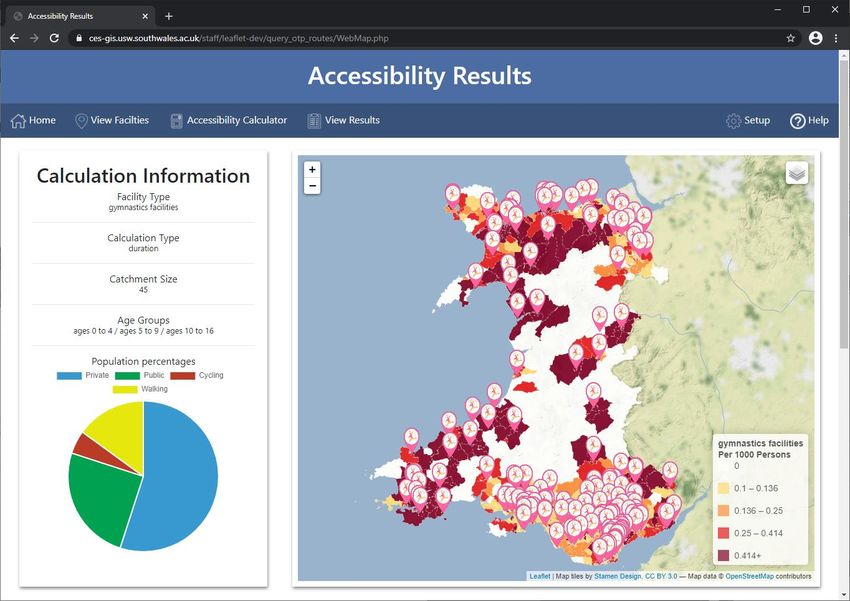
f. Using the script (i) the user is able to select the data to display on the leaflet web-map (j) and
interact with the data as shown in figure 4.
3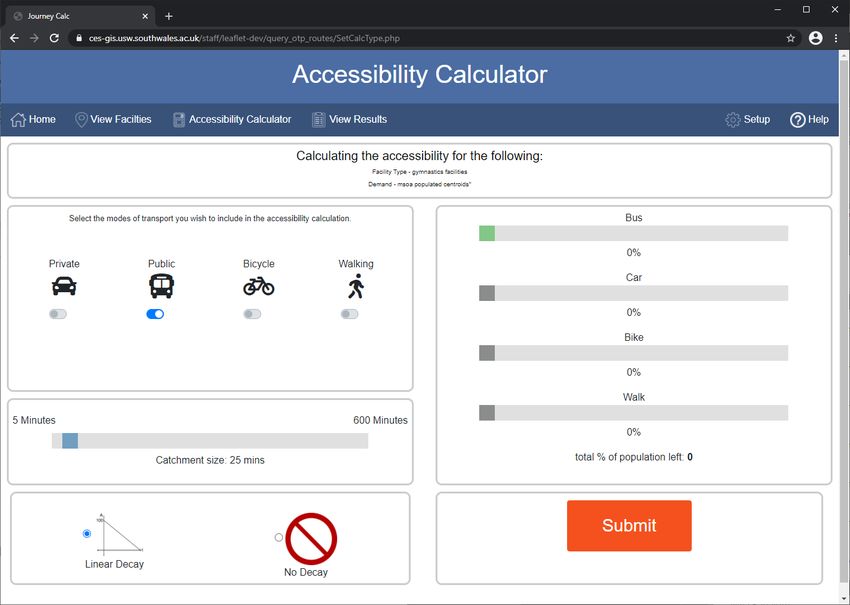
Figure 2: The origin to destination matrix builder user interface

                               4
Figure 3 The accessibility calculation interface.
Figure 4 The interactive web map interface generated using the data calculated from the accessibility
calculator.
55. Results and Discussion
The methods that have been applied within this study have extended previous approaches of measuring
accessibility based around single modes of transport often within distance-based or cumulative
opportunity-based techniques. Each mode of transport also uses the same road network, removing the
need of maintaining multiple datasets for each mode of transport. Furthermore, the accessibility model
used allows for any number of transport modes to be included as long as the route planner is capable of
adding that form of transport.
With the help of potential users in Sport Wales, interfaces are designed for policy makers not necessarily
familiar with GIS tools by hiding the complexity of the interaction and by providing appropriate
guidance and help in implementing the models. The components used, including the web mapping API
are open source which, together with the use of open data, lowers the cost of maintaining the service
this solution offers in contrast to the use of tools such as Google Maps or Baidu Maps. The design of
the system has gone through several iterations with full evaluation of possible solutions at each design
stage. This will be discussed in further detail in the presentation.
Future work involves implementing additional functionality that aids in planning of service provision.
An example being a “what if” scenario where a user simply clicks on a location to add a new facility or
modify a current facility and the accessibility is recalculated with the new or modified facility to view
the impact in access for that geographic location.
6. Acknowledgements
The research presented here is supported by a KESS 2 funded PhD scholarship part funded by Sport.
Knowledge Economy Skills Scholarship (KESS 2) is a pan-Wales higher-level skills initiative led by
Bangor University on behalf of the HE sector in Wales. It is part funded by the Welsh Government’s
European Social Fund (ESF) convergence programme for West Wales and the Valleys.
References
Baidu, 2021. Baidu Maps API. [Online]
Available at: https://map.baidu.com/@11590057.96,4489812.75,4z
[Accessed 09 02 2021].
Bao, D. & Deng, W., 2011. The application of job accessibility measure model in China's major
cities. s.l., TMEE, p. 1872–1876.
Barbieri, S. & Jorm, L., 2019. Travel times to hospitals in Australia. Scientific Data, 6(1), pp. 1-6.
Billaudeau, N. et al., 2011. Investigating disparities in spatial accessibility to and characteristics of
sport facilities: Direction, strength, and spatial scale of associations with area income. Health and
Place, 17(1), pp. 114-121.
El-Geneidy, A. et al., 2016. The cost of equity: Assessing transit accessibility and social disparity
using total travel cost. Transport of Research Part A, Volume 91, pp. 302-316.
Fransen, K., Neutens, T., De Maeyer, P. & Deruyter, G., 2015. A commuter-based two-step floating
catchment area method for measuring spatial accessibility fo daycare centers. Health and Place,
Volume 32, pp. 65-73.
Geofabrik, 2021. Geofabrik. [Online]
Available at: http://www.geofabrik.de/
[Accessed 09 02 2021].
Google, 2021. Google Maps Platform. [Online]
6Available at: https://developers.google.com/maps
[Accessed 09 02 2021].
Langford, M., Fry, R. & Higgs, G., 2012. Measuring transit system accessibility using a modified
two-step floating catchment technique. nternational Journal of Geographical Information Science,
26(2), pp. 193-214.
Langford, M., Higgs, G. & Fry, R., 2016. Multi-modal two-step floating catchment area analysis of
primary health care accessibility. Health & Place, 38(1), pp. 70 - 81.
Narboneta, C. G. & Teknomo, K., 2013. OpenTripPlanner, OpenStreetMap, General Transit Feed
Specification: Tools for Disaster Relief and Recovery. Palawan, IEEE.
OpenTripPlanner, 2021. OpenTripPlanner - Multimodal Trip Planning. [Online]
Available at: https://www.opentripplanner.org/
[Accessed 09 02 2021].
OSRM, 2020. Open Source Routing Machine. [Online]
Available at: http://project-osrm.org/
[Accessed 20 04 2020].
Owen, A. & Levinson, D. M., 2015. jobs, Modelling the commute mode share of transit using
continuous accessibility to. Transport Research Part A, Volume 74, pp. 110-122.
pgRouting, 2020. pgRouting Project. [Online]
Available at: https://pgrouting.org/
[Accessed 08 04 2020].
TravelineData, 2021. Travelinedata. [Online]
Available at: https://www.travelinedata.org.uk/
[Accessed 09 02 2021].
Tsalamanis, I., 2018. Access to services using multimodal transport networks. [Online]
Available at: https://datasciencecampus.ons.gov.uk/access-to-services-using-multimodal-transport-
networks/
[Accessed 10 12 2019].
Wang, L., 2007. Immigration, ethnicity, and accessibility to culturally diverse family physicians.
Health and Place, 13(3), pp. 656-671.
Biographies
Andrew Price is a PhD Student based in the Faculty of Computing, Engineering and Science, at the
University of South Wales. His PhD is based on improving our understanding to access of sporting
facilities in Wales, using GIS.
Mitchel Langford is a Reader at the Faculty of Computing, Engineering and Science, University of
South Wales. His current research interests include dasymetric mapping, population modelling and
geospatial analysis within the fields of healthcare, social equality and environmental justice.
Gary Higgs is a Professor of Geographical Information Science in the Faculty of Computing,
Engineering and Science, University of South Wales and co-Director of the Wales Institute of Social
and Economic Research, Data and Methods (WISERD). Over-arching research interests are in the
application of GIS in social and environmental studies, most recently in the areas of health geography
and emergency planning.
7Jonathan Radcliffe is a Senior Data and GIS Analyst at Sport Wales, after completing his PhD in the
School of Geography and Planning, Cardiff University.
8You can also read