Optimizing Facebook AI Workloads for NVIDIA GPUs - S9866 Gisle Dankel and Lukasz Wesolowski Facebook AI Infrastructure
←
→
Page content transcription
If your browser does not render page correctly, please read the page content below

03/19/2019

Optimizing Facebook AI
Workloads for NVIDIA GPUs
Gisle Dankel and Lukasz Wesolowski
Facebook AI Infrastructure

S9866
Fleetwide GPU Efficiency at Facebook

Outline

1                                  2                        3                   4

NVIDIA GPUs at                     Data-Driven              NVIDIA GPU          Issues and
Facebook                           Efficiency               Timeline Analysis   Solutions
Context                            You can’t improve what   Understanding low   Commonly observed
                                   you can’t measure        utilization         reasons for poor
                                                                                utilization and how to
                                                                                address them

                                                                                                         2
Fleetwide GPU Efficiency at Facebook

Outline

1                                  2   3   4

NVIDIA GPUs at
Facebook
Context

                                               3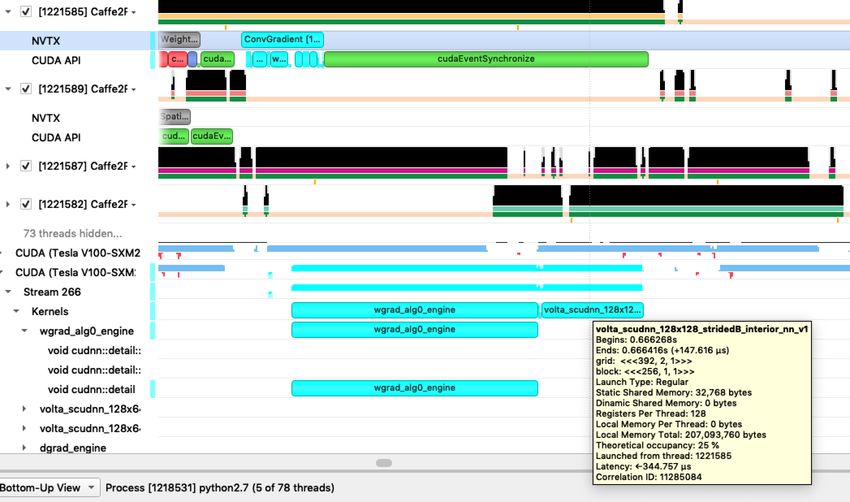
Fleetwide GPU Efficiency at Facebook

Outline

1                                  2   3                                  4

                                            18                                                                                   20
Data-Driven
Efficiency                                 13.5                                                                                  15

You can’t improve what                       9                                                                                   10
you can’t measure
                                            4.5                                                                                  5

                                             0                                                                                   0
                                                  Workflow A Workflow B Workflow C Workflow D Workflow E Workflow F Workflow G

                                                         GPU Hours %                   Average Active Warps

                                                                                                                      4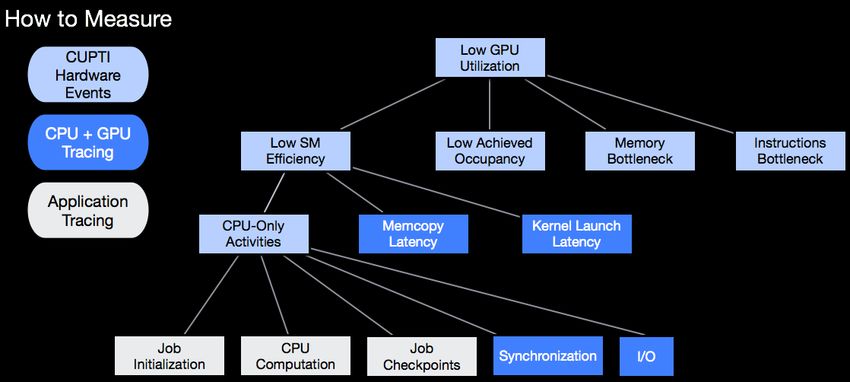
Fleetwide GPU Efficiency at Facebook

Outline

1                                  2                     3   4

NVIDIA GPU                             Low utilization
Timeline Analysis
Understanding low
utilization

                                                                 5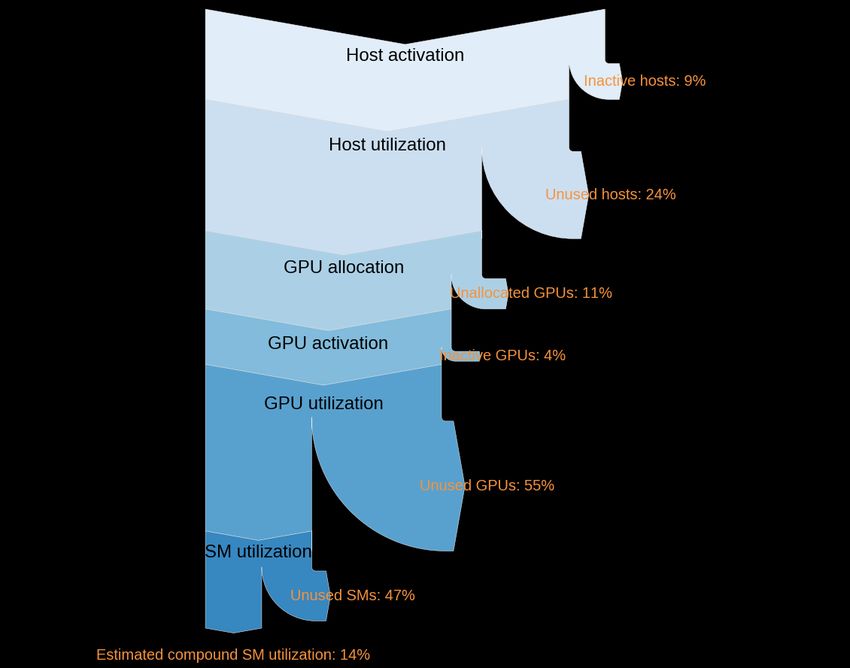
Fleetwide GPU Efficiency at Facebook

Outline

1                                  2   3                4

Issues and
Solutions
Commonly observed
reasons for poor
utilization and how to
address them

                                           Bottleneck

                                                            6
1
NVIDIA GPUs at Facebook
Context
7NVIDIA GPUs at Facebook
1
Why the need for a dedicated efficiency effort
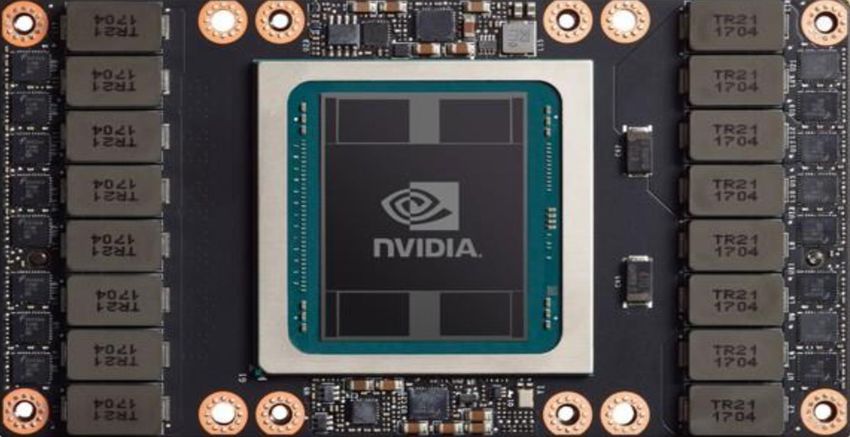
Large shared GPU pool for training
• Mainly Pascal and Volta GPUs, 8 per server
• CUDA 9 (soon 10)
• Mix of CUDA libraries (cuDNN, cuBLAS, …) & custom
kernels
Various users across several teams Enable GPU experts to
• Their own distinct use cases, changes over time
improve efficiency across
• Computer vision, speech, translation and many more
teams with minimal workload
• Many machine learning experts, not as many GPU experts
context
Caffe2 and PyTorch 1.0 in containers
82
Data-Driven Efficiency
You can’t improve what you can’t measure
9Data-Driven Efficiency
2
Efficiency
Efficient Algorithms Efficient Execution
Machine learning domain experts GPU performance experts
Domain-specific efficiency metrics System-centric efficiency metrics
Focused on correctness, Focused on maximizing use of
model experimentation time, resources given particular choice of
and model launch time algorithm
10Data-Driven Efficiency
2
Efficiency
Efficient Algorithms Efficient Execution
Machine learning domain experts GPU performance experts
Domain-specific efficiency metrics System-centric efficiency metrics
Focused on correctness, Focused on maximizing use of
model experimentation time, resources given particular choice of
and model launch time algorithm
This is us
11Data-Driven Efficiency
2
Efficient Resource Utilization - A Complete Picture
Many layers of inefficiency
The top part could fill another talk
We will focus on the portion of time
when GPUs have been allocated to a job
12Data-Driven Efficiency
2
Zooming in on NVIDIA GPU Utilization
What does utilization mean?
High-level utilization metric is coarse
(GPU in use?)
Doesn’t show how many SMs / functional units in
use
A kernel with a single thread running
continuously will get 100% GPU
utilization
Even if it only uses 0.1% of available GPU resources!
H/W Event: SM Active Cycles:
Cycles where SM had > 0 active warps
Streaming Multiprocessors (SM) x 80 Metric: SM Efficiency:
SM Active Cycles / SM Elapsed Cycles
nvidia-smi: GPU 100% utilized
SM Efficiency: GPU ~1% utilized
13Data-Driven Efficiency
2
Zooming in on SM Utilization
What does utilization mean?
SM Efficiency does not tell the whole
story
Single active warp will not utilize SM to anywhere
near its potential
Active Warps:
Number of warps in-flight on an SM
concurrently (0-64)
Achieved Occupancy:
Active Warps / Active Cycles
Even more detail:
*_fu_utilization - Per-functional unit
utilizationInstructions per cycle (IPC)
FLOPS / peak FLOPS
14Data-Driven Efficiency
2
CUPTI – the CUDA Profiler Tools Interface
Dynamic library for writing profiling and tracing tools
Provides multiple APIs:
• Activity API: GPU tracing, e.g. kernel launches, memcopies
• Callback API: Driver and library API tracing
• Event API: GPU events, e.g. cycles, instructions, active warps
• Metric API: Predefined metrics, e.g. SM Efficiency, Achieved Occupancy
• Profiler API: Kernel replays, range profiling
Library (libcupti) must be linked into application to be profiled
15Data-Driven Efficiency
2
Contributors to Low GPU Utilization
CUPTI:
CUDA Profiling Tools Interface
APIs we use:
Events API, Activities API, Callback API
16Data-Driven Efficiency
2
%GPU Hours and Average Active Warps by Workflow
Top workflow accounts for 18% of GPU hours
Average Active Warps is 8 (theoretical max is 64)
18 20 Average Active Warps
Active Warps
=
Elapsed Cycles
13.5 15 = SM Efficiency ⋅ Achieved Occupancy
9 10
Active Warps per SM
vary from 0 to 64
4.5 5
"Active"
means the warp has been issued and is in-
0 0 flight
Workflow A Workflow B Workflow C Workflow D Workflow E Workflow F Workflow G
GPU Hours % Average Active Warps
17Data-Driven Efficiency
2
Profiling Deep Dive
Nsight Systems nvprof
How to Measure + Visual Profiler
Application Tracing Nsight Compute
CUPTI Low GPU
Hardware Utilization
Events
CPU + GPU
Low SM Low Achieved Memory Instructions
Tracing Efficiency Occupancy Bottleneck Bottleneck
Application
Tracing CPU-Only
Activities
Memcopy
Latency
Kernel Launch
Latency
…
Find reasons for
Job Startup /
Checkpoints
CPU
Computation
I/O … large and small gaps
in GPU timeline
18Data-Driven Efficiency
2
Profiling Deep Dive
Nsight Systems nvprof
How to Measure + Visual Profiler
Application Tracing Nsight Compute
CUPTI Low GPU
Hardware Utilization
Events
CPU + GPU
Low SM Low Achieved Memory Instructions
Tracing Efficiency Occupancy Bottleneck Bottleneck
Too Few Threads Cache Misses Arithmetic
Application
Tracing CPU-Only Memcopy
Register Limit Kernel Launch …
Bandwidth Limit Control Flow
Activities Latency
… Latency
… …
Job Startup /
Checkpoints
CPU
Computation
I/O … Find reasons for GPU
kernel bottlenecks
193
GPU Timeline Analysis
Understanding low utilization
20GPU Timeline Analysis
3
NVIDIA Nsight Systems
Source: NVIDIA 21NVIDIA Tools Extension API (NVTX)
Caffe2
Operator
void FacebookGPUOperatorObserver::Start(){
nvtxRangePush(opDetails_->opType);
}
void FacebookGPUOperatorObserver::Stop() {
nvtxRangePop();
}
2223
GPU Timeline Analysis
                                                                                     3
Fleetwide On-Demand Training

Always available tracing at the push of a button
We use our own tracing library today for the following reasons:
•   Always available on-demand (no workload config or build mode)
•   Available in production (at very low overhead)
•   Integrated with job management UI and other relevant perf tools
•   Browser-based (including visualization)

    We use CUPTI Activities API to implement on-demand tracing for production
    workflows. In the future, we hope to expand our use of Nsight Systems.

                                                                                24
GPU Timeline Analysis
3
In-House Tracing Infrastructure Visualized in Chrome
Caffe2 Operator
CPU
Threads
Cuda Runtime
API
GPU Kernels
GPU
Streams
25GPU Timeline Analysis
3
Libgpumon
Profiling and tracing CUPTI-based Profiling Library Trace store Metrics stores
Batch
Object
library Host Process
Store
Analytics
Application (Caffe2 / PyTorch)
Detailed utilization metrics Metrics
Realtime
Analytics
libcupti libgpumon Daemon
and tracing on-demand for Moni-
toring
all production workflows
OS Cuda Driver
H/W GPU PMU
26GPU Timeline Analysis
3
Telemetry and Profiling Takeaways
Visibility, top-down, full coverage Best experience when
Collect metrics deep and wide all these integrate
• Hierarchical top-down breakdown smoothly
• Detailed utilization metrics
• Break down by team, user, package, workflow, GPU kernels etc.
Systematically address low utilization with on-demand tracing
• Nsight Systems and CUPTI Activity API for CPU-GPU interactions
• Application level tracing for big picture
Target frequently used GPU kernels with nvprof and Nsight Compute
• What to target: Use periodic tracing to rank kernels across fleet
274
Issues and Solutions
Commonly observed reasons for poor utilization and how to address them
28Issues and Solutions
4
Fleetwide Performance Optimization
18 20
Aggregate occupancy and resource use stats by workflow
Select the set of workflows with occupancy < 8
13.5 15
Rank resulting workflows by aggregate resources consumed
Select top workflow 9 10
Collect timeline trace
4.5 5
Identify and fix bottleneck
Repeat 0 0
Workflow A Workflow B Workflow C Workflow D Workflow E Workflow F Workflow G
GPU Hours % Average Active Warps
29Issues and Solutions
4
Fleetwide Performance Optimization
18 20
Aggregate occupancy and resource use stats by workflow
Select the set of workflows with occupancy < 8
13.5 15
Rank resulting workflows by aggregate resources consumed
Select top workflow 9 10
8
Collect timeline trace
4.5 5
Identify and fix bottleneck
Repeat 0 0
Workflow A Workflow B Workflow C Workflow D Workflow E Workflow F Workflow G
GPU Hours % Average Active Warps
30Issues and Solutions
4
Fleetwide Performance Optimization
18 20
Aggregate occupancy and resource use stats by workflow
Select the set of workflows with occupancy < 8
13.5 15
Rank resulting workflows by aggregate resources consumed
Select top workflow 9 10
8
Collect timeline trace
4.5 5
Identify and fix bottleneck
Repeat 0 0
Workflow A Workflow B Workflow C Workflow D Workflow E Workflow F Workflow G
GPU Hours % Average Active Warps
31Issues and Solutions
4
Fleetwide Performance Optimization
18 20
Aggregate occupancy and resource use stats by workflow
Select the set of workflows with occupancy < 8
13.5 15
Rank resulting workflows by aggregate resources consumed
Select top workflow 9 10
8
Collect timeline trace
4.5 5
Identify and fix bottleneck
Repeat 0 0
Workflow A Workflow B Workflow C Workflow D Workflow E Workflow F Workflow G
GPU Hours % Average Active Warps
Optimization 32Issues and Solutions
4
Fleetwide Performance Optimization
Aggregate occupancy and resource use stats by workflow
Select the set of workflows with occupancy < 8 (12.5% of max)
Rank resulting workflows by aggregate resources consumed
Select top workflow
Collect timeline trace
Identify and fix bottleneck
Repeat
Bottleneck
33Issues and Solutions
4
Fleetwide Performance Optimization
Before optimization
Bottleneck
After optimization
200x operator
34
speedupIssues and Solutions
4
Fleetwide Performance Optimization
18 20
Aggregate occupancy and resource use stats by workflow
Select the set of workflows with occupancy < 8
13.5 15
Rank resulting workflows by aggregate resources consumed
Select top workflow 9 10
8
Collect timeline trace
4.5 5
Identify and fix bottleneck
Repeat 0 0
Workflow A Workflow B Workflow C Workflow D Workflow E Workflow F Workflow G
GPU Hours % Average Active Warps
35Issues and Solutions
4
Fleetwide Performance Optimization
18 20
Aggregate occupancy and resource use stats by workflow
Select the set of workflows with occupancy < 8
13.5 15
Rank resulting workflows by aggregate resources consumed
Select top workflow 9 10
8
Collect timeline trace
4.5 5
Identify and fix bottleneck
Repeat 0 0
Workflow A Workflow B Workflow C Workflow D Workflow E Workflow F Workflow G
GPU Hours % Average Active Warps
Optimization 36Issues and Solutions
4
A One-Minute Primer to Caffe2 and PyTorch
The vast majority of GPUs at FB are used for training machine learning models using Caffe2 or PyTorch
Caffe2 and PyTorch are open source deep learning platforms that facilitate expression, training, and inference of neural network models
In Caffe2 models are expressed by defining a graph for the neural network whose nodes are operators
PyTorch supports eager mode in which the graph is expressed implicitly through control flow in an imperative program
In practice the graph can usually be automatically generated to facilitate optimizations and tracing support similar to Caffe2
37Issues and Solutions
4
API and Platform Design Choices that Improve Performance
Caffe2 platform support
For translating loops into kernel code with proper block sizes; helps improve SM utilization and occupancy
Dependency-tracking system for operators
Performs memory copies into and out of GPU memory generally only when required
Automatic fusion of operators
Prevents unnecessary copies and kernel invocations
CUDA's similarity to C++
Reduces the barrier of entry for writing GPU code
38Issues and Solutions
4
Causes of Performance Issues in GPU Code
A case of mistaken assumptions
GPUs differ significantly from CPUs
• Much higher number of execution units
• Data-parallel code and execution
• Lower single-thread performance
• Accelerator managed by the CPU
Each difference requires an adaptation in code patterns for good performance
Most new GPU programmers are experienced CPU programmers
• They often use common CPU practices and coding patterns, which may not work well on the GPU
39Issues and Solutions
4
Patterns of GPU Misuse
Most GPU performance issues result from a Blind Spot or mistaken assumptions
about key GPU architectural aspects
As a result, the programmer writes Anti-Pattern code that performs poorly
Often, a simple Solution is available to a whole class of problems
40Issues and Solutions
4
Issue 1: CPU to GPU Communication Latency
So close, yet so far away
Blind Spot: Overhead of kernel launches and cudaMemcpy is relatively high
And GPUs are not designed to allow executing a large number of cudaMemcpy calls concurrently
Anti-Pattern: Code that transforms GPU data using CPU loops containing fine-grained
cudaMemcpy calls
Solution: Rewrite these operations as GPU kernels that transform the data using
blocks of GPU threads
41Issues and Solutions
4
Example: The Case of the 14k cudaMemcpy Calls
CPU Timeline
GPU Timeline Zoomed In
42Issues and Solutions
4
Before and After Optimization
Before optimization
Bottleneck
After optimization
200x op speedup, 3.5x workflow
43
speedupIssues and Solutions
4
Issue 2: Bottlenecks at the CPU Cause High GPU Idle Time
Feeding the beast
Blind Spot: Peak throughput is much higher on GPU than on CPU
Anti-Pattern: Code that performs expensive data transformations on the CPU,
causing GPU to go idle for extended time
Solution 1: Do as much as possible of the expensive work on the GPU with kernels
that take advantage of the available concurrency
Solution 2: Run more threads on the CPU to concurrently prepare work for GPU
execution to help feed the GPU more effectively
44Issues and Solutions
4
Example: The Case of the Well-Utilized CPU Threads
... and poorly utilized GPUs
A workflow used 8 CPU threads to manage the 8 GPUs on the server
CPU timeline showed good thread utilization, GPU timeline showed gaps
Increasing the number of threads on the CPU (from 8 to 64) to concurrently prepare more GPU work
improved overall throughput by 40%
45Issues and Solutions
4
Issue 3: Improper Grain Size per GPU Thread
The more the merrier
Blind Spot: On the CPU, the work per thread needs to be substantial (e.g. to absorb
context-switch overhead), but GPUs switch between warps of threads very efficiently,
so keeping grain size very low is fine
Anti-Pattern: GPU code with too much work per thread artificially limits concurrency,
yielding low block count and SM efficiency
Solution: Rewrite kernels to expose more concurrency and increase number of blocks
per kernel
46Issues and Solutions
4
Issue 4: Improper Memory Access Patterns
Blind Spot: GPU memory data access patterns between threads in the same warp can
affect achieved memory bandwidth by more than an order of magnitude
Anti-Pattern: Code with inefficient memory access patterns, where threads access
different memory segments or individual threads copy large chunks of memory
Solution: Rewrite kernels to structure memory access patterns in the proper way to
utilize bandwidth effectively
47Issues and Solutions
4
Proper GPU Global Memory Access Patterns
Threads access addresses in the same segments
Each thread fetches one word (fine grain)
Source: CUDA Programming Guide
48Issues and Solutions
4
Example: Increase Concurrency and Improve Memory Access Pattern
A timeline for a workflow showed 95% of GPU active time in one operator that
performed a data transformation
GPU Summary
indicates good
utilization
95% of active time spent executing one kernel type
49Issues and Solutions
4
Example: Increase Concurrency and Improve Memory Access Pattern
Two birds with one stone
A timeline for a workflow showed 95% of GPU active time in one operator that performed a data transformation
Each thread in the kernel block was issuing a memcpy inside GPU global memory to replicate a large portion of the
input tensor
We rewrote the kernel code so each thread would write a single value of the output tensor
memcpy(output_ptr, input_ptr, inner_dim * item_size);
output_data[index] = input_data[row * inner_dim + col];
3x speedup in operator and workflow
50Issues and Solutions
4
Issue 5: Insufficient Concurrency
When a GPU for your workload is overkill
Blind Spot: Modern GPUs contain thousands of arithmetic units, so code must expose
that much concurrency for proper utilization
Anti-Pattern: Code that runs a few kernel blocks at a time with only a small fraction
of SMs utilized
Solution: If the problem inherently has low concurrency, consider running on CPU
instead
51Issues and Solutions
4
Example: Too Little Work
You know you are in trouble when it takes longer to launch a kernel
than to run it
52Issues and Solutions
4
Optimization Takeaways
Platform abstractions allow our workflow developers to make use of GPUs and help with some
performance aspects
Timeline tracing is the first tool you should use for identifying bottlenecks in parallel workflows
To become a better GPU programmer, understand the key differences between GPU and CPU
architectures
• Very high parallelism – requires high concurrency and efficiently feeding work from CPU
• Accelerator - minimize CPU to GPU communication
• Zero-cost “context switch” – don’t be afraid to keep grain size very low
• Access patterns – learn the optimal access patterns for the various memory/cache types on the GPU
Don't reinvent the wheel - use optimized libraries like cuDNN whenever possible
53Q&A
54Thank you for watching
55GPU Timeline Analysis
3
NVIDIA Nsight Systems
Understanding the workflow
A tracing tool such as NSight Systems is what we use to investigate low utilization
cases
• Collects both CPU and GPU traces
• API for adding application-level trace events
• Great at highlighting system-wide bottlenecks
In addition, we use CUPTI Activities API directly
• NVIDIA's tools are built on top of CUPTI APIs Use off-the-shelf tracing tools or
• Allows greater flexibility use CUPTI APIs to build your
• Derive metrics on-the-fly, aggregate per-kernel stats etc own
56Data-Driven Efficiency
2
%GPU Hours and Average Active Warps by Workflow
"Goodput" ResourcesUsed
Efficiency = Utilization =
Cost ResourcesAvailable
Goodput is not easily measurable - Used resources is measurable in context
workload and context dependent independent manner
From images processed to user engagement rates Various levels of system metrics
From GPU hours to FLOPs / instructions
Cost is standardized and measurable
E.g. GPU hours Available resources is measurable
Available GPU hours, peak FLOPs / instructions
Poor utilization = waste of expensive resource TODO: clarify
Focus on improving utilization - lower cost for the same goodput
57Data-Driven Efficiency
2
Contributors to Low GPU Utilization
58You can also read