Cricket Analysis and Prediction of projected Score and Winner using Machine Learning
←
→
Page content transcription
If your browser does not render page correctly, please read the page content below
IJARCCE                                           ISSN (Online) 2278-1021
                                                                                                        ISSN (Print) 2319-5940

             International Journal of Advanced Research in Computer and Communication Engineering
                                             Vol. 10, Issue 2, February 2021
                                           DOI 10.17148/IJARCCE.2021.10223

                  Cricket Analysis and Prediction of
                  projected Score and Winner using
                          Machine Learning
      Apurva Lawate1, Nomesh Katare2, Salil Hoskeri3, Santosh Takle4, Prof. Supriya. B. Jadhav5
                            Student, IT, Sinhgad Institute of Technology, Lonavala, India1-4
                               Professor, IT, Singhad Institute of Technology, Lonavala 5

Abstract: This paper is about a model that can predict the projected score of 1st inning as well as the winner in a IPL
cricket match. The performance of model depends on various features like wickets taken in last 5 overs, runs scored in
last 5 overs, overs, overall score and wickets at current ball. The proposed model contains data from IPL matches
played between years 2008 and 2019. This paper will give us step by step insights on how one can predict projected
score of 1st inning while the match is still in progress. Linear Regression algorithm is used to predict the score. This
model explains about 75.226% of data. The model specifically emphasize on using the data from past 5 overs to predict
what might be the projected score of the match which has not been considered in any existing model. Using this model,
we can get good insight during the match on how much score will the current batting team obtain.

Keywords: Analysis, Efficiency, Evaluation, Cricket, First innings.

                                                  I. INTRODUCTION
Cricket is the second most-watched program on television. The popularity of this sport is soaring high in South East
Asian countries like India, Pakistan, Bangladesh, and Sri-Lanka. One of the major issues now is that the projected score
displayed in the first inning of the match doesn’t match with actual outcome of the 1st inning. This is where the
motivation to create a model that will give a near to accurate projected score emerged. This will help the audience to
know what to expect from current match. Wrong projected scores may heighten their expectations which if not fulfilled
may lead to disappointment in players thus causing social criticism.

                                             II. LITERATURE SURVEY
 In order to have a well-versed knowledge about this topic, there have been some researches that have been done in the
past and their detail have been discussed here.
1. Manuka Maduranga Hatharasinghe et al. used simulation based approach, Team Composition Approach and brought
about a conclusion that a high accuracy scores based model can be developed accurately to predict outcome of cricket
matches.
2. Dr.B.Santhosh Kumar, T.Daniya,Dr.J.Ajayan proposed a Paper on Detecting Third Umpire Decisions & Automated
Scoring System of Cricket using Image Pre-Processing and Convolutional Neural Network.
3. Harshit Barot, Arya Kothari et al. had done Analysis and Prediction for the Indian Premier League. The methodology
that they used were Pre-Processing And Feature Extraction Analysis on the basis of The Toss Factor, Bat and Win or
Chase and Win, Targets chased, Runs Scored by teams per over on an average ,Batting Index, Bowling Index.
4. A.N.Wickramasinghe, Roshan D.Yapa created Cricket Match Outcome Prediction Using using R-Studio by
accessing Twitter API network analysis. In the paper, According to the logistic models that have created, combination
of degree and betweenness centrality measurements have the highest accuracy (92%).
5. Jacob Perricone has predicted Results for Professional Basketball Using NBA API Data using K-nearest neighbours
with 10 neighbours and 30 leafs ,Neural Networks, Logistic Regression , Support Vector Machine with the linear, rbf,
and sigmoid kernels.
6. Prof. Monali Shetty, Sankalp Rane made Machine learning-based Selection of Optimal sports Team based on
the Players Performance using Logistic Regression, Support Vector and Random Forest. The proposed work can
address the issue of selecting the optimal team in cricket without any prejudice and give equal importance to all-
rounders.
7. Nigel Rodrigues et al. have created Cricket Squad Analysis Using Multiple Random Forest Regression by

 Copyright to IJARCCE                                  IJARCCE                                                          140

                   This work is licensed under a Creative Commons Attribution 4.0 International License
IJARCCE ISSN (Online) 2278-1021
ISSN (Print) 2319-5940
International Journal of Advanced Research in Computer and Communication Engineering
Vol. 10, Issue 2, February 2021
DOI 10.17148/IJARCCE.2021.10223
methods of Data Extraction ,Data cleaning ,Feature Selection, Data Transformation ,Machine Learning Models ,
Selecting the most accurate model. The study provides a mathematical approach of selecting the players by considering
the previous performance of the player against a particular.
8. B.Padmaja et al. created Player Performance Analysis in Sports: with Fusion of Machine Learning and Wearable
Technology using Quantitative Analysis of statistical Data. The aim was that Machine Learning, along with Wearable
devices can make a great impact on the players by making patterns, strategies, planning, reduce the risk of injury and
improve their performances.
III. PROPOSED SYSTEM ALGORITHMS AND TECHNIQUES
Fig. 1. Proposed System.
Data of the past 10 years of IPL matches is used to create this dataset. The Data is dated from 2009 to 2019. It is
split into two parts, the data from 2008 to 2016 is used to train the models and the data from 2017 onwards is
used to test the model. Various algorithms like Linear Regression, Ridge Regression and Multilayer Perceptron Neural
Network were used. This will be discussedin detail in next section of this paper.
IV. ALGORITHMS AND TECHNIQUES
A. Algorithm
1.)LINEAR REGRESSION:
In linear regression, relationships are modeled using linear prediction functions whose unknown model parameters are
estimated from the data. These models are called linear models. Like all forms of regression distribution of a response
given the values of predictors, rather tham the common probability distribution of all these variables, which is the
domain of multiverse analysis. The model has theform Y = a+ bX
Copyright to IJARCCE IJARCCE 141
This work is licensed under a Creative Commons Attribution 4.0 International LicenseIJARCCE ISSN (Online) 2278-1021
ISSN (Print) 2319-5940
International Journal of Advanced Research in Computer and Communication Engineering
Vol. 10, Issue 2, February 2021
DOI 10.17148/IJARCCE.2021.10223
Fig. 2. Linear Regression.
2.)MULTILAYER PERCEPTRON NEURALNETWORKS:
An MLP has minimum of three layers of nodes i.e an input layer, a hidden layer and an output layer. E ach node is
a neuron that uses a nonlinear activation function except for the input nodes. MLP uses a supervised learning technique
called backpropagation for training. Its multiple layers and non-linear activation distinguish MLP from a linear
perceptron. It can help to distinguish the data that is not linearly separable.
Fig. 3. Multilayer Perception Neural Network.
3.)RIDGE REGRESSION:
Ridge regression may be a thanks to create a parsimonious model when the amount of predictor variables during a set
exceeds the amount of observations, or when a knowledge set has multi-collinearity (correlations between predictor
variables). Ridge regression belongs a category of regression tools that use L2 regularization. This sometimes leads
to the elimination of some coefficients altogether, which may yield sparse models. L2 regularization adds an L2
penalty, which equals the square of the magnitude of coefficients. L2 regularization helps to add an L2 penalty, which
is equal to the square of the magnitude of coefficients.
A. Dataset description
This dataset is a ball to ball record of all the IPL matches from 2008 to 2019. The string data in this dataset is processed
using one hot encoding. Also the data is cleaned as per the requirements of current scenario. All the irrelevant teams are
removed while playing 8 teams are used for model building. The model works with taking into consideration the runs
scored and wickets taken in last 5 overs, so the overs lessthan 5 are not taken into consideration.
Copyright to IJARCCE IJARCCE 142
This work is licensed under a Creative Commons Attribution 4.0 International LicenseIJARCCE ISSN (Online) 2278-1021
ISSN (Print) 2319-5940
International Journal of Advanced Research in Computer and Communication Engineering
Vol. 10, Issue 2, February 2021
DOI 10.17148/IJARCCE.2021.10223
Fig. 4. Data Description.
B. Feature Selection
The original data contained 15 columns, the ones with higher significance were chosen while the features showing near
to no correlation where removed(mid, striker, non-striker,date etc).
However before we discuss how the features where chosen, it will be relevant to say that if the features like batsman,
bowler and venue where kept, the one hot encoding would have produced one column for each possible player and
venue available in this dataset which would have resulted in more than 500 columns. This would make it very complex
to train the model.
So for our approach to work we have only considered significant feature which would be the playing teams. This teams
are also encoded as per their role in 1st inning of match (Bat/Bowl). This creates 16 features for 8 teams(8 teams * 2
roles = 16 features).
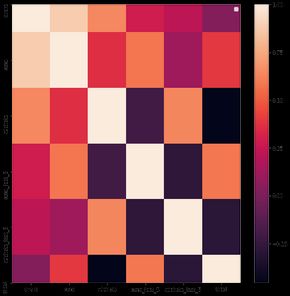
Also the correlation among the other features like total score, runs, overs, wickets, runs scored in last five overs and
wickets in last five overs is interesting to observe in the heat-map shown below, the 16 other features we discussed
previously are not included. Although some of the batting teams and bowling teams were showing negative or
positive correlation with each other, they must not be included as it is not causality. The performance of some batting
team in current match won’t be affected by batting performance of other teams which are not playing in the current
match.
Fig. 5. Heatmap for correlation in other 6 features..
Copyright to IJARCCE IJARCCE 143
This work is licensed under a Creative Commons Attribution 4.0 International LicenseIJARCCE ISSN (Online) 2278-1021
ISSN (Print) 2319-5940
International Journal of Advanced Research in Computer and Communication Engineering
Vol. 10, Issue 2, February 2021
DOI 10.17148/IJARCCE.2021.10223
V. IMPLEMENTATION
The implementation is done via a web application which uses flask API, all the models are trained in a Jupyter
Notebook and SKLearn library is used. Three models were built which gave us different score. The score metric
usedto evaluate all 3 models was R squared metric which is considered best for regression problems.
As per the data, the linear regression shows the best fit to the data. Also the ridge regression is better for this
prediction system compared to MLP Neural Networks. It can be seen that the R2 score for NN is 0.69 after
convergence which is somewhere below 500 Epochs.
Fig. 6. User Interface.
The best model i.e Linear Regression is then pickled and used in our web application to predict the model. Pickle is
the library used for serialization and deserialization of python objects. When the user inputs the data into web
application and submits it, following procedure occurs in python application which produces the output. 1) The batting
team entered by user is assigned as 1 value in dataset and other batting teams are assigned as 0. Same thing happen
with bowling teams.
2) A list is created with 16 variables eg. If Chennai is assigned as batting team and Mumbai is assigned as bowling
team it will be hard coded in backend as [1,0,0,0,0,0,0,0] + [0,0,0,0,1,0,0,0] 3) This two lists are then joint and
appended with remaining 5 variables input from HTML form. 4) The pickled model is then called by passing the
above list (by converting into Numpy array) in it. The prediction of total score is then added by 5 to get maximum score
possible and subtracted by 10 to get minimum score possible. This range is then displayed to user as final result. Eg. If
the model predicts 150 as projected score for first inning then 140 to 155 will be the range of final result.
VI. CONCLUSION
The proposed work can help us predict accurate projected score in between a progressing match. It is successfully
implemented as a web application with the help of Flask.
This model provides us with score as accurate as 75.226% with the help of linear regression. The above claim is
verified by testing the model over the matches played between years 2017 to 2019. Following are the results of each
model used for prediction.
TABLE I
Sr Table Column Head
No Model Score(Rsquared)
1 Linear Regression 0.7522633566350527
2 Ridge Regression 0.7522398603585928
TABLE II
Sr Table Column Head
No Model Epoch Score
3.a) MLP Neural Network Regressor 500 0.6909684237142
3.b) MLP Neural Network Regressor 200 0.7269927228884
Copyright to IJARCCE IJARCCE 144
This work is licensed under a Creative Commons Attribution 4.0 International LicenseIJARCCE ISSN (Online) 2278-1021
ISSN (Print) 2319-5940
International Journal of Advanced Research in Computer and Communication Engineering
Vol. 10, Issue 2, February 2021
DOI 10.17148/IJARCCE.2021.10223
This analysis can be done by considering more factors like weather, venue, batsman and bowler hence giving us better
results. Also the previous match outcomes resulted due to super over must be separately analyzed and included in the
model. This dynamic factors can change the outcome of the match in split seconds. Additional work can lead to obtain
usa better model with much accurate predictions.
Acknowledgment
We would like to thank our guide Prof. Supriya. B. Jadhav, Department of Information Technology, Sinhgad Institute
of Technology for her help and immense guidance throughout our project.
REFERENCES
[1] Manuka Maduranga Hatharasinghe , “Data Mining and Machine Learning in Cricket Match Outcome Prediction:,” Mar 29-31, 2019.
[2] Dr.B.Santhosh Kumar, T.Daniya,Dr.J.Ajayan, Detecting Third Umpire Decisions and Automated Scoring System of Cricket , ”11-12 July, 2019.
[3] Harshit Barot, Arya Kothari, Pramod Bide, Bhavya Ahir, Romit Kankaria, “Analysis and Prediction for the Indian Premier League ,” June 5-7,
2020
[4] A.N.Wickramasinghe, Roshan D.Yapa, “Cricket Match Outcome Prediction Using Tweets and Prediction of the Man of the Match using Social
Network Analysis: Case Study Using IPL Data,” 2018.
[5] Jacob Perricone, “Predicting Results for Professional Basketball Using NBA API Data,”April 2019.
[6] Prof. Monali Shetty, Sankalp Rane , “Machine learning-based Selection of Optimal sports Team based on the Players Performance ,” 2020.
[7] Sahar S. Tabrizi, Saeid Pashazadeh, Vajiheh Javani , Comparative Study of Table Tennis Forehand Strokes Classifification Using Deep Learning
and SVM , May 2019.
[8] Nigel Rodrigues , Nelson Sequeira , Stephen Rodrigues , Varsha Shrivastava , Cricket Squad Analysis Using Multiple Random Forest Regression ,
2019.
[9] B.Padmaja, Y. Mohana Roopa, P. Sri Harsha Vardhan Goud , “Player Performance Analysis in Sports: with Fusion of Machine Learning and
wearable Technology,” 2019.
Copyright to IJARCCE IJARCCE 145
This work is licensed under a Creative Commons Attribution 4.0 International LicenseYou can also read