Economics of Sport (EC325) - Lecture 6: Forecasting: an application Carl Singleton1 - University of Reading
←
→
Page content transcription
If your browser does not render page correctly, please read the page content below
Economics of Sport (EC325)
                    Lecture 6: Forecasting: an application

                                 Carl Singleton1

                                 University of Reading

                                27th February 2020

1 c.a.singleton@reading.ac.uk
                                                             1 / 27
Forecasting: an application
Issues covered:
- How can we forecast the outcome(s) of a football match?
Main reading:
Various — see Blackboard
2 / 27What are forecasts? And why does studying them matter?
“Forecasts form a central part of everyday life; they are statements
regarding the probability of particular states of nature occurring. In
general, economic agents have preferences over different states of
nature, which can have real consequences in money or other terms.
As such, the evaluation of forecasts is important and in principle
ought to relate to agents’ preferences.”
(Reade et al., 2019, p. 1)
See also British Nobel Prize winner Clive Granger & Pesaran, 2000, J. of
Forecasting
3 / 27Class Discussion
Why should we care (academically) about
forecasting football matches?
4 / 27Why should we care (academically) about forecasting football
matches?
- People get direct utility from making (correct) predictions of
football match outcomes, or consuming them - there are
examples of this everywhere:
- Punditry — there is a constant supply of opinion and conjecture
about football, including about future matches, which implies that
there is some demand being met for it.
- Lots of people do it,
e.g., Fantasy Premier League and Superbru Predictor Game
- Forecast themselves are in demand, otherwise why do these
people produce them?: 538, University of Reading
‘Supercomputer coverage, BBC Sport & Mark Lawrenson
5 / 27Why should we care (academically) about forecasting football
matches? (continued)
- People can make money from predicting football matches. You
can purchase or sell risky assets/contracts (bets, lays), for which
at some fixed point in time the true value becomes certain.
- This takes place either informally, or with formal bookmakers, or
on prediction markets (betting exchanges).
- The prices of these assets/contracts imply individual or market
driven forecasts of event outcomes.
- Betting is popular... e.g., Betfair Exchange.
- There are more daily trades on the Betfair Exchange than on all
the major European stock markets combined
(see Croxson & Reade, 2014; The Economic Journal).
6 / 27Why should we care (academically) about forecasting football
matches? (continued)
- Studying prediction markets can allow economists to test
theories about how markets work in general, which are difficult
to test in other contexts.
- These markets, as well as the forecasting by tipsters and pundits,
may also reveal information about how individuals form
expectations, how they respond to information, and any
behavioural biases in the background.
(More on this in Lectures 7 & 8)
- Unlike other types of forecasts where data is readily available,
the range of expertise in football and other sports forecasting is
diverse — e.g., compare the range of forecasts for football
matches with those for GDP growth.
- Football is a specific context, but the forecast methods developed
through trying to accurately predict match outcomes may have
wider applications (e.g., crowd-based forecasting)
7 / 27Football matches - What is the outcome variable? What are we
forecasting?
- The ultimate outcome of a football match is the scoreline, e.g.,
2-1 (Home goals - Away goals)
- This variable is strange:
Non-standard: it is non-continuous, made up of two non-negative
integers, and generates a range of important
sub-outcomes (e.g., the result).
Residual outcome: the tie is a third outcome between either team
winning. Despite 1-1 being the most common outcome,
it is a residual outcome.
Uncertainty: a large number of potential event outcomes ensures that
each has only about a 10% likelihood of occurring.
Fragility: the median number of goals is three, with a variance
near to three, and over 10% of all goals are scored in
the final five minutes of matches.
Salience: the scoreline determines the result of a football match,
and attracts attention from the forecaster.
8 / 27Football matches - What is the outcome variable? What are we
forecasting? (continued)
- This strangeness makes forecasting a football match, and
evaluating those forecasts, less than straightforward tasks.
- Nonetheless, it makes sense to start from the scoreline, as it
contains several sub-outcomes that the forecaster might also be
interested in.
9 / 27Sub-outcomes described by the scoreline
The scoreline: the actual goals scored by each side. The scoreline is a
pair of numbers, si = (hi , ai ), where the number of
goals scored by the home team is always listed first. We
denote the actual scoreline by si and any forecast of it
by bsi .
The result: whether either team wins, or the game is a draw.
Denote the result of some match i as ri . The result can
be defined as a single variable taking three values, one
each for a home win, an away win, and a draw. For
example, we could define the following values:
0 if hi < ai
ri = r(si ) = 0.5 if hi = ai (1)
1 if hi > ai .
Note that the result ri is a function of the scoreline, so
ri = r(si ).
10 / 27Sub-outcomes described by the scoreline (continued)
Margin: the difference between the goals scored by two teams in
match i;
mi = m(si ) = hi − ai .
Total goals scored: the total number of goals scored by both teams in
match i;
ti = t(si ) = hi + ai .
- The forecasting model has to reflect the outcome of interest. But
all these outcomes are a function of the scoreline, so we begin
with a model that predicts the rate of goal arrival in football
matches.
- This is the most widely used model by football forecasters in
practice, and on which more complicated versions have been
based.
11 / 27Bivariate Poisson model of goal arrival
- Goals scored by each team in a football match are modelled as
jointly Poisson distributed.
- The counts of goals scored in match i for the home and visiting
teams can be thought of as functions of their own strengths Xi1
and Xi2 , respectively, and some third common factor Xi3 ,
representing the match conditions (e.g., weather, time of the
year, on TV, ‘a cold, wet Wednesday night in Stoke’).
- Define three Poisson distributed random variables Xi1 , Xi2 , Xi3 ,
such that hi = Xi1 + Xi3 and ai = Xi2 + Xi3
- Let these be jointly distributed according to a bivariate Poisson
distribution, with BP(λi1 , λi2 , λi3 ), where the λ s are parameters
to be estimated.
12 / 27Bivariate Poisson model of goal arrival (continued)
- The regression model is written as:
(hi , ai ) ∼ BP(λi1 , λi2 , λi3 ) ,
(2)
log(λik ) = w0ik β k , k = 1, 2, 3 .
- wik is a vector of explanatory variables.
- β k is a vector of coefficients.
- The λ s can be interpreted as the estimated scoring rates in the
match.
- Estimated using Maximum Likelihood - there are R and Python
packages available online which will estimate the standard
variant of the model.
13 / 27Bivariate Poisson model of goal arrival (continued)
- E [hi ] = λi1 + λi3 , E [ai ] = λi2 + λi3 , and Cov(hi , ai ) = λi3 .
- The mode (most likely number of goals) will be the nearest
integer below the mean value, by the nature of the Poisson
distribution - this would be the suggested scoreline point
forecast of the model, though not necessarily for the result.
- Generally, the model will provide a probability prediction for
every possible scoreline, from which you can then calculate the
probability forecasts of the other sub-outcomes discussed above.
- But what if we are only interested in the result outcome? Surely
a simpler model would suffice...
14 / 27Ordered logit or probit model of the match result
Remember:
0 if hi < ai
ri = r(si ) = 0.5 if hi = ai (3)
1 if hi > ai .
- The result outcome is a discrete random variable.
- From the perspective of one team, e.g., the home team, it is ordered,
with a home win better than a draw, and a draw better than an away
win, i.e., it is ordinal.
- It is also the in the nature of a football match that the outcome is closer
to a home win when it is a draw than when it is an away win, etc.
- Therefore, a good forecasting model is likely to be one which reflects
the ‘data generating process’, i.e., how football actually works, like the
goal arrival model.
- Forecasters, therefore, typically use ordered logit or probit models.
15 / 27Ordered logit or probit model of the match result (continued)
- Define two cut-off points, θaway < θdraw , to be estimated (note,
θhome = 1).
- Let j = (away, draw, home) be the three ordinal result outcomes.
- Let wi be the vector of observable predictors for the match (e.g.,
team form, importance of the match), and β is a vector of
coefficients.
- The model can be written as:
Pr(ri < j | wi ) = f (θj − w0i β ) (4)
- In words, the cumulative probability of the result being at least j
is determined by the function f , which is some function of
observables.
16 / 27Ordered logit or probit model of the match result (continued)
- For the logistic or logit model:
1
f (θj − w0i β ) = (5)
1 + exp(−(θj − w0i β ))
- For the probit, where Φ is the cumulative Normal distribution:
f (θj − w0i β ) = Φ(θj − w0i β ) − Φ(θj−1 − w0i β ) (6)
- Estimated using Maximum Likelihood in R or Stata using
standard regression packages (e.g., ologit, oprobit). See Stata
help or readings for how to interpret the regression outputs.
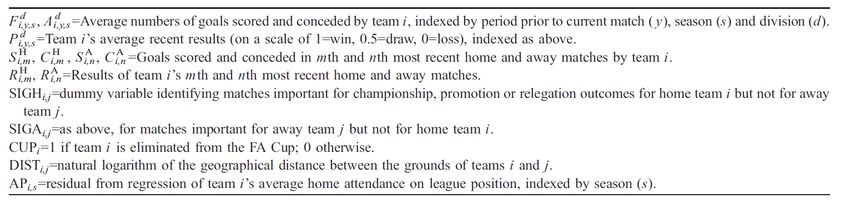
17 / 27“Regression models for forecasting goals and match results in
association football” (Goddard, 2005; International Journal of
Forecasting)
- Goddard compared the forecasting performance of the bivariate
Poisson Model and the ordered logit model for result outcomes
of the top 4 leagues of English football, 1992/3-2001/2.
- He used the same set of observable factors for both models:
Source: Goddard (2005)
18 / 27(continued)
- The models were estimated using the previous 15 seasons.
- The forecast results are compared using the pseudo-log
likelihood statistic.
- Model 1: bivariate Poisson, using lagged goals data; Model 2: bivariate Poisson
based on lagged results data. Model 3: ‘hybrid model’ ordered probit with
lagged goals covariates; Model 4: ordered probit with lagged results covariates.
Source: Goddard (2005) 19 / 27Ideas for simpler forecasting models, for football (or other sports)
- Linear probability model (LPM); ri = (0, 0.5, 1) but treat this as
though it is a continuous variable, and estimate using least
squares:
ri = w0i β + εi , E [εi | wi ] = 0. (7)
- The predicted values ri provide very rough probabilities of the
home team winning the match, though they may not be bounded
by 0 and 1, which makes interpretation tricky.
- Could simplify outcome variable further, and eliminate draws; 1
if the home (or away) team won, and 0 if not.
- Change the outcome variable and forecast quantities: hi , ai , ti ,
mi , and treat these as quasi-continuous measures; i.e., as if linear
regression is appropriate.
- Study a binary outcome variable (e.g., over/under 2.5 goals,
home team wins), and then estimate LPM or regular probit/logit
models).
20 / 27Explanatory variables
- Goddard (2005) provides a good range of variables that can be
constructed from just historical result and scoreline data.
- Elo ratings are commonly used to capture the time-varying
abilities of teams.
- These are constructed using historical data of all matches up to
the current one, and are a function of who played and beat who
in the league (history of football), weighting recent results more
highly.
- The ‘Elo prediction’, based on these ratings, has been shown to
have considerable predictive power in many sports, not just in
football.
21 / 27Elo rating and prediction
- There are variants which use scorelines and margins of victory,
but simply for results see versions: www.eloratings.net/ (go to
about page for calculation details); clubelo.com/; wiki
- See also Blackboard for a video on how to calculate ‘live’ Elo
rankings in Excel using historical results data (courtesy James
Reade).
- If Rh,i is the Elo ranking of the home team in a match and Ra,i the
rank of the away team, then the expected chance of the home
team winning is given by:
EElo [ri ] = 1/ 10−(Rh,i −Ra,i )/400 + 1 . (8)
- EElo [ri ] can be included in wi as potentially a powerful predictor.
22 / 27Elo rating example: teams in the first season of the Premier
League, 1992-2018
Oldham Coventry Nottm Forest Sheff Wed
QPR C Palace Man City Tottenham
Arsenal Everton Wimbledon Man Utd
1800
Blackburn Ipswich Aston Villa Southampton
Liverpool Leeds Middlesbro
Chelsea Sheff Utd Norwich
1600
Elo strength
1400
1200
1992 1993 1994 1995 1996 1997 1998 1999 2000 2001 2002 2003 2004 2005 2006 2007 2008 2009 2010 2011 2012 2013 2014 2015 2016 2017
Date
Source: James Reade)
23 / 27‘Crowd’ predictors of football matches
- A growing body of literature highlights the value of collective
judgements, often referred to as the ‘Wisdom of Crowds’, for
assessing the probability of future events
(e.g., Surowiecki, 2004; book: “Wisdom of crowds”).
- One example for football matches has used transfermarkt.de.
- Peeters (2018; International Journal of Forecasting) studies
whether the player valuations have predictive power for
international matches.
24 / 27‘Crowd’ predictors of football matches (continued)
- Peeters estimates a simple ordered probit model of the result
outcome.
- Explanatory variables are just the difference in the transfermarkt
valuations of the two teams’ selections, with controls for home
advantage (as some games are played on neutral ground) and the
different number of players in the selection (i.e., in some
matches there are differences in the size of the subs bench).
- He compares this with models which use differences in Elo
ratings or Fifa points instead of transfermarkt valuations.
- Forecasts using the crowd player valuations are more accurate
and imply sizeable monetary gains when applied to simple
betting strategies.
25 / 27Pre-match betting odds as predictors???
- To make timely forecasts we need predictors which are known
reasonably well in advance of an event beginning.
- Betting odds/prices are available well in advance of football
matches.
- Let pi be the implied probability of the home team winning from
betting odds.
- Suppose we estimate the simple regression model using least
squares:
ri = α + β pi + υi , E [υi | pi ] = 0. (9)
- What does it mean if βb 6= 1?
More on this in the next two lectures...
26 / 27Project reminders
- 5pm, 5 March: deadline to submit initial ideas to me, by e-mail,
for formative feedback.
- Office hours: 9.30-11.00 Mondays and Wednesdays — or
arrange an appointment.
27 / 27You can also read