Review of Sustainability Measures for Hoki (HOK 1) for 2019/20 - June 2019 - Fisheries New ...
←
→
Page content transcription
If your browser does not render page correctly, please read the page content below
Review of Sustainability Measures
for Hoki (HOK 1) for 2019/20
Fisheries New Zealand Discussion Paper No: 2019/06

ISBN No: 978-1-98-859478-1 (online)
ISSN No: 2624-0165 (online)

June 2019
Disclaimer
While every effort has been made to ensure the information in this publication is accurate, Fisheries
New Zealand does not accept any responsibility or liability for error of fact, omission, interpretation or
opinion that may be present, nor for the consequences of any decisions based on this information.

Requests for further copies should be directed to:

Publications Logistics Officer
Fisheries New Zealand
PO Box 2526
WELLINGTON 6140

Email: brand@mpi.govt.nz
Telephone: 0800 00 83 33
Facsimile: 04-894 0300

© Crown Copyright – Fisheries New Zealand
Contents                                                                      Page

1     Stock being reviewed                                                       1

2     Summary                                                                    1

3     Quota Management System                                                    2

4     Legal basis for managing fisheries in New Zealand                          2

5     Treaty of Waitangi Obligations                                             2
5.1   Input and participation of tangata whenua                                  2
5.2   Kaitiakitanga                                                              2

6     Relevant plans, strategies, statements and context                         2

7     Non-regulatory management measures                                         3

8     Current state of the stocks                                                3
8.1   Eastern stock                                                              4
8.2   Western stock                                                              4

9     Recent catch levels and trends                                             4

10    Projections of biomass                                                     5

11    Options – varying TAC and TACCs                                            6

12    Uncertainties and risks                                                    6

13    Environmental interactions                                                 6

14    Analysis of options                                                        7

15    Future work                                                                7

16    Questions for submitters on options for other sustainability measures      8

17    Deemed values                                                              8

18    Referenced reports                                                         8

19    How to get more information and have your say                              8

                                                  i
1 Stock being reviewed
Hoki (HOK 1)
Macruronus novaezelandiae
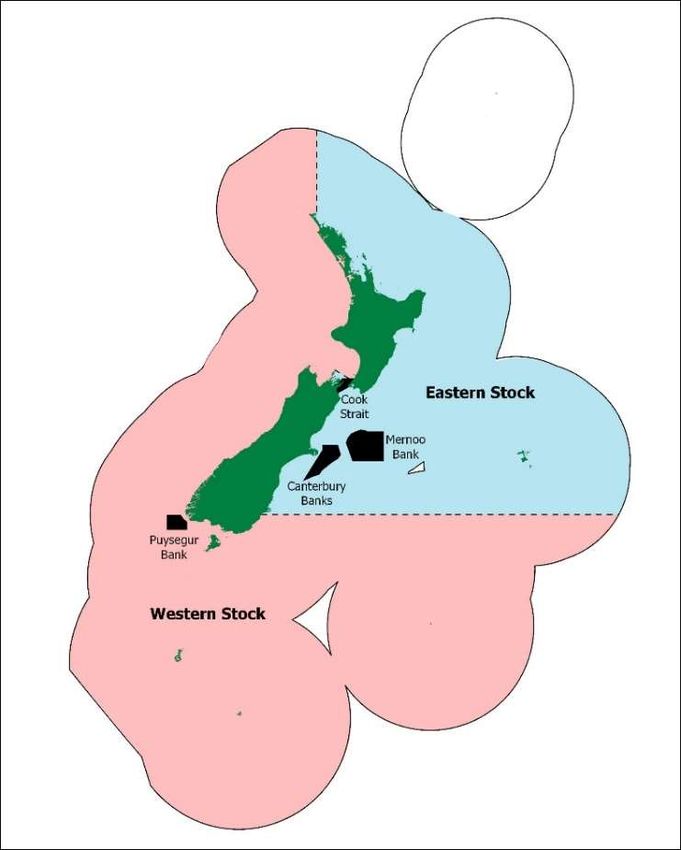
Figure 1: Quota Management Area (QMA) for HOK1 showing eastern and western sub-stock areas
(shown as HOK1E and HOK1W)
2 Summary
Hoki within the HOK 1 QMA is assessed annually and managed as two separate sub-stocks, eastern
and western, with a separate catch limit set for each through a non-regulatory catch split arrangement
(Figure 1, discussed in section 7 below).
The 2019 stock assessment for hoki estimates the biomass of the western stock to be at 56% B0 or as
low as 29% B0 (depending on the assumptions used to inform inputs to the stock assessment model).
29% B0 is below the lower end of the management target range of 35-50% B0 and indicates a potential
sustainability risk for the western stock. The eastern stock was estimated to be at either 66% B0 or
64% B0 and therefore, no sustainability risk has been identified for the eastern stock.
Fisheries New Zealand proposes two options to reduce the TAC and TACC for HOK 1:
Option 1: reduce the TAC from 151,540 to 131,340 tonnes (a 13% decrease), and the TACC from
150,000 to 130,000 tonnes.
Option 2: reduce the TAC from 151,540 to 121,340 tonnes (a 20% decrease), and the TACC from
150,000 to 120,000 tonnes.
Both options would retain the non-regulatory catch limit for the eastern stock and reduce the catch
limit for the western stock. Option 1 proposes to reduce the 90,000 tonne catch limit by 22% to 70,000
tonnes, and Option 2 proposes a 33% reduction to 60,000 tonnes for the western stock.
Fisheries New Zealand Review of sustainability measures October 2019: HOK 1 13 Quota Management System Hoki is managed through the Quota Management System with a 1 October to 30 September fishing year. For more information about the QMS go to https://www.mpi.govt.nz/law-and-policy/legal- overviews/fisheries/quota-management-system/. 4 Legal basis for managing fisheries in New Zealand The Fisheries Act 1996 provides the legal basis for managing fisheries in New Zealand, including the Minister’s responsibilities for setting and varying sustainability measures. See the separate document Overview of legislative requirements and other considerations on the Fisheries New Zealand sustainability consultation webpage (https://www.fisheries.govt.nz/news-and-resources/consultations/review- of-sustainability-measures-for-1-october-2019) for more information. 5 Treaty of Waitangi Obligations 5.1 Input and participation of tangata whenua Input and participation is provided for through discussions with relevant iwi at Iwi Fisheries Forums. Each Iwi Fisheries Forum has developed an Iwi Fisheries Forum Plan, which describes how the iwi in the Forum exercise kaitiakitanga over the fisheries of importance to them, and their objectives for the management of their interest in fisheries. Iwi Fisheries Forums may also be used as entities to consult iwi with an interest in a fishery. It is proposed that input and participation with relevant iwi on the proposals for HOK 1 is provided for during the period of consultation on these proposals. 5.2 Kaitiakitanga Hoki is identified as a taonga species in the Chatham Islands Forum Fisheries Plan @ 44°, Mai i Nga Kuri a Wharei ki Tihirau Iwi Fisheries Plan, Te Taihauauru Iwi Forum Fisheries Plan, Te Hiku o Te Ika Iwi Fisheries Forum Fisheries Management Plan, and Te Waka a Māui me Ōna Toka Iwi Forum Fisheries Plan. Fisheries New Zealand considers that all management options presented in this consultation paper are consistent with the relevant objectives of the Iwi Forum Fisheries Plans. 6 Relevant plans, strategies, statements and context Hoki in HOK 1 is managed as a Tier 1 species within the National Fisheries Plan for Deepwater and Middle-depths Fisheries. A species-specific chapter of the National Deepwater Plan for hoki (Part 1B) was completed in 2010. The National Deepwater Plan sets out a series of Management Objectives for deepwater fisheries, the most relevant to the proposals for HOK 1 being: Management Objective 1: Ensure the deepwater and middle-depths fisheries resources are managed so as to provide for the needs of future generations. Management Objective 2: Ensure excellence in the management of New Zealand’s deepwater and middle-depth fisheries, so they are consistent with, or exceed, international best practice. Management Objective 4: Ensure deepwater and middle-depth fish stocks and key bycatch fish stocks are managed to an agreed harvest strategy or reference points. 2 Review of sustainability measures October 2019: HOK 1 Fisheries New Zealand
7 Non-regulatory management measures
A number of non-regulatory measures are in place for hoki, including an east-west catch split
arrangement and Hoki Operational Procedures. The HOK 1 TACC is divided between the eastern and
western stocks each year via a non-regulatory catch split arrangement that has been agreed between
Fisheries New Zealand and quota holders. Each catch limit is varied in response to the current
estimate of stock status, and projected impacts of catch levels on each stock. This was first
implemented by the fishing industry in 2001, and is now formally administered through FishServe and
endorsed by the Minister of Fisheries.
FishServe reports to Fisheries New Zealand on the east-west split arrangement. Adherence to the
catch split arrangement is monitored on an ongoing basis and reported on annually by Fisheries New
Zealand.
In response to concerns regarding declining catch rates in the west coast hoki fishery, hoki quota
owners have shelved 20,000 tonnes (plus any carry forward western stock ACE) for the 2018/19
fishing year. As of 31 May 2019, this has resulted in over 30,000 tonnes of ACE being transferred to a
holding account that will not be fished in the 2018/19 fishing year.
Hoki Operational Procedures are administered by the Deepwater Group Ltd (DWG), which represents
93% of HOK 1 quota owners. These procedures cover Hoki Management Areas (HMAs) and Hoki
Seasonal Spawn Areas (HSSAs). HMAs are intended to reduce fishing pressure on juvenile fish (fish
smaller than 55cm) within four areas where there is relatively high juvenile abundance. HMAs are in
place for the Narrows Basin in Cook Strait, Canterbury Banks, Mernoo Bank and Puysegur. Within
HMAs, vessels larger than 28m are not permitted to target hoki. From the 2018/19 fishing year,
HSSAs were added to the Operational Procedures to reduce fishing pressure on spawning fish. These
include short-term closures to hoki targeting by all vessels in the main spawning areas:
West Coast of the South Island within 25 nautical miles of the coast, from 18 to 24 July (note
that vessels larger than 46 metres are already excluded from this area permanently)
West Coast outside of 25 nautical miles from the coast, shallower than 800 metres, from 25
July to 31 July
the entire Cook Strait fishery, from 1 to 7 August
within designated areas in the Pegasus Canyon, from 1 to 7 September.
8 Current state of the stocks
Hoki is a reasonably fast-growing species widely distributed throughout New Zealand waters, most
commonly in depths between 200 metres and 600 metres. Hoki reach a maximum age of around 25
years, with females growing to lengths of around 130 cm and males to 115 cm.
The hoki stocks are assessed every year and the TAC and TACC for HOK 1 are set based upon the
status of the stock in relation to the hoki harvest strategy, as set out in the species-specific chapter of
the National Deepwater Plan for hoki (Part 1B) and described in
Table 1 below.
Table 1: Hoki reference points and the associated management response
Harvest strategy components Management response
Management target range of Stock permitted to fluctuate within this management target to an
35 - 50% B0 acceptable level
Soft limit of 20% B0 A formal time constrained rebuilding plan should be implemented if this
limit is reached
Hard limit of 10% B0
The limit below which fisheries should be considered for closure
Rebuild strategy Catch limit set so that fishery will deliver half the rate of rebuild that would
occur in the absence of fishing considered for closure
Fisheries New Zealand Review of sustainability measures October 2019: HOK 1 3The 2019 stock assessment for hoki incorporates new data from two fisheries-independent surveys, commercial fisheries, and biological information collected by Fisheries New Zealand observers. In response to concerns regarding the conflict between the high stock status estimated in 2018 by the stock assessment model and the low catch rates observed by the commercial fleet during that period, particularly in the West Coast South Island fishery, the stock assessment model has been explored in detail to ensure its accuracy. The Deepwater Fisheries Assessment Working Group1 agreed on three base case models for this year’s assessment: a combined run that is the same as the 2018 model; and two model runs that focused on fitting either the eastern or western biomass data better (eastern stock-focused or western- stock focused models). The combined model was considered to overestimate stock status, while the two-stock model (particularly for the western stock) may underestimate stock status. 8.1 Eastern stock For the eastern stock, the 2019 stock assessment estimated stock status to be at 66% B0 (using the combined model) or 64% B0 (using the eastern stock-focused model). The Deepwater Fisheries Assessment Working Group agreed the stock is Virtually Certain (>99% probability) to be at or above the lower end of the management target range (35%) and Likely (>60% probability) to be at or above the upper end of the management target range (50%). 8.2 Western stock For the western stock, the 2019 stock assessment estimated stock status to be at 56% B0 (using the combined model) or 29% B0 (using the western stock-focused model). The Deepwater Fisheries Assessment Working Group considered it is About As Likely As Not (40-60% probability) to be at or above the lower end of the target range. 9 Recent catch levels and trends The largest fishery for HOK 1 is the spawning west coast South Island fishery, which operates seasonally from May-September. In 2017/18, 41% of overall HOK 1 catch was taken from the West Coast South Island fishery which represented 77% of the total catch from the western stock. The Sub- Antarctic is the second most important western stock fishery (11% of HOK 1 catch in 2017/18). Catch of the eastern stock is primarily taken on the Chatham Rise (28% HOK 1 catch in 2017/18), with a smaller amount taken in spawning fisheries in the Cook Strait and off the east coast of the South Island. Nominal allowances are made for both recreational and customary fishing for hoki. The TACC has been under-caught in HOK 1 for the past three fishing years (Figure 2, below), as a result of reduced catch from the West Coast South Island spawning fishery. Catch from the sub- Antarctic has increased, but the total catch from the western stock has been below the catch limit for the last 3 years. The eastern stock catch limit has continued to be fully caught. The fishing industry agreed to shelve 20,000 tonnes (plus any carry-forward) of ACE from the western stock for the 2018/19 fishing year, as a conservative response to the lower than usual catch rates seen in the West Coast South Island in the previous three years. This means that the total western catch in the 2018/19 fishing year will likely be no more than 70,000 tonnes. 1 The Deepwater Fisheries Assessment Working Group is an open forum primarily attended by representatives from Fisheries New Zealand, research providers, the fishing industry, independent fisheries scientists, and any interest party who agrees to the Terms of Reference. 4 Review of sustainability measures October 2019: HOK 1 Fisheries New Zealand
HOK 1 total catch by fishing year Western
Eastern
250,000 TACC
200,000
150,000
100,000
50,000
-
Figure 2: Estimated total catch (in tonnes) of hoki by fishing year, for the
eastern and western stocks
10 Projections of biomass
The combined and stock-focused models were used to project biomass forward for 5 years under a
range of catch scenarios. The projections assume recruitment based on data from 2008-2017 which
has been slightly above average.
Projections with catch at the level of the current TACC and sub-area catch limits indicate that the
eastern stock is expected to increase slowly under both models. These projections estimate that the
western stock will increase under the combined model, but decline under the western-stock focused
model.
Table 2 shows the estimated stock status and probabilities in relation to reference points for the status
quo and proposed options. The eastern stock projections are the same across options, since no
changes are proposed to catch levels for this stock.
Table 2: Projected HOK 1 stock status under the proposed options
2019 Estimated 2024 Estimated Probability of Probability of
Stock Status Stock status being below being below the
(% B0) (% B0) 35% B0 in 2024 Soft Limit in 2024
Current TACC (and catch split)
Combined Model – Eastern stock 67 74 1% 0%
Eastern stock-focused model 64 67 2% 0%
Combined Model – Western stock 56 58 7% 0%
Western stock-focused model 29 24 82% 32%
Option 1 (based on 2017/18 catch levels)
Combined Model – Western stock 56 62 3% 0%
Western stock-focused model 29 30 67% 13%
Option 2
Combined Model – Western stock 56 65 2% 0%
Western stock-focused model 29 35 50% 4%
Fisheries New Zealand Review of sustainability measures October 2019: HOK 1 511 Options – varying TAC and TACCs
Table 3 sets out the options to vary TAC and TACC, along with the allowances for the western and
eastern stocks of HOK 1.
Table 3: Proposed TAC, TACC and allowances in tonnes for HOK 1 from 1 October 2019
Non-regulatory catch split arrangement Allowances (tonnes)
Other
Eastern sources of
Western Customary Recrea-
Option TAC TACC stock fishing
stock limit Māori tional
limit related
mortality
Current
151,540 150,000 60,000 90,000 20 20 1,500
status
131,340 70,000
Option 1 130,000 60,000 20 20 1,300
(13%) (22%)
121,340 60,000
Option 2 120,000 60,000 20 20 1,200
(20%) (33%)
No change is proposed to the customary Māori or recreational allowances under either option. Both
options would retain the allowance for other sources of fishing-related mortality at 1% of the TACC.
12 Uncertainties and risks
The major sources of uncertainty relate to the data inputs and assumptions of the stock assessment
model, including stock structure and migration patterns, and conflicting signals between biomass
indices and age composition data.
In recent years, there have been warming events in the Tasman Sea, and potentially other
environmental changes, that may be impacting on the distribution of hoki or other biological
parameters that impact the interpretation of available data on hoki.
13 Environmental interactions
Key environmental interactions with the fishery that must be taken into account are:
Marine mammals
Fur seals are sometimes taken in hoki target tows, with the majority of captures occurring in the WCSI
and Cook Strait fisheries. Over the five fishing years to 2017/18, an average of 39 fur seal captures
were observed in hoki fisheries annually with an average of 28% of tows observed.
Fish bycatch
Hoki, hake and ling accounted for 91% of observed fish catch from hoki, hake and ling target fishing.
The remaining catch was primarily silver warehou, javelinfish, rattails, and spiny dogfish.
Seabirds
The hoki trawl fishery captures seabirds, with an average of 98 seabird captures observed in hoki
fisheries over the last five years and an average of 28% of tows observed.
The 2019 seabird risk assessment estimates that hoki fishing poses a risk for three species; Salvin’s
albatross (hoki fishing contributes 16% of risk), Southern Buller’s albatross (hoki fishing contributes
31% of risk), and Westland petrel (hoki fishing contributes 11% of risk).
Benthic impacts
Roughly 50% of hoki is caught using bottom trawling. In 2016/17, 2.2% of the fishable depths
(shallower than 1600 metres and open to bottom trawling) in the New Zealand EEZ was contacted by
6 Review of sustainability measures October 2019: HOK 1 Fisheries New Zealandbottom trawl fishing for hoki, hake, ling, and silver and white warehou. Fisheries New Zealand monitors the trawl footprint of this fishery annually. 14 Analysis of options Option 1 would decrease the TACC by 13% to 130,000 tonnes, implemented through a 20,000 tonne (22%) reduction in the western stock catch limit. Fisheries New Zealand estimates the potential loss in economic value to be approximately $33.8 million under Option 1 (compared to revenue if the current TACC were fully caught). This is based on the export value of frozen headed, and gutted export state, which is the most common processed state for fish from the West Coast South Island fishery. Note that Option 1 parallels the current non- regulatory shelving arrangement, and therefore the actual economic impact is likely negligible. Option 1 is likely to result in a minimal reduction in fishing effort as it sets the catch limit at a similar level to current catch, and is considered unlikely to result in any additional effects on protected species, fish bycatch, or the benthic environment. Five-year projections for this option estimate the western stock will either increase from 56% B0 to 62% B0 (combined model), or remain at around 29-30% B0 (western stock-focused model). Projections using the western stock-focused model estimate a 13% probability of the stock being below the Soft Limit in 2024. Option 2 would decrease the TACC by 20% to 120,000 tonnes, implemented through a 30,000 tonne (30%) reduction in the western stock catch limit. Fisheries New Zealand estimates the loss in potential economic value to be approximately $47 million under Option 2. This is based on the export value of frozen headed, and gutted export state, which is the most common processed state for fish from the West Coast South Island. Given the current shelving arrangements, the potential economic loss is likely to be closer to $17 million under this option. Option 2 is likely to result in a reduction in fishing effort on the west coast and is therefore considered unlikely to result in any additional effects on protected species, fish bycatch, or the benthic environment. Five-year projections for this option estimate the western stock will either increase from 56% B0 to 62% B0 (combined model) or from 29% B0 to 35% B0 (western stock-focused model) Projections using the western stock-focused model estimate a 4% probability of the stock being below the Soft Limit in 2024. Neither option proposes to change the eastern stock catch limit, on the basis that the stock assessment estimates the stock to be above the management target range. 15 Future work Fisheries New Zealand has a range of research underway to further inform the 2020 stock assessment of hoki. This includes further investigation of the structure and assumptions of the stock assessment model prior to the 2020 stock assessment, and a number of research projects looking at environmental change and potential impacts on fisheries and stock assessments. Fisheries New Zealand Review of sustainability measures October 2019: HOK 1 7
16 Questions for submitters on options for other sustainability
measures
Which option do you support for revising the TAC, TACC and allowances? Why?
If you do not support either of the options listed, what alternative should be considered? Why?
Please provide detailed, verifiable information and rationale to support your views.
17 Deemed values
The purpose of deemed values are to provide incentives for commercial fishers to balance the catch of
QMS species with ACE within each fishing year. The deemed value rate for HOK 1 was last reviewed
for 1 October 2015. Fisheries New Zealand considers it is not necessary to review hoki deemed
values at this point.
18 Referenced reports
Fisheries Assessment Plenary May 2019: https://www.fisheries.govt.nz/news-and-resources/science-
and-research/fisheries-research/
Hoki Operational Procedure for 2018/19 fishing year: https://deepwatergroup.org/wp-
content/uploads/2019/02/Hoki-OP-V18.pdf
National Fisheries Plan for Deepwater and Middle-Depth Fisheries 2019
National Fisheries Plan for hoki: https://www.mpi.govt.nz/dmsdocument/3974-national-fisheries-plan-
for-deepwater-and-middle-depth-fisheries-part-1b-hoki-fishery-chapter
19 How to get more information and have your say
Fisheries New Zealand invites you to make a submission on the proposals set out in this discussion
document. We must receive your submission by 5pm on 26 July 2019. Please see the Fisheries New
Zealand sustainability consultation webpage (https://www.fisheries.govt.nz/news-and-
resources/consultations/review-of-sustainability-measures-for-1-october-2019) for related information,
a helpful submissions template, and information on how to submit your feedback. If you cannot access
the webpage or require hard copies of documents or any other information, please email
FMSubmissions@mpi.govt.nz.
8 Review of sustainability measures October 2019: HOK 1 Fisheries New ZealandYou can also read