Optimization of the system of management of stores of the car service with the help of imitation simulation
←
→
Page content transcription
If your browser does not render page correctly, please read the page content below
MATEC Web of Conferences 334, 01022 (2021)                            https://doi.org/10.1051/matecconf/202133401022
ITMTS 2020

      Optimization of the system of management of
      stores of the car service with the help of imitation
      simulation
      Vitaliy Bugrimov1, and Vladimir Sarbaev1*
      1Moscow    Polytechnic University, 107023 Moscow, Russia

                    Abstract. The purpose of simulation is described, the theoretical
                    foundations of the simulation model of inventory management at the service
                    station with its scheme are given. The criterial function of delays, which is
                    the main one in the management of stocks at the service station, is given, the
                    analysis of the influence of the controlled parameters of the model on the
                    criterial function is carried out. The algorithm of search optimization with
                    integration into the simulation model is resulted and optimal parameters of
                    the stock level.

      1 Introduction
      Currently, in accordance with the supplier's (manufacturer's) interest in the implementation
      to ensure its plans for the production of spare parts, the car service stations (CSS) must
      maintain significant stocks of spare parts in their warehouses, as shown by the research of
      Rustenburg and van Houtum [1]. At the same time, the technical necessity and economic
      feasibility of keeping such a quantity of stocks in the warehouse have not been studied and
      are not substantiated. Replenishment of the warehouse occurs usually every two weeks and,
      due to the lower consumption of spare parts of car service stations (CSS), rather than from
      the store that sells them, simultaneously with the greater responsibility of the CSS for their
      availability, since the lack of spare parts calls into question the efficiency of the operation
      station, which is reflected in the studies of Cheng and Tsao [2], as well as Martin [3]. For
      CSS, the definition of liquid spare parts and their optimal reserves is of particular importance,
      as noted in the studies Cheng and Tsao [2].
           As it is known from Graves’s and Willems’s research [4], the size of the stock, as one of
      the characteristics of the inventory management system, is influenced by a number of factors:
      the size and frequency of supplies, the number of cars operated in the region, the conditions
      and the intensity of their operation, and much more. A prerequisite for scientifically based
      inventory management is the scientifically based forecasting of the flow and the needs of
      spare parts for each particular car service taking into account objectively acting factors, as
      described in the studies of Wenbin Wang, Aris A. Syntetos [5], and Eaves with Kingsman
      [6].

      * Corresponding author: visarbaev@gmail.com

© The Authors, published by EDP Sciences. This is an open access article distributed under the terms of the Creative Commons
Attribution License 4.0 (http://creativecommons.org/licenses/by/4.0/).
MATEC Web of Conferences 334, 01022 (2021) https://doi.org/10.1051/matecconf/202133401022
ITMTS 2020
With the existing study of the issue of forecasting the use of spare parts, the influence of
the factors affecting the size of stocks in the service stations serving the cars of the region is
not sufficiently taken into account the research work of C.Ronzoni, A.Ferrara, and A.Grassi
[7]. Existing electronic enterprise management systems, in particular "1C: Enterprise", allow
you to make predictions based on the simplest models.
In view of the foregoing, the purpose of the work was determined: the development of an
effective method, taking into account the interaction of factors with the consumption of spare
parts, and the development of a model taking into account this influence.
2 Material and methods
Setting research objectives is to develop:
• simulation model of inventory management
• description and analysis of the effect on the criterial function of the monitored
parameters of the model;
• Integration into the model of the algorithm of search optimization;
• determination of the level of optimal reserves.
The relevance of the study is determined by the need to increase the competitiveness of
the service center, in which the optimization of warehouse costs, the reduction of the
"necrotic capital" in the form of illiquid stocks of spare parts becomes especially important.
3 Theory and calculation
Due to the influence of many factors, optimization of inventory management is possible when
analyzing the impact on its parameters through simulation.
To construct a simulation model of inventory management, one of the main tasks is
modeling the input flow of applications for individual parts and components that must
correspond with the results obtained on the basis of a statistical analysis of the functioning
of real repair service stations, according to a study by Dieter [8].
Currently, the process of simulating the flow of requirements for spare parts is represented
by a moving average model according to the dealer center "Rolf Center". For example, the
stuck part of the bumper amplifier (REINFORCEMENT, FR BUMPER) is selected.
It is reduced to a single parametric form, which forms a generalized model of inventory
management.
List of managed parameters:
• OctMinZ - the minimum amount of stocks for the formation of an order for the supply
of spare parts;
• OctMaxZ - the maximum amount of stocks for the formation of an order for the supply
of spare parts;
• Tzak is a variable that specifies the random time for the delivery of spare parts (the
initial distribution is uniform over the interval);
• T - planning horizon of the inventory management system, T = 365 days;
• μ - intensity of requests for a particular part μ = 1.2 units / order (order for maintenance
or repair);
• s - the price of holding one position per unit of time s = 0.5 rubles / day;
• g - cost of delivery of the party g = 850 rub;
• h - penalty for missing parts h = 400 rubles / day (as a penalty, costs are associated with
the lack of parts in the warehouse and the need for emergency delivery);
2MATEC Web of Conferences 334, 01022 (2021) https://doi.org/10.1051/matecconf/202133401022
ITMTS 2020
The enlarged flowchart of the algorithm of the single-product inventory management
system subprogram (Fig. 1) contains the steps of generating a model range of request
volumes, making an order planning decision, monitoring the number of balances in the
warehouse, and others.
A series of experiments was performed to estimate the character of the distribution of the
criterial function at the values of the parameters:
• Ras - the need for spare parts (μ = 1.2 units / order, the actual consumption per day is
the result of multiplying μ by the number of technical impacts per day);
• Pri - time series of receipt of lots;
• Oct - the rest of spare parts in a warehouse;
• SigZak ~ 0 - a sign of the application for supply;
• t - 1 ÷ Tmod = 365 days - model time, etc.
In the process of modeling, the main result is the construction of a selective function of a
random temporary volume of stocks for the selected nomenclature of spare parts (Fig. 2).
Order execution
Start
indicator - inactive
SigZak=0. t=0 Oct(t)0
Setting the order
Initial Stock Level execution indicator
yes
Creation - Oct SigZak = 1
The increasing of stock
of Oct (t) by Pri (t) Transfer of stock size
Forming the array of Oct (t) to t + 1
orders - Pri
Resetting the order
execution indicator
SigZak = 0 yes
tMATEC Web of Conferences 334, 01022 (2021) https://doi.org/10.1051/matecconf/202133401022
ITMTS 2020
VR=ParmW(8); % 8 - Type of time series consumption
mu=ParmW(9); % 9 - Intensity of requests
% __________ Formation of working arrays ___________
%Ras=rrr;
if VR==1 % Parts consumption
Ras=binornd(10,mu,1,Tmod);
elseif VR==2
Ras=geornd(mu,1,Tmod);
else
ParmVR=[Tmod;1;1];
Ras=SPf_ARI(ParmVR); % The need for spare parts
end
Pri=zeros(1,Tmod); % Time series of receipt of lots
Oct=zeros(1,Tmod); Oct(1)=ZMax; % The rest of spare parts in a warehouse
% _____________________________________________________
SigZak=0; % A sign of the application for supply
for t=1:1:Tmod
if Pri(t)>0
Oct(t)=Oct(t)+Pri(t); % Total balance at the beginning of the day
SigZak=0;
end
Oct(t+1)=Oct(t)-Ras(t); % Balance at the end of the day
if Oct(t+1)0
Fcrit=Fcrit+Oct(t)*s;
else
Fcrit=Fcrit-Oct(t)*h;
end
if Pri(t)>0
Fcrit=Fcrit+g;
end
end
In this case, the vector of parameters should be formed:
• Parm=[365, % 1 Tmod - Planning horizon
5, % 2 Zmin - Minimum amount of stocks
20, % 3 Zmax - Maximum amount of stocks
3, % 4 Tzak - Time for the delivery of spare parts
0.5, % 5 s - The price of holding one position per unit of time
850, % 6 g - Cost of delivery of the party
400, % 7 h - Penalty for missing parts
2, % 8 VR - Type of time series consumption
1.2]; % 9 mu - Intensity of requests
• A one-time program call is made.
[MFcritW, RasO, OctO, PriO]=UZf(Parm);
4MATEC Web of Conferences 334, 01022 (2021) https://doi.org/10.1051/matecconf/202133401022
ITMTS 2020
OctO=OctO(1, 1:Tmod);
PriO=PriO(1, 1:Tmod);
t=1:1:Tmod; plot(t, [RasO; OctO; PriO]);
A two-tier model represents a single-product model with instantly executed orders for the
supply of any volumes. In the case of lack of details, applications are also taken into account.
At the same time, when the total stock drops to OctMinZ, then the Q-volume arrives instantly,
and the stock becomes OctMaxZ. Total costs represent the amount of costs for storage,
delivery and deficit.
Fig. 2. Selective trajectory for a model without a deficit.
In this case, the average costs at the planning horizon can be represented in the form
1� T T
�
, y ) f1 ( y (t ) ≤ t < T ) = � s ∑ yt χ ( yt ≥ 0 ) + h∑ yt χ ( yt < 0 ) + gn (T ) � ,
f1 (T= (1)
T � t =1 t =1 �
where y (t) represents the level of stocks; χ(А) is the indicator function of the set А
(y(t)>0⇒χ(y(t)>0)=1; y(t)0)=0); s, h, g are the parameters of the model
presented above.
The optimization task is to find the values of the lower OctMinZ and the upper OctMaxZ
levels, which deliver a minimum of average costs.
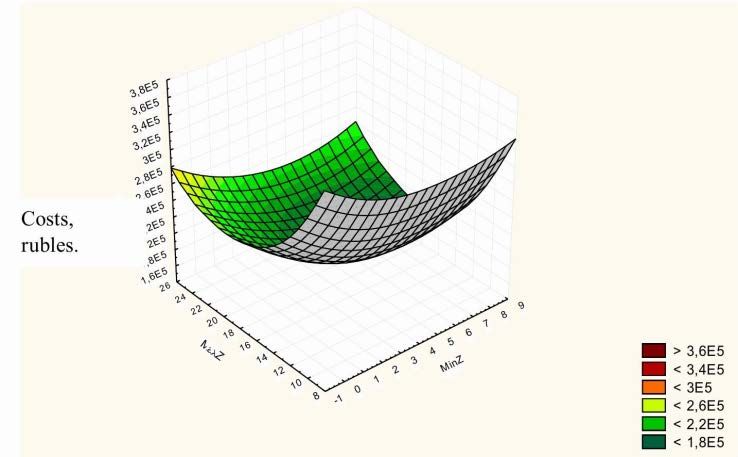
The analysis of the influence of the controlled parameters of the model on the criterion
cost function (Fig. 3) is carried out to take into account the value of the parameters at other
service stations (Costs are per year).
Fig. 3. Influence of the order execution time on costs F (Tzak).
5MATEC Web of Conferences 334, 01022 (2021) https://doi.org/10.1051/matecconf/202133401022
ITMTS 2020
The decision of the problems of the analysis of the behavior of the inventory management
system naturally goes into the formulation of optimization tasks by various parameters
(maximum delivery volume, order point and others). In this regard, we can not limit ourselves
to simulation simulation. It is necessary to use optimization methods, for example, search. In
this regard, it is proposed to implement the integration of the simulation model with the
algorithms of stochastic approximation. In general, the optimization block solves the
problems of a directed enumeration of the model parameters, and the simulation model is
used to form the values of the optimization criterion by which the search is realized (Fig. 4).
The purpose of the optimization procedure is to improve the value of the criterion function
by selecting the values of the controlled parameters. The use of precise optimization methods
is inexpedient due to the impossibility of excluding a random component when calculating
the criterion from a selective trajectory of the inventory management process.
To perform the optimization procedure, its algorithm is developed with integration into
the model (Fig. 5).
Fig. 4. Optimization by stock size level on stock.
Interface
Data
Imitation
model Algorithm of search
optimization
block for calculating
the optimality
criterion Optimization Block
Fig. 5. Integration of the simulation model and algorithm of search optimization.
6MATEC Web of Conferences 334, 01022 (2021) https://doi.org/10.1051/matecconf/202133401022
ITMTS 2020
Within inventory management tasks all controllable parameters are combined into a
single parameter vector X = ( X 1k ,..., X Nk ) , and a discrete increment embodiment, the
parameter value at each step is determined by the step number is given study Li [9], i.e.
k +1 k
X = X + γk S(X k ) , (2)
In this case, for the increment step γ K , must be done the follow conditions
∞ ∞
∑γ
k =1
k = ∞; ∑γ
k =1
2
л < ∞; γ k > 0; lim k →∞ = 0 , (3)
Vector - column S ( X k ) = ( S1 ,..., S N ) defines the direction of search based on the
analysis of the local area of the studied parameter point. Within the framework of the
simulation model algorithm, it is possible to consider different variants of the run, i.e. make
a decision to change parameters based on one or more runs of the model on the same
parameters. The more runs, the higher the accuracy of the criterion evaluation, the smaller,
the lower. However, it is shown that the Robbins-Monroe stochastic approximation algorithm
ensures convergence even for sufficiently large variance estimates, which corresponds to
running the inventory management model on only one segment of the planning horizon.
For sufficiently large variances, it is proposed to use the sign algorithm, in which the
parameter change is realized on the basis of a symmetric plan without a central point
T
[X + c I , X
∏= n n 1 n − cn I1 , . . . X n + cn I M , X n − cn I M ] . (4)
and the transition is carried out on the basis of the increment sign:
X k +1 = X k + ak ⋅ sign(∆Yk ( сk )) . (5)
In general, to analyze the convergence of the algorithm, we use the Lyapunov function
(∀x V(x)≥ 0; V(x*)=0), for which it is shown Poznyak [10, 11] that the condition k→∞ ⇒
MV(x)→0 holds if the relation ∇V ( x ') − ∇V ( x '') ≤ L ⋅ x '− x '' and the distribution S ( x )
depend only on k and x k , and the components are independent in this case. There are a number
of other conditions, but they are quite rigid in nature purely theoretically, and in practical
applications and in our case, the determination of the criterion function of the inventory
management system is being carried out.
Thus, under the above conditions, we can speak of the convergence of the sequence X k to
the extremal one with probability 1.
When you run the algorithm, the increment step sequence {a k } and the discretization of
the local neighborhood of the point {c k } under study can have a fairly wide range of
dependencies. It is proposed to use power-law dependencies:
a0 c0
=ak = ; ck , (6)
k ap
k cp
In order for these sequences to ensure convergence (that is, they satisfy the convergence
conditions [7]), they must satisfy the constraints
1³ap > 0.75 and ap − 0.5 > cp > 1 − ap , (7)
In the framework of the conducted studies on estimating the convergence rate of the
developed Robbins-Monroe algorithm, we used the extension of a quadratic function to the
multidimensional case:
7MATEC Web of Conferences 334, 01022 (2021) https://doi.org/10.1051/matecconf/202133401022
ITMTS 2020
N
V ( x) = ∑ xi2 , (8)
i =1
and also taking into account the asymmetry of the quadratic form.
In modeling, it was assumed that the generation of selective trajectories of the inventory
management process began from the same initial state on independent random sequences,
which makes the components S ( x) independent.
In general, we can say that any finite number of terms of the series does not change its
convergence. The analysis showed that for initial values far from the maximum, the rate of
convergence at the initial stage of the algorithm is small enough. Therefore, in the initial
phase it is suggested to use increased steps or in general a constant.
Fig. 6. Carrying out the Kieffer-Wolfowitz procedure in the task of optimizing the inventory
management system for two parameters (Zmax and Zmin).
The studies carried out showed rather rapid convergence (Fig. 6). As a result, the
developed program is included in the complex of analysis and optimization of the inventory
management system.
4 Results
As a result of the conducted researches the model of definition of levels of storage of stocks
in a warehouse with procedure of their optimization is developed.
5 Discussion
The developed model makes it possible to optimize the volume of warehouse stocks by the
criterion of minimizing the costs of inventory management. This model was used at the
official dealer center Rolf and allowed to reduce the cost of managing the warehouse by 2.2
million rubles a year by maintaining the optimal level of reserves.
6 Conclusion
Studies using simulation modelling will make it possible to test how the system behaves
under various conditions, such as a deficit of parts in a warehouse, or to determine the
probability of producing excess stock.
8MATEC Web of Conferences 334, 01022 (2021) https://doi.org/10.1051/matecconf/202133401022
ITMTS 2020
References
1. W.D. Rustenburg, G.J. van Houtum, W.H.M. Zijm, Spare parts management for
technical systems: resupply of spare parts under limited budgets. IIE Transactions
(Institute of Industrial Engineers), 32 (10), pages 1013-1026 (2000)
2. Y.-H. Cheng, H.-L. Tsao, Rolling stock maintenance strategy selection, spares parts'
estimation, and replacements' interval calculation. International Journal of Production
Economics, 128 (1), Pages 404-412 (2010)
3. H. Martin, A.A. Syntetos, A. Parodi, Y.E. Polychronakis, L. Pintelon, Integrating the
spare parts supply chain: an inter-disciplinary account. Journal of Manufacturing
Technology Management, 21 (2), Pages 226-245 (2010)
4. S.C. Graves, and S.P. Willems, Strategic inventory placement in supply chains:
nonstationary demand. Manufacturing & service operations management, 10, Pages
278–287 (2008)
5. Wang Wenbin, A. Aris, Syntetos. Spare parts demand: Linking forecasting to
equipment maintenance. Original research article. Transportation Research Part E:
Logistics and Transportation Review, 47 (6), Pages 1194-1209 (2011)
6. A. Eaves, and B.G Kingsman, Forecasting for ordering and stock holding of spare
parts. Journal of the Operational Research Society, 55, Pages 431–437 (2004)
7. C. Ronzoni, A Ferrara, A. Grassi, A. Stochastic, Methodology for the Optimal
Management of Infrequent Demand Spare Parts in the Automotive Industry. Original
research article. IFAC-PapersOnLine, 48 (3), Pages 1405-1410 (2015)
8. A. Dieter, K. Pickard, B. Bertsche, Periodic renewal of spare parts using Weibull.
Quality and Reliability Engineering International, 26 (3), Pages 193-198 (2010)
9. S. Li, Z.Z. Li, Spare parts allocation by improved genetic algorithm and Monte Carlo
simulation. International Journal of Systems Science, 43 (6), Pages 997-1006 (2012)
10. A. Poznyak, Advanced Mathematical Tools for Automatic Control Engineers, 1,
Deterministic Technique, Elsevier, New York, 803 p. (2008)
11. A. Poznyak, Advanced Mathematical Tools for Automatic Control Engineers,
Stochastic Tools, 2, Elsevier, New York, 568 p. (2009)
9You can also read