HTFP2D: An efficient transform framework for power primary drawing - IOPscience
←
→
Page content transcription
If your browser does not render page correctly, please read the page content below

Journal of Physics: Conference Series

PAPER • OPEN ACCESS

HTFP2D: An efficient transform framework for power primary drawing
To cite this article: Liang Hongbo et al 2021 J. Phys.: Conf. Ser. 1861 012090

View the article online for updates and enhancements.

                               This content was downloaded from IP address 46.4.80.155 on 09/09/2021 at 21:38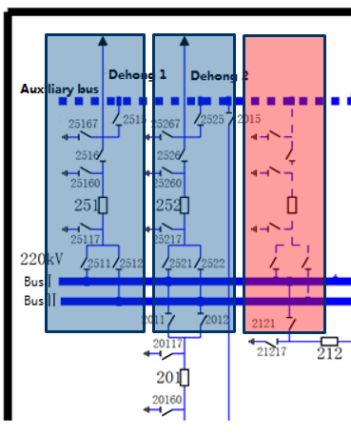
IWAACE 2021                                                                                                     IOP Publishing
Journal of Physics: Conference Series                         1861 (2021) 012090          doi:10.1088/1742-6596/1861/1/012090

HTFP2D:An efficient transform framework for power
primary drawing

                     Liang Hongbo1, Wang zhanfeng2,*, Chen Xiaoting3
                     1.
                         Yunnan Electric Power Dispatching Dontrol Center, Kunming, 650000, China;
                     2.
                      School of Computer Science and Engineering, Southeast University, Nanjing, 211189,
                     China;
                     3.
                         Nanjing Golden-water Sybuild Info-tech Co., Ltd, Nanjing, 210036, China.
                     ∗
                      Corresponding author, E-mail: 101101789@seu.edu.cn

                     Abstract: Power system needs not only graphics files, but also model files to realize mapping
                     and association between power equipment and drawings. Drawing files are often composed of
                     hundreds of graphic elements, which need to be transformed into structured model files through
                     identification. In this paper, a hybrid transformation framework of primary power drawing
                     (htfp2d) is proposed. The method of text and graphics recognition is integrated. Through the
                     identification of key elements, the model file of a drawing is constructed and the drawing is
                     redrawn. Experiments show that the method can effectively identify various drawings and
                     promote the inheritance and use of historical drawing resources.

1. Introduction
In the power system, there are a large number of drawing files, which can be divided into types,
graphic files and model based graphic files. Graphic file refers to the document that only represents
the connection relationship and equipment number of power equipment from the perspective of image;
the model based graphic file can not only represent the above relationship, but also can be used for
condition monitoring by adding equipment number, topological relationship and status data in graphic
file elements, such as drawings in SCADA system. In fact, due to different business requirements,
graphic files are often used in the design stage and equipment numbering stage of power plants or
substations, which requires the identification and conversion of graphics and models.
    After the SVG Standard was put forward in 1992, it has been widely used in power drawing and
power equipment information monitoring [1] [2]. However, the previous research on the conversion
of drawing mainly focused on the conversion of drawing format or the vectorization of graphics files.
Wen et al. [5] studied how to convert AutoCAD drawings into XAML files, and Gong et al. [6] studied
the method of converting AutoCAD drawings into GIS files. Liang et al. [7] proposed to convert
AutoCAD drawings into SVG files based on topological features of drawings. However, the research
on the recognition and conversion of power graphics files to graphics model files has not been seen
in public literature or patents.
    In order to realize the reuse of historical drawings, a hybrid transformation framework of primary
power drawing (HTFP2D) is proposed in this paper. The method of text and graphics recognition is
adopted synthetically. Through the identification of key elements, the results of the two methods are
verified interactively. Finally, the topological structure of the drawings is obtained and the graph

              Content from this work may be used under the terms of the Creative Commons Attribution 3.0 licence. Any further distribution
              of this work must maintain attribution to the author(s) and the title of the work, journal citation and DOI.
Published under licence by IOP Publishing Ltd                          1
IWAACE 2021 IOP Publishing
Journal of Physics: Conference Series 1861 (2021) 012090 doi:10.1088/1742-6596/1861/1/012090
model data is generated according to the standard. The experiment results on a large number of
historical drawings show that the method can realize the identification of the topology structure of the
primary drawing file, realize the conversion from the graph to the diagram model file, ensure the data
of each system unified, and improve the intelligent level of power grid management.
The structure of this paper is as follows. Section 2 summarizes the related work, Section 3 describes
HTFP2D in detail, and Section 4 verifies the effectiveness of the algorithm combined with
experiments.
2. Related works
In the power system, the research and application of graph model integration is still in its infancy. With
the need of smart grid construction, its research becomes more and more important. In February 1999,
W3C organization put forward the SVG draft, which was constantly improved. Meanwhile, the
Common information model (CIM) was proposed in IEC61970 standard. The progress of these two
technologies makes the integration of graphics and models become the direction of technology
development. International well-known power software developers such as ABB, Siemens, Sisco,
Alstom and so on all adopt corresponding standards in their software. Some famous domestic power
companies, such as Nari Jibao, Guodian Nanzi, Guodian Nari, Tsinghua University, Chinese Academy
of Sciences, have also studied SVG power drawing and application.
In the application of SVG drawing, reference [3] studies the method of embedding data information
in SVG graphics, and dynamically loads data in database on SVG graphics to realize equipment
Graphics Association. Reference [4] studies the design method of SVG power graphic library, so as to
integrate graphics, models and data. In the aspect of drawing format conversion, Wen Chanjuan et al.
[5] studied how to convert AutoCAD drawings into XAML files, so as to realize the sharing of drawing
files among different systems. Gong Jiayu et al. [6] studied the method of converting AutoCAD
drawings into GIS files, but did not study the conversion methods of power drawings. Reference [7]
proposed to convert AutoCAD drawings into SVG files based on the topological features of drawings.
This conversion is only the mapping of two different graphic file formats, rather than the conversion
from drawing files to drawing model files.
In addition, Nari power grid dispatching automation integrated system OPEN-3000 is based on IEC
61970 standard, and database design is based on CIM standard. The power graphics drawn by the
drawing function in DF8900 system of Dongfang Electronic Co., Ltd. can be converted into the format
through the graphic conversion tool, but it adopts the private graphic file format, which cannot be shared
with other systems. There is no corresponding literature or patent on drawing conversion.
3. HTFP2D
3.1. Power primary drawing modeling
In order to realize the conversion from drawing file to drawing model file, it is necessary to model the
primary power drawing [8]. The characteristics of primary electric power drawings are obvious
hierarchical structure and standard graphic elements. Taking a substation as an example, when
describing a substation drawing, it is necessary to first know that it contains several voltage levels and
several transformers, and then it is necessary to describe the wiring mode of each voltage level and the
number of outgoing and incoming lines. Then, it is described that there are several circuit breakers,
isolation switches and grounding switches on the circuit, as well as the frame information and annotation
information [9].
CIM, the core of IEC61970 standard, is described by object classes, properties and the relationship
between them. Based on IEC 61970, the State Grid of China (SGCC) has optimized and proposed a
power diagram model suitable for China's national conditions. However, many existing CAD drawings
or SVG drawings lack this model description relationship, so they need to be converted to form a graph
model file.
2IWAACE 2021 IOP Publishing
Journal of Physics: Conference Series 1861 (2021) 012090 doi:10.1088/1742-6596/1861/1/012090
Drawing
Transformer
Electric
generator
Graphic
frame
Voltage level
Bridge
connection
Circuit breaker, switch,
ground switch
Bus
Circuit breaker, switch,
ground switch
mother‐connected
circuit breaker
Fig. 1 Object model of power grid primary drawing
3.2. The framework of HTFP2D
Drawing conversion is to establish a one-to-one mapping relationship between the drawing before
conversion and each element in the converted drawing. The transformation from drawing file to drawing
model file is not only to achieve the consistency of graphics, but also to keep the connection between
the transformed drawing and the original drawing in semantics. To achieve this transformation, one is
to take a bottom-up approach: to combine graphic elements such as lines, circles and arcs, and then
match them with intervals and primitives in the graphics library, so as to establish the topological
relationship of drawings. A drawing is composed of hundreds of graphic elements. This search method
needs a lot of overhead. In addition, there are many virtual connections between these graphic elements.
This method needs to identify virtual connections and equipment numbers. Another method is to use the
top-down service mode, that is, CIM model is used to mine the information of drawings. In this way,
the drawings are regarded as a hierarchical object tree. As long as each element is identified, the
topological relationship of drawings can be constructed. Then, the model recognition and format
conversion of drawings can be completed by using the graphic elements in the library according to the
output format required.
Standard
element library
Topology Drawing
identification topology Cross Output files
Graphic file
analysis model validation
Anotaion
identification
DWG files SVG files VSD files
Fig. 2 The Basic process of HTFP2D
In this paper, a hybrid transformation framework of primary power (HTFP2D) is proposed. The basic
idea of the algorithm is to first identify the topological connection relationship of drawings, obtain the
topological connection of drawings, and then extract the number information of drawings, carry out
3IWAACE 2021 IOP Publishing
Journal of Physics: Conference Series 1861 (2021) 012090 doi:10.1088/1742-6596/1861/1/012090
interactive verification and annotation according to the numbering rules, so as to obtain complete
topological information recognition, and then output the result file according to the standard graphics
library.
From the analysis of the previous section, the system mainly includes three key steps, namely,
drawing topology identification, annotation identification and cross verification.
3.3. Drawing topology identification
The topology identification of power primary drawing mainly includes three information: which
elements are included in the drawing and whether the attribute of the element is put into production or
reserved; the connection relationship between the elements, that is, the corresponding relationship of
connection terminals; and the relative coordinates. Thus, a power drawing can be expressed as T= (V, L,
coor), where V represents various primitives, L represents the connection relationship between the
primitives, and coor represents the central coordinates of the primitives and the position of the connected
terminals. There are four steps in drawing topology identification.
a. Voltage level identification
Determine the number of voltage levels and voltage levels, the number of voltage levels can identify
the bus through the width of the bus, and then identify the direction of the bus. In calculating the distance
between the buses, the number of voltage levels can be calculated by clustering algorithm. After the
voltage level is identified, the circuit breaker number and the type of transformer are used for verification.
According to the primary equipment numbering rules, 550kV, 220kV, 110kV and other equipment with
different voltage levels start with 5, 2 and 1. If the voltage number of the circuit breaker is consistent
with the number of clusters, it indicates that the voltage level identification is correct. In addition, if
there are transformers in the diagram, the number of voltage levels appearing should be consistent with
the number of winding resistances.
b. Connection Patterns identification
Typical connection patterns include 2 / 3 connection, double bus connection, single bus connection,
double bus side bus connection, bridge connection, triangle connection, etc. After the voltage level is
identified, it can be judged according to the number of buses in each voltage level and the relative
distance of buses. For example, in the connection mode of double bus side bus, there must be three buses,
two of which are close to each other and the other is far away. In this way, the connection patterns of
each voltage level can be identified.
c. Interval identification
Fig.3 Interval identification method
The typical power interval includes incoming and outgoing circuits, and the interval of each voltage
level has a relatively fixed mode. Therefore, the identification process mainly identifies the circuit
breaker to determine the total number of intervals Nv. When the number of intervals Nv is obtained, the
average width Wv of the voltage level can be obtained. Then calculate the iv center coordinates (Xiv, Yiv)
of the circuit breaker projected on the bus to determine its connection point. If it is the connection mode
of double bus side bus, the position of two connection terminals can be calculated. The distance between
outgoing line and incoming line can be judged by whether there is an arrow in the interval range of
4IWAACE 2021 IOP Publishing
Journal of Physics: Conference Series 1861 (2021) 012090 doi:10.1088/1742-6596/1861/1/012090
circuit breaker Xiv-Wv/2, Xiv+Wv/2). If the voltage is vertical distribution, the judging range is (Yiv-Wv/2,
Yiv+Wv/2). After that, through scanning the knife switch, disconnector and other elements to determine
whether it is a complete interval, so as to get the series of intervals.
d. Bus connected equipment identification
Bus connected equipment mainly includes bus bar switch, bus circuit breaker, etc. the identification
of these equipment is mainly through the identification of some key elements. At the same time, the
virtual connected equipment is judged by a global variable δ. If the distance between the equipment and
the bus bar is less than one fifth of the length of the knife switch, it is connected with the bus artificially.
3.4. Annotation identification
This part mainly includes two parts: frame information recognition and label recognition. The
identification of frame part is mainly completed by the identification of fixed position, which mainly
includes the information of drafter, auditor, approval, audit and other personnel as well as date
information. In contrast, the annotation information is relatively difficult, so we need to identify the
direction of the string. We design a heuristic string to identify the direction.
The recognition method is as follows: firstly, scan the direction of the string horizontally and
vertically, and calculate the average distance between all strings. If the proximity distance is less than
the average distance, it is considered as a string. Through this clustering algorithm, string recognition
can be realized.
Algorithm: Text recognition algorithm
Input: Drawing,C //character collection
Output: S= //identified string
collection
Begin
1: Initialize Drawing;
2: (Dh, Dv)=Scanning(Drawing);
3: For each Characteri∈C;
4: if distance(Characteri-1, Characteri)< (Dh, Dv)
5: si= (si, Characteri);
6: return;
7: End
8: S=;
9: End
End
Fig.4 Label recognition algorithm
3.5. Cross verification
For the information obtained after topology identification and annotation recognition, interactive
verification can be carried out to improve the correctness of identification. Because there may be errors
in power primary numbering, it is necessary to filter and repair the wrong data. The voting method is
used in the verification of the number. Taking the voltage level as an example, the number of all voltage
levels is counted. If some data singularity appears, that is, the voltage level with low frequency, it will
be deleted. The filtered post number information is compared with the topology information. If there is
any difference, an alarm will be given and the judgment will be made manually.
4. Experiment and verification
Through the above method, we verify the SVG file in the power grid drawing to illustrate the
effectiveness of the algorithm. The host configuration is 2.6GHz with 4 cores and 8GB memory. 50
SVG drawings are selected for pattern recognition conversion. The converted drawings are analyzed
from voltage level, wiring mode, interval identification and bus coupling equipment identification, as
shown in the table below. It can be found that the voltage level and connection mode are 100% correct,
5IWAACE 2021 IOP Publishing
Journal of Physics: Conference Series 1861 (2021) 012090 doi:10.1088/1742-6596/1861/1/012090
but there is a certain error between the interval identification and bus coupling equipment identification.
This is because the interval identification depends on the rich types of graphic elements in the graphic
library, and it is necessary to design equipment algorithm.
Table 1 Accuracy of each step of topology identification
No. Object Accuracy
1 Voltage level 100%
2 Connection Patterns 100%
3 Intervals 95%
4 Bus connected 96%
equipment identification
Fig.5 and Fig.6 show the comparison effect before and after conversion. After careful analysis, it can
be found that the drawings before and after conversion are consistent with the original drawings in
appearance and number.
Fig.5 DWG drawing before conversion
6IWAACE 2021 IOP Publishing
Journal of Physics: Conference Series 1861 (2021) 012090 doi:10.1088/1742-6596/1861/1/012090
Fig.6 DWG drawing after conversion
5. Conclusion
In this paper, a method of converting the drawing file of primary power equipment into drawing model
file is adopted in this paper. The method ensures that the converted drawing is consistent in graphics
and semantics through topology identification and annotation recognition. Experiments on typical SVG
drawing files show that the algorithm has high accuracy. It is not only suitable for SVG files, but also
suitable for VSD files and DWG files. This technology has very important application value for the
management of important drawings of power grid company, and has a wide range of application benefits.
Acknowledgments
This work was financially supported by the National Key Research and Development Program of China
(No.2018YFB1800200), Foundation for Training Postdoctoral Innovative Talents in Southeast
University (No.2242019R20024).
References
[1] W3C . Scalable Vector Graphics(SVG) 1.2 Specification[EB/OL] . http://www.
w3.org/TR/2004/WD-SVG12-20041027.
[2] Dong Chaoxia, Dai Qi, Yang Fen, Grid modeling technology based on CIM and SVG. Journal of
Electric Power System and Its Automation, 2006,5(18):58~61.
[3] Yan zengrui. Research and implementation of power system CIM model data management based
on SVG. Shanghai Jiaotong University, 2010.
[4] Zhang wenjie. Research and implementation of power system visualization based on CIM model,
Shanghai Jiaotong University, 2009.
[5] Wen Chanjuan, Ou Jiawei, Jia Jinyuan, Novel approach for converting AutoCAD drawing to
XAML file,Journal of Computer Applications,2009(s2), 373-375.
7IWAACE 2021 IOP Publishing
Journal of Physics: Conference Series 1861 (2021) 012090 doi:10.1088/1742-6596/1861/1/012090
[6] Gong Jiayu, Huang Deyong. The data conversion between AutoCAD and the other software used
frequently. Surveying and mapping in Sichuan,2004.doi:10.3969/j.issn.1674-
5019.2004.01.011
[7] LIANG HongboWANG ZhanfengQIN Ling. Research on DWG Drawing Conversion
Technology Based on Prior Knowledge, Yunnan Electric Power, 2017, 45(005):64-66.
[8] Zhao Tianyu. Research and Implementation of Power system chart-module integration based on
power SVG. 2017.
[9] Zhang Chen. Comparative study on development technology of power platform based on CIM /
SVG graph model data integration. Science & Technology Association Forum. 2012, 92-93.
[10] Jiang Yi, Zhang Hailong, Wu Junjie. Gallery electric power system is the integration of the
research. Power system and clean energy, 2016, 32(004):85-88.
[11] Huang Jinhua,Zhao Qiang. Research on Integration of Graphic, Data and Model Based on Open
Standards, Modern Electric Power, 2010(6):73-78.
[12] Huang Jinhua. Research and implementation of power system diagram library model integration
based on SVG [D]. North China Electric Power University, 2011.
[13] Hu ZhenTian,Mo WenTong,Lu GaoLing. ObjectARX programming to realize the automatic
conversion from VirtuoZo mapping data format to AutoCAD format . Urban Geotechnical
Investigation & Surveying ,2008(2): 135-137.
[14] Qiu Yaobo. Design and implementation of vectorization method for scanned images of
engineering drawings [D].Shanghai Jiaotong University, 2007.
[15] Dong Chao. Data exchange of CAD assembly model based on XML . Dalian University of
Technology, 2009.
[16] Yang Wei, Li Li, Su Yong. Automatic generation and checking system of main wiring
diagram. Jiangsu Electrical Engineering,2013, 32(3):19-22.
[17] Wang Lin. Application of graphical operation mode in distribution network. Yunnan electric
power. 2014(4):96-99.
[18] Li Tianzhi, Zhang Ying. Operation analysis of main electrical connection of hydropower station.
Yunnan electric power. 2013.41(3):83-85.
8You can also read