Stroke Level Estimation through Pac-Man Game Data Played by Acute Stroke Patients - EPFL
←
→
Page content transcription
If your browser does not render page correctly, please read the page content below
Stroke Level Estimation through Pac-Man Game
         Data Played by Acute Stroke Patients
                                       Victoria Perez Cortes, Simon Dürr, Valentine Perrin
                                                 CHILI Lab, EPFL, Switzerland

   Abstract—The aim of this project was to predict the stroke level       We aim at using feature engineering to develop meaningful
of patients based on a game of Pac-Man. Using hand movement            features from game data to achieve successful estimation
recording during games and feature engineering with metrics            of motor function impairment level in the 19 acute stroke
derived from literature, we aim at classifying motor function of
stroke patients by their score in the Fugl-Meyer Assessment test.      patients.
We develop a model with meaningful features and easy interpre-
                                                                                           II. DATA E XPLORATION
tation, opening new perspectives for rehabilitation processes, and
allowing health professionals to obtain fast stroke level assessment      The data consists of three data sets. One consists of the pa-
via the Pac-man game. It is a random forest model, leading to          tients’ stroke levels for the motor function and the 9 categories
an accuracy of 0.56.                                                   of the FMA; there are 19 patients, whom final scores range
                        I. I NTRODUCTION                               from 28 (most affected) to 66 (not affected); the distribution of
                                                                       the stroke level of the patients is shown in Figure 2. The target
   A stroke happens when poor blood flow to the brain causes
                                                                       set is very small and the distribution is highly skewed towards
cell death. Patients stroke level can be assessed by the Fugl-
                                                                       less impaired patients, with 7 out of 19 patients showing only
Meyer scoring (FMA). It is a stroke-specific, performance-
                                                                       light impairment (FMA score >60).
based impairment index, with 5 aspects that can be affected
                                                                          The second data set consists of data collected through the
by a stroke: motor functioning, sensory functioning, balance,
                                                                       games played. Each game is defined by the patient ID, game
joint range of motion, and joint pain. Here, it is the impairment
                                                                       ID, day, time and settings. There are 32 variables measured for
of the upper body motor function that is explored. In FMA, the
                                                                       each timestamp, such as velocity, jerk, and acceleration. Each
upper body motor function is graded out of 66, on 9 criteria
                                                                       patient played between 2 and 10 games (15 of them played at
such as reflex, movement, and flexibility. For each, a grade of
                                                                       least 8 games), for a total of 136 games.
0 is given if the patient can’t do the task: a level of 66 certifies
                                                                          The third data set contains the metrics relating to the apples
no impairment in the motor function.
                                                                       during the games.
   Pac-Man is a maze chase game; the player controls Pac-Man
character through an enclosed maze. The goal of the game is
to eat all of the dots placed in the maze while avoiding four
ghosts that pursue the player. Here, the gameplay is strongly
inspired by Pac-Man, but there are few differences, as shown
in Figure 1 : there are 2 ghosts instead of 4, and dots are
replaced by apples to be ’eaten’; the ghosts can catch them,
making the player lose the apples. The game ends when all
apples are collected.

                                                                              Fig. 2. Distribution of the 19 patients stroke levels (FMA)

                                                                                         III. DATA P RE - PROCESSING
                                                                       A. General pre-processing
                                                                         We developed a data pre-processing pipeline. Initial data
      Fig. 1. Map of the game played by the acute stroke patients      exploration showed that there is only one feature with missing
                                                                       values, the feature ’minDist’, a measure of deviance. Out of
   Recording of the hand movements during the games leads              96’597 time points, 10’916 miss the minDist feature. They ac-
to recording of numerous features, such as ones describing the         count for small portions of each game, in a equally distributed
hand position or movement velocity.                                    manner. We thus decided that missing minDist values will be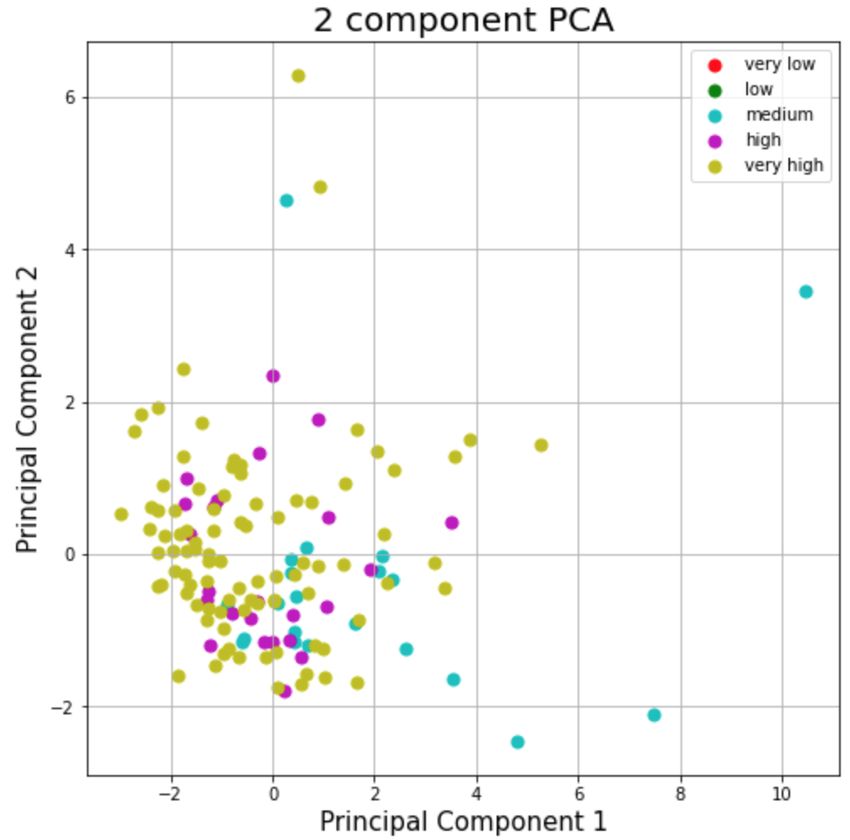
replaced by the last non-missing value (chronological order)          •   Max velocity
after having split the data by games and by patients. As the          •   Mean velocity:Max velocity ratio
minDist is related to position through the game, it explains          •   Total motion (assessed by position variability)
why we use last known minDist value as a filling for missing          •   Mean time to get one apple
values.                                                               •   Number of apples caught during a game (a number higher
                                                                          than 6 means that the patient lost some apples during the
B. Dealing with the data set                                              game - by being caught by a ghost or hitting a wall)
   1) Small data set: The highly skewed distribution of our         All these features will then be further selected through model
data might raise some issues, or could affect the quality of our    selection for result optimization.
prediction. We can consider that patients with e.g. 64-65-66
scores are very close to each other and their score difference                       V. M ODELS AND M ETHODS
might be only a human error (from doctors evaluating stroke
levels). Also, it could be a way to improve accuracy without        A. Models
losing the model interpretability. We thus split the outcome           We aim at developing a interpretable model, that is mean-
variable into bins and defined score levels, presented in part      ingful for health applications. We needed a model that would
V-F. We tested two possibilities: we didn’t consider the highly     not work as a ’black box’, which can be explained to health
skewed distribution as an issue, or we also measured accuracy       professionals to justify further medical investigation and re-
within 5 units of FMA.                                              habilitation, and in which each feature contribution can be
   2) Human data: Our data set is composed of human                 justified. Furthermore, with a very scarce target set, it is known
data. Patient differences are not negligible, particularly as we    that simple models should be preferred to prevent overfitting
consider data from patients with strong differences in motor        [3].
function impairment. This calls for careful considerations
                                                                       We used decision trees as the center piece of our models.
during data processing. The data should be split (to train and
                                                                    Decision tree learning is a visual way to make predictions
to test) by patients and/or then by the games they played, to
                                                                    which corresponds to our criteria. There are two types of
obtain patient-level or game-level data, from which we later
                                                                    decision trees, and we implemented both, as explained in parts
build the features. Patient-level data in that case consists of
                                                                    V-E1,V-E2: classification and regression tree analysis.
the data from all games of a patient. The generalization of a
                                                                       We implemented a model based on random forests, where
feature at levels above patient-level is not meaningful and is
                                                                    the outcome is either the average of all decision trees outcome
wrong considering human data.
                                                                    (regression) or a majority vote (classification).
                IV. F EATURE E NGINEERING
                                                                    B. Bootstrapping
   We need some literature metrics to pursue the development
of a stroke level prediction model through feature engineering.        To assess the standard error of the decision trees in the
                                                                    random forest we used bootstrapping as implemented in scikit-
A. Literature metrics                                               learn. In Bootstrapping we draw samples with replacement
   It is known that quantitative measures of human movement         from the training set.
quality are significant in rehabilitation for expressing the
outcomes during rehabilitation treatments and discriminating        C. Out-of bag score (OOB)
between healthy and pathological conditions [1]; for that
                                                                       As the dataset is small we used the out-of-bag score that
reason, it is essential to develop meaningful features so that we
                                                                    one obtains with no reduction in training set size when im-
can accurately interpret the results. We found several features
                                                                    plementing the random forest model with bootstrapping. This
from literature [1], [2]. Considering the types of gameplay and
                                                                    allows us to obtain an unbiased estimate of the generalization
task, we further select some metrics. Since we have position-
                                                                    error [4]. The OOB score replaces a cross-validation, which
based data collected through a robot held by the patient, the
                                                                    would have made the dataset even smaller.
selected metrics should take into account the gameplay and
the available data.
                                                                    D. Feature selection
B. Computed features                                                   1) Feature importance: The feature importance describes
  We selected the following features from literature and            which features are relevant for our model. Feature importance
engineered them.                                                    is easily implemented for random forests, as we can measure
  • Mean velocity                                                   how each feature decreases the impurity of the split, and
  • Mean jerk                                                       collect the average impurity reduction, across all trees. We
  • Trajectory error (deviance, using minDist)                      use feature importance to guide feature selection.
  • Number of velocity peaks                                           2) Backward selection: We implemented a recursive feature
  • Peak velocity                                                   elimination algorithm (RFE), which allows to obtain the best
  • Task/movement time                                              number of features as well as the best combination of features.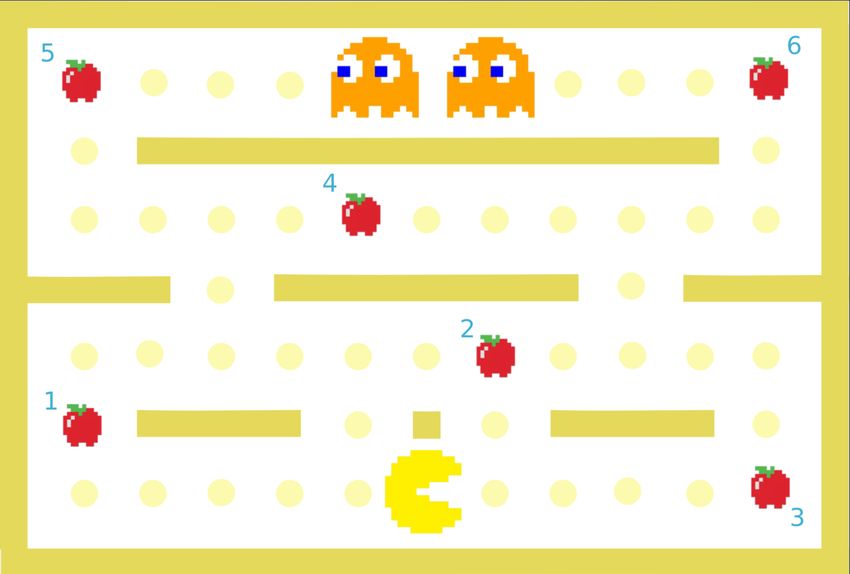
Number_peaks classification problem): as a mean of interpretation, accuracy is
v valid. All accuracy measures for the FMA score are presented
acc in Table 1, with the best hyperparameters.
ratio_v
Feature
Table 1. R2, accuracy and best parameters.
minDist Model R2 Accuracy Depth N- OOB
jerk trees
Mean time apples Preliminary results 0.40 /// /// /// ///
game_times (linear model)
Number apples Preliminary results - /// /// /// ///
(non-linear model) 0.40
0.0 0.2 0.4 0.6 0.8 1.0 Regression tree, 0.85 0.42 8 500 0.47
Mean Ranking patient-level, no
apples
Fig. 3. Feature selection using Recursive Feature Elimination Regression tree, 0.93 0.79 8 50 0.46
patient-level, with
apples
Classification tree, 1.0 1.0 8 10 0.21
E. Trees and random forests patient-level
Classification tree, 1.0 1.0 12 10 0.19
1) Regression trees (by rounding): Our target set can be game-level
seen as a continuous, discrete set, thus we used regression Regression tree, 0.90 0.56 12 1000 0.23
tree analysis. Regression predictions were however round up to game-level, no apples
Regression tree, 0.90 0.53 12 1000 0.24
obtain discrete numbers, as the scores we predict are integers. game-level, with
This can be artificially interpreted as a classification where apples
each level is a class.
2) Classification trees: Our target set can be seen as
classes, where each class is a level of impairment. Thus we A. Preliminary results (from the lab)
were able to use classification tree analysis. The CHILI lab provided us with their initial research as a
3) Tree depth and number of trees: The depth of a decision baseline for our project. The improvements brought by our
tree is an important parameter to regulate the model fit. models are compared to these using the R2 measure.
The tree depth leading to the best accuracy was investigated.
Furthermore, as we work with random forest models, we need B. Regression using patient-level data
to define the best number of trees for model optimization. The regression using patient-level data achieved relatively
low accuracy of predicted scores. We then added to that model
F. PCA & NCA the two features from the apples data (as described in feature
Principal components analysis is an unsupervised learning engineering), at a patient-level. This resulted in an improved
method to derive a low-dimensional set of features from a accuracy, as shown in Table 1. These good results are sustained
large set of variables. Combining this method with K means by relatively high OOB scores, which is encouraging for model
clustering, one can define clusters to group the data in classes generalization at patient-level. But the patient-level data does
of similar elements, making the assumption that similar data not quite answer to our needs of a procedure to assess motor
belongs to the same class. It was used to determine whether impairment from unique games, as it would mean that a patient
score groups could be formed to train game. For the PCA, will need to play several times before we will be able to
6 labels were defined: very high (50-66), high (40-50), good assess its motor impairment. We reproduce that regression with
(30-40), medium (20-30), low (10-20), very low (0-10). game-level data.
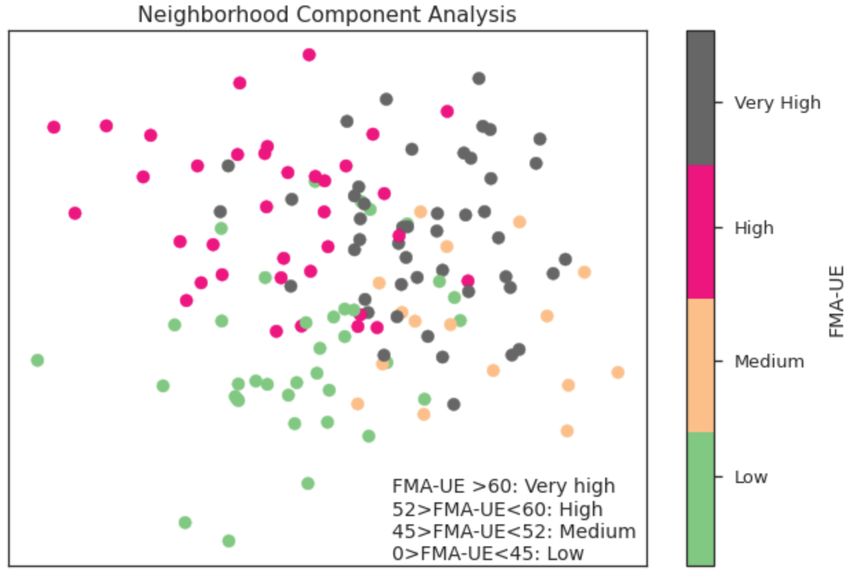
Neighborhood component analysis (NCA) is a supervised
method that learns a low-dimensional embedding of the data C. Classification with game-level and patient-level data
by finding a distance metric that maximizes the leave one out While the classification models perform well when looking
error in a stochastic nearest neighbor search. We used Linear at the accuracy and R2 metrics, the OOB score is low, showing
Discriminant Analysis to initialize the NCA search. The data that the generalization error for the classification models are
was pre-segmented into 4 classes before performing the NCA high. A likely reason for this is that the target set is skewed,
based on the FMA score to provide the labels. For NCA, four containing many patients with only light impairment of motor
labels were defined: very high (>60), high (52-60), medium functions.
(45-52), and low (0-45).
D. Regression using game-level data
VI. R ESULTS The regression using game-level data achieved relatively
The investigation for best pipeline was made in a sequential high accuracy of predicted scores. We then added to that model
manner. We used the R2 score to assess the best hyper- the data from the game apples, at a game-level. This resulted
parameters. The best model was then selected and further in a slightly lower accuracy, but a slightly higher OOB score,
optimized based on the accuracy and the OOB, even if we which is why we further selected that model as our best one
used regressions (we predict discrete numbers so it becomes a for further optimization.E. Pipeline and feature selection the training data. The NCA analysis is nevertheless informative
All models implemented show strong improvement com- as it clearly shows that there exists a learnable embedding for
pared to the preliminary results from the lab. We then imple- the data that separates patients of different stroke levels in a
mented a pipeline computing feature selection and used OOB reduced 2-dimensional feature space. In addition, new patients
as an estimate for the test error. The number of features to can be added to the learned embedding based on the previous
keep was set to 5 (the best number of features from RFE, data to find out their stroke level in the assumption that the
Figure 3) and were the trajectory error (minDist), the mean existing data already well describes the different stroke levels.
velocity, the mean:max velocity ratio, the mean acceleration, Unlabeled stroke patients after transformation should appear
and the number of velocity peaks. That final model gave us the in the respective corner of Fig. 5.
following results for the total FMA scores estimation (using
regression tree at game levels and with apple data):
• R2 score : 0.90
• OOB score : 0.27
• Accuracy : 0.56
• Depth : 12
• N-trees : 1000
As we predict a single number between 1 and 66, an accuracy
of 0.56 is very encouraging as it is already way better than by
random chance.
F. Principal Component Analysis (PCA)
Fig. 5. Neighborhood component analysis showing the embedding using the
The variance in our data is most explained by the two first categorical labels
components. We then determine the number of clusters. In
order to do this, we fed these principal components to the
k-means algorithm. After k = 5, the change in the value of VII. D ISCUSSION & C ONCLUSION
inertia (sum of the squared distances to the nearest cluster) is We developed an interpretable model with meaningful fea-
no longer significant and most likely, neither is the variance tures to estimate the stroke level of acute stroke patients. We
of the rest of the data after the elbow point. constructed a random forest model using game-level data, and
Given these results, we have performed PCA with 2 prin- features defined by feature selection algorithms, and were able
cipal components, using 5 clusters (very low, low, medium, to predict the FMA score with an accuracy of 0.56.
high, very high) and we obtained the following results: However, even if the R2 score is close 1, we observed
that the out-of-bag score was relatively low. This indicates
that our model has issues with generalization. This is due to
the scarcity of our data; it means that prediction for a new
patient FMA score is hard. The data size should be increased
to improve the generalization of our model.
Interpretability and meaningfulness are the most essential
aspects of our model: it is made such that helpful conclusions
can be obtained, allowing direct applications in health do-
mains. We developed a way to assess stroke level impairment
via a fast procedure, allowing health professionals to orient
the rehabilitation and reeducation in consequence. This model
could be further improved by pursuing different leads:
• Using bin-classification (accuracy within a given range)
is definitely a way to improve the accuracy of the results,
Fig. 4. Principal component analysis with 5 clusters. without losing interpretability of the model. Indeed, ac-
curacy within 5 allows to obtain a 0.82 accuracy with our
This graph shows clusters for the very high and high best model.
categories, but it does not separate well these results from the • For patient level data, it could be useful to subdivide the
medium or low categories. This is probably due to the lack of data to have more data and improve the results further.
data for these low levels. • Also, the relatively good OOB scores obtained with
patient-level data suggest that patient-level prediction
G. Neighborhood component analysis (NCA) could be made from game-level data to increase model
NCA is a supervised technique which cannot be used to cre- stability, stroke level estimation being given as a majority
ate features as this would constitute leakage of the labels into vote/mean/median of all game results.R EFERENCES
[1] Ana de los Reyes-Guzmán, Iris Dimbwadyo-Terrer, Fernando Trincado-
Alonso, Félix Monasterio-Huelin, Diego Torricelli, and Angel Gil-Agudo.
Quantitative assessment based on kinematic measures of functional
impairments during upper extremity movements: A review. Clinical
Biomechanics, 29(7):719–727, 2014.
[2] Anne Schwarz, Christoph M Kanzler, Olivier Lambercy, Andreas R Luft,
and Janne M Veerbeek. Systematic review on kinematic assessments of
upper limb movements after stroke. Stroke, 50(3):718–727, 2019.
[3] Dealing with very small datasets. [Online]. Available: https://www.kaggle.
com/rafjaa/dealing-with-very-small-datasets.
[4] Out-of-bag error estimate. [Online]. Available: https://www.stat.berkeley.
edu/∼breiman/RandomForests/cc home.htm#ooberr.You can also read


