Detecting Airport Layouts with Computer Vision - White Paper - Mosaic ATM
←
→
Page content transcription
If your browser does not render page correctly, please read the page content below

Detecting Airport Layouts
    with Computer Vision

    White Paper

1                   White Paper
Detecting Airport Layouts
with Computer Vision

Overview
Computer vision is a discipline of artificial intelligence (AI) that trains
computers to interpret and understand the visual world. By training
deep learning models using digital images, machines can accurately
identify and classify objects – and then react to what they see. The
use case applications of this technique are vast, from facial recogni-
tion to healthcare. Using computer vision, data scientists have the
opportunity to provide businesses with powerful data insights. The
rise of open-source technologies, such as Python, make it extremely
efficient for data science professionals to validate and train deep
learning models. In the following white paper, Mosaic will examine
how to apply these dynamic machine vision algorithms to identify and
classify airport layouts using satellite imagery.

                                        White Paper                           2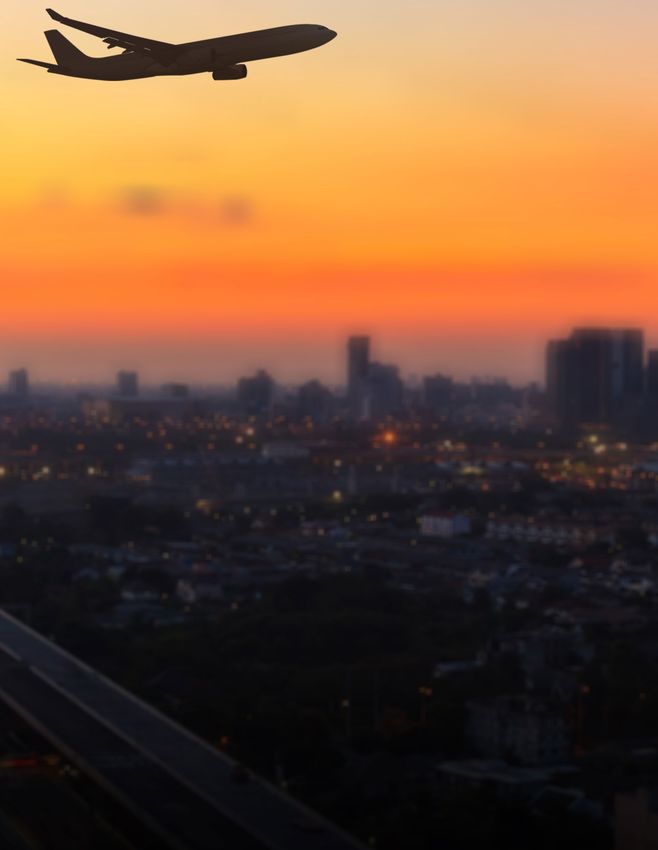
Digitizing and                                               The ground truth data used for the
                                                             computer vision solution was created by
Automating the Airport                                       extracting polygons from satellite images
                                                             that represent various structures at the
Layout Process                                               airport, i.e., Runways, Blastpad, Apron,
                                                             Taxiway, Buildings. Figure 1 shows the
Airport layouts provide pilots an advance                    airport layout for Hartsfield-Jackson Atlanta
visual of the runways, taxiways, and other                   International Airport (ALT) with these 5
elements of an airport, providing useful                     classes of ground truth. These enclosing
context for flying visual approaches or                      polygons were drawn using Google Earth
taxiing to assigned gates or holding areas.                  and extracted to kml files. The kml files hold
Airport blueprints are usually available                     the latitude, longitude, and altitude points
at the time the airport was planned and                      of the polygon for each referenced class
constructed; however, airports typically                     above. This polygon extraction process is
undergo many changes over decades of use,                    time-consuming, limiting how many ground
requiring tedious, time-consuming blueprint                  truth blueprints can be created. A dataset
updates to get pilots an accurate airport                    of 46 major airports in the US and Canada
layout to reference. Digitization of airport                 was made available for training a computer
layout blueprints and automatic updating                     vision model.
through computer vision could save thou-
sands of hours of labor each year if imple-
mented worldwide.
                                                                Figure 1: ATL Airport Layout with 5
Mosaic ATM, a leading AI aviation consult-                      Ground Truth Classes
ing firm, outlines an approach applying
computer vision for updating the airport
layouts using satellite imagery of the
airports. This automates the digitization
process and can be used on any airport
worldwide. Mosaic provides innovative avia-
tion solutions to commercial airlines and
federal agencies, including NASA and the
FAA. Fusing our sister companies’ (Mosaic
Data Science) deep learning expertise with
Mosaic ATM’s deep domain expertise led
to a promising computer vision solution to a
real-world aviation challenge.                                  Key:                   Runway         Buildings

                                                                       Taxiway         Apron          Blast Pad

3                                              White Paper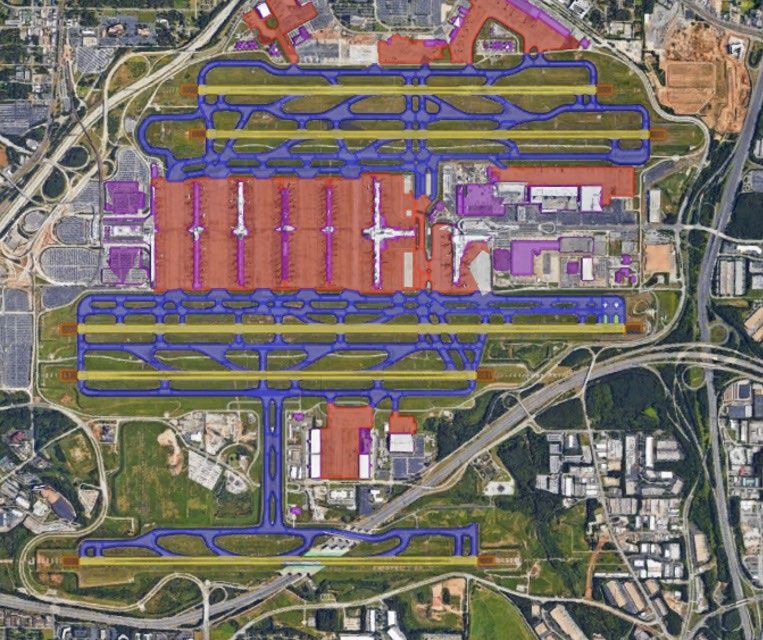
For the purpose of this solution, the kml files were used in Google Earth to extract images of the
ground truth, as there was no georeferencing of the satellite image of the airport available. The
individual masks for each airport in our dataset was extracted, as shown in Figure 2, at a 700×700
image resolution. A more ideal way would be to use the polygon coordinates and georeferenced
image and convert them to an image coordinate system which will help in deploying the results
from the computer vision model back into the satellite imagery coordinates.

 Figure 2: Step 1 | Computer Vision Design | Data Transformation
                                                                   Image preprocessing is
                                                                   the first step to solving a
                                                                   computer vision problem.
                                                                   The masks in Figure 2 were in
                                                                   RGB and had some outlines
                                                                   from the image extraction. The
                                                                   masks were first converted to
                                                                   a greyscale image; then, we set
                                                                   thresholds to create a binary
Image                               Mask 1: Runway                 mask with 1s and 0s indicating
                                                                   the presence of information at
                                                                   a specific pixel location. The
                                                                   masks were processed further
                                                                   to fill in the outlines of the poly-
                                                                   gon. The filled, closed polygons
                                                                   shown in Figure 3 improved
                                                                   the results of the model signifi-
                                                                   cantly because identifying the
Mask 3: Apron                       Mask 2: Blastpad               region enclosed in a polygon
                                                                   is a lot easier than identifying
                                                                   it based only on the outlying
                                                                   edges. We used the OpenCV
                                                                   Python library for all mask
                                                                   preprocessing tasks.

Mask 4: Taxiway                     Mask 5: Buildings

                                                   White Paper                                            4
Figure 3: Transformation from Satellite Image to Closed, Filled Polygon Masks

    The data was split to train and test at a 90:10 ratio, with 41 images selected
    randomly to be used for training and 5 selected for testing. Because the data-
    set was so small, we needed to augment the images and masks to create a
    bigger dataset. For the augmentation, the albumentation library was used to
    create transformations such as crop and rescale, channel shuffles, inversion,
    gaussian noise, brightness, contrast and hue changes, transpose, rotations
    and horizontal and vertical flips, and some combinations of the above. In
    this process, an image is selected at random and a random transformation
    is applied to the image-mask pair, as shown in Figure 4. This process was
    repeated until 500 images were generated with corresponding masks.

    Other preprocessing techniques used include resizing the images to the
    required resolution by the model and normalizing the image pixel intensities
    to fall within a range of 0 to 1, which helps in the model convergence.

    Figure 4: Step 2 | Algorithm Selection and Training | CNN

5                                               White Paper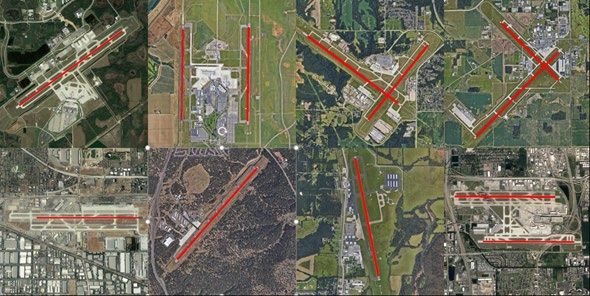
The satellite images have many intricate                   UNet is a convolutional neural network archi-
details to segregate each of the elements                  tecture that is widely used for biomedical image
of interest. For example, a runway is a                    segmentation and requires very few training
concrete strip, which looks similar to the                 samples. Our problem was very similar to the
roads surrounding the airport; however, the                biomedical applications, except the classes to be
differentiating factor is the markings on the              identified were different. Our dataset, however, is
runway. Also, there is a huge variation in the             very balanced—we had all the elements present in
images, e.g., in terms of width of runways,                equal proportions in the entire dataset.
distance from which images were captured,
and presence of ocean or green lands                       Our training data, consisting of 41 samples
surrounding the airport. Feature engineering               augmented to 500 samples, was split to train and
these details might be relatively easy for                 validate at an 80:20 ratio, with 400 images used
elements like runways, which have well-de-                 for training and 100 for validation. The model was
fined structures, but this is not the case for             trained for the first class of runways as a proof of
other elements that are of interest, like the              concept.
apron or buildings. Hence, a neural network
approach was considered. We conducted A                    A vanilla UNet was first tested on the dataset.
DSTL’s Kaggle competition to identify and                  The architecture, as shown in Figure 5, comprises
segment roads, buildings, crops, oceans,                   an encoder network and a decoder network with
and other features using satellite images,                 skip connections connecting the down sampling
and got great outcomes using UNet models,                  and upsampling layer, which help in restoring the
which trained on a dataset as low as 25                    features for better reconstruction. It consists of
image samples with labels.                                 blocks of convolutional layers with an activation
                                                           function and a pooling layer between the blocks,
                                                           adding up to 17 layers.
Figure 5: Step 3 | Deep Learning
Interpretation & Tuning

      Source: Ronneberger, Olaf; Fischer, Philipp; Brox, Thomas (2015). “U-Net: Convolutional Networks
      for Biomedical Image Segmentation.” https://www.kaggle.com/mauddib/data-science-bowl-tuto-
      rial-using-cnn-tensorflow

                                                   White Paper                                                    6
The UNet was trained using a Binary cross entropy loss func-
tion and a Nadam optimizer and dice (intersection over union -
IOU) as a metric for accuracy using a batch size of 4 for images
at 512×512 resolution. The dice coefficient is a pixel level
matching of the prediction to the ground truth. As the name
suggests, IOU is the intersection of the pixels of prediction and
ground truth over the union. A number close to 0 suggests that
there is little to no intersection of prediction over the ground
truth, and a value close to 1 is an indication of a good prediction
with low false positives and false negatives. This model had a
high train accuracy of 0.782 dice, but the validation accuracy
was as low as 0.45. It clearly indicated the model was overfit to
the training samples and needed some regularization.

We created a modified UNet with additional dropout layers
after each block of the convolutional layer and additional batch
normalization layers in each block, which helped overcome the
overfitting problem in the previous model. This final model had
27 layers and used the same optimizer and accuracy metric.
The loss function was changed to (1- dice), which helped
reduce the loss at a pixel level and improved segmentation.
This model had an accuracy of 0.87 for the training samples
and 0.79 for the validation samples. Figure 6 shows the model
accuracy over 40 epochs trained on the final model.

                                                                      Model accuracy
                                                                      validated at 84%

             Figure 6: Final UNet Model Accuracy and Loss

7                                               White Paper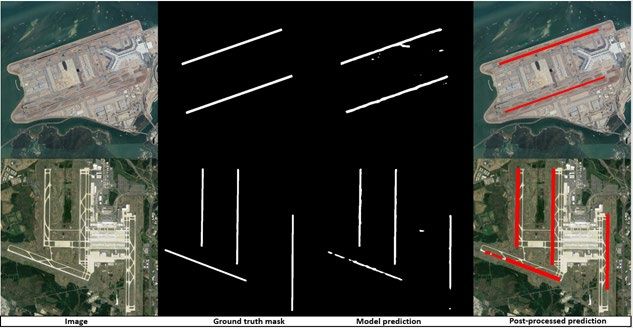
The predictions from the final UNet model were tested on 5 images from the
validation samples, which had the ground truth and the average dice over the
5 images was 0.840235. Figure 7 depicts the prediction mask for one of these
images compared to the ground truth mask. For the runways specifically, the
shape of the object is a rectangle. This helps in refining the mask by using some
erosion and thresholds and finding the tightest bounding rectangle for the
detected contour. All the post-processing was done using OpenCV.

Figure 7: Model-Predicted
Runway Masks vs. Ground Truth

                                                                       This model was further
                                                                       tested on a random set
                                                                       of airports downloaded
                                                                       from Google Maps.
                                                                       Results were promising,
                                                                       especially for the runway
                                                                       class; sample results
                                                                       are shown in Figure 8.
                                                                       The red line represents
                                                                       the model classification
                                                                       of the corresponding
                                                                       runway.
Figure 8: Final Model Results for Runway
Class Using Random Airport Images

                                           White Paper                                         8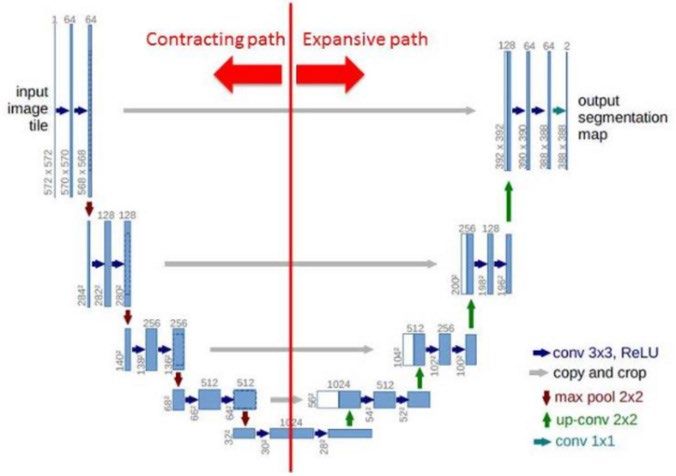
These results serve as Mosaic’s proof of
    concept, demonstrating that the computer
    vision model can accurately provide airport
    layout features. This model can be further             deicing area, helipads, and
    extended to predict other airport features             construction zones, which Mosaic
    beyond runways, such as taxiways. Mosaic               intends to include in extensions
    conducted some preliminary runs using the              of this automation to build more
    trained weights from the runway for initializing       comprehensive airport layouts.
    a transfer learning model, and they performed
    with an accuracy between 0.6 and 0.7. These            The insights generated from
    models can easily be improved with some                computer vision algorithms could
    hyperparameter tuning to match or even beat            also be integrated with the Mosaic
    the accuracy of the final UNet model. The              ATM airport viewer, which tracks
    overarching objective is to build a model that is      the exact position of aircraft at an
    as accurate as possible and requires the least         airport and estimates the time to
    post-processing.                                       takeoff or taxi to runway to help
                                                           improve management of airport
    An approach to meet the larger objective is            ground traffic.
    to use a multiclass segmentation model and
    penalize the loss by a factor when a false             With this proof of concept,
    negative or false positive of one class is a true      Mosaic was able to take the first
    positive of another class. This approach would         step toward automation of digi-
    help improve the segmentation accuracy for all         tal airport diagrams for airports,
    classes simultaneously. If there is still a need       which could be useful to airports,
    for post-processing, other techniques such as          pilots, and air traffic managers
    Hough transform, nearest neighbor clustering           worldwide.
    for sparsely distributed points like DBSCAN,
    and OPTICS algorithms can refine the predic-
    tions further before applying any thresholds.

    The analog airport diagrams available for all
    major US airports could also be leveraged to
    add some intelligence to the model predic-
    tions. For example, the runway markings have a
    number indicating the direction of the runway,
    so if the model predicts a taxiway instead of a
    runway, it can be corrected using this informa-
    tion. There are other airport elements that were
    not included in this study, e.g., runway mark-
    ings, taxiway guidance lines, taxiway holding
    positions, taxiway intersection markings,

9                                            White Paper
You can also read