SPRINT-SARI AUS Report on COVID-19 Admissions to the Intensive Care Unit in Australia
←
→
Page content transcription
If your browser does not render page correctly, please read the page content below
For further information
                                                                                                                      Please contact
                                                                                         Dr Aidan Burrell - aidanburrell@gmail.com
                                                                                              Prof Andrew Udy - andrew@udy.com
                                                                                  Ms Tessa Broadley - tessa.broadley@monash.edu
                                                                        Australian and New Zealand Intensive Care Research Centre

        SPRINT-SARI AUS Report on COVID-19 Admissions to the
                    Intensive Care Unit in Australia

                                       Summary Report No. 21
                                                   July, 2021

The results in this report have been produced using data from the SPRINT-SARI AUS ICU COVID-19 database, Monash
University. For further information or to contribute to this project, please contact MNHS-Sprint.Sari@monash.edu.

We would like to thank all the research coordinators and data collectors across Australia for providing this data
during the ongoing pandemic. This report of aggregate data will be issued every one to two weeks for the duration
of the COVID-19 pandemic.

Data in this report was extracted on 07 July 2021 at 13:35h and pertains to ICU admissions in Australia reported to
the SPRINT-SARI AUS ICU COVID-19 database between 01 January 2021 and 07 July 2021. At total of 42 patients of all
ages have now had their data entered, from 63 sites across 6 states and 2 territories. Overall, 42 individuals were
PCR-positive for COVID-19.

Patients were initially entered into the database if they were COVID-19 positive on PCR test, or suspected of being
positive at the time of the report. However, after July 01, 2020, patients were only entered if they were PCR positive.

The utmost effort has been made to ensure the highest quality data is being reported. However please note the
following caveats:

    •   The population in this report reflect the sickest patients with COVID-19 infection being managed in the ICU,
        and do not reflect the overall population of COVID-19 positive patients.
    •   Information is complete for all patients.
    •   From the 43 duplicated patients in the overall dataset (considering the whole period of inclusion), 24
        transfers were aggregated into one record, 14 were transferred but no data after transfer is available, and 5
        readmissions were treated as two different admissions.
    •   As the pandemic is ongoing and site contributions evolve, it is possible for trends and distributions to change
        as more data is collected with greater precision. This report is also descriptive and we urge caution in any
        inference particularly around causation.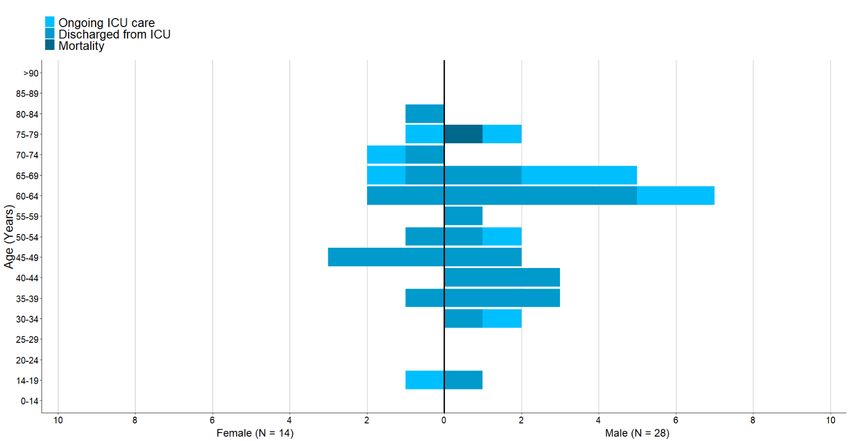
Summary
As of 07 July, 2021, a total of 79 ICU sites were participating in the SPRINT-SARI COVID-19 database, and 63 ICU sites
contributed data. A total of 42 ICU COVID-19 admissions were reported to SPRINT-SARI in 2021. Considering PCR-
positive patients, 42 COVID-19 admissions were reported to SPRINT-SARI. Table 1 provides a breakdown by State and
Territory.

Table 1. Overview by State/Territory – Participation and Admissions
                      Number of ICU Sites                               Number of ICU Admissions
State /           Participating Contributing        Confirmed       Suspected*       Suspected*              Managed* as
Territory                           Data            COVID-19         COVID-19         COVID-19                 COVID-19
                                                                  (Negative swab) (Awaiting swab)           (Negative swab)
NSW                    15               14              19               0               0                         0
VIC                    28               25              10               0               0                         0
QLD                    17               11               4               0               0                         0
WA                      9               7                3               0               0                         0
SA                      5               2                4               0               0                         0
TAS                     2               2                0               0               0                         0
NT                      2               1                2               0               0                         0
ACT                     1               1                0               0               0                         0
Total                  79               63              42               0               0                         0
Notes: *ICU admissions with strong clinical suspicion of COVID-19 (with negative swab or awaiting swab) are managed as
       COVID-19.

        The cohort of 42 confirmed COVID-19 ICU admissions in 2021 includes 28 males and 14 females. The median
        age is 60 years (IQR: 42 to 66 years), ranging from 16 to 83 years. Common comorbidities include diabetes,
        smoking, obesity and use of ACEi/ARB. The most prevalent symptoms at time of admission to hospital are
        cough, dyspnea, fever, fatigue and headache. The main treatments reported at any time during ICU admission
        include steroids, antibiotics, antivirals, high-flow nasal cannula, invasive ventilation and inotropic/vasopressor
        support.

        Of the 42 confirmed COVID-19 patients, outcomes for this cohort as at 07 July 2021 included 1 (2.4%) death,
        18 (42.9%) discharged home, 7 (16.7%) remain in ongoing hospital ward care and 12 (28.6%) remain in ongoing
        ICU care. For the 42 confirmed COVID-19 patients with both ICU admission and ICU discharge dates recorded,
        the observed median length of stay (LOS) in ICU was 4 days (IQR: 3 to 7 days).

        Around 30% of confirmed COVID-19 admissions to ICU received invasive ventilation at some stage during their
        ICU stay. Patients who received invasive ventilation while in ICU had a longer observed median ICU LOS of 9
        days (IQR: 7 to 19 days) with 25.0% of these patients still receiving ongoing ICU care or hospital ward care.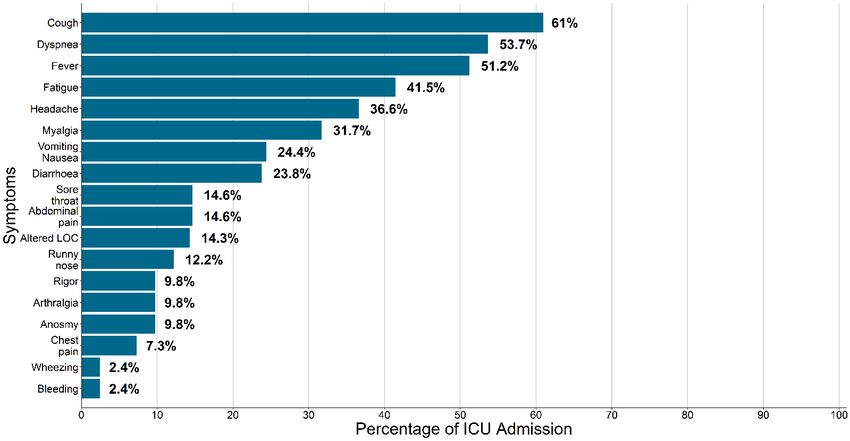
Number of ICU admissions
The daily number of ICU beds occupied by COVID-19 patients are shown in Figure 1 and a State/Territory breakdown
of admissions is presented in Figure 2.

Figure 1. Daily number of ICU beds occupied by patients with
         confirmed or strong clinical suspicion of COVID-19

Figure 2. Cumulative number of ICU admissions with confirmed or
         strong clinical suspicion of COVID-19 by State and Territory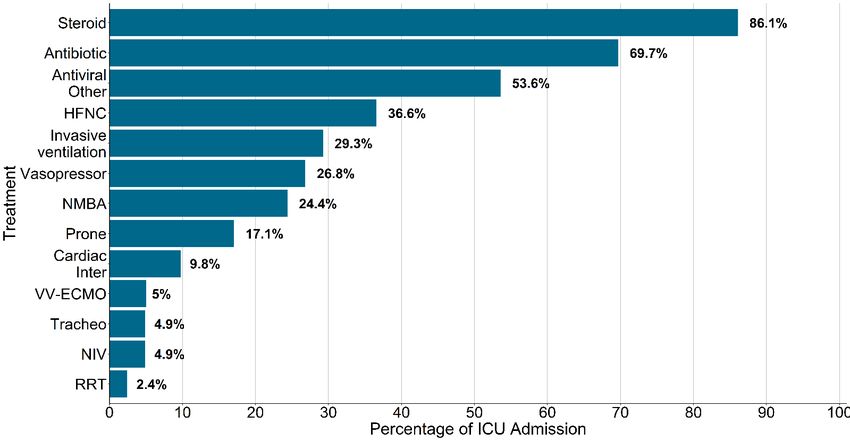
Demographics
Patient characteristics of ICU admission with confirmed COVID-19 are provided in Table 2. This table, and the
remaining sections of this report will focus only on the confirmed COVID-19 admissions. Age and body mass index
(BMI) distributions by sex for confirmed COVID-19 admissions are also provided in Figures 3, 4 and 5.

Table 2. Characteristics of patients admitted to
         ICU with confirmed COVID-19
                                                                         Confirmed COVID-19
               Demographics
                                                                                  Overall
              N                                                                      42
              Age at admission, median (IQR)                                  60.5 (42.5 - 66.0)
              Age group at admission, N (%)
                  0-9 years                                                       0 (0.0%)
                  10-19 years                                                     2 (4.8%)
                  20-29 years                                                     0 (0.0%)
                  30-39 years                                                    6 (14.3%)
                  40-49 years                                                    8 (19.0%)
                  50-59 years                                                     4 (9.5%)
                  60-69 years                                                    16 (38.1%)
                  70-79 years                                                    5 (11.9%)
                  80-89 years                                                     1 (2.4%)
              Sex, N (%)
                  Male                                                           28 (66.7%)
                  Female                                                         14 (33.3%)
              Variant of concern, N (%)
                  None                                                           15 (35.7%)
                  Alpha, B.1.1.7 (UK)                                             3 (7.1%)
                  Beta, B.1.351 (South Africa)                                    1 (2.4%)
                  Gamma, P.1 (Brazil)                                             0 (0.0%)
                  Delta, B.1.617.2 (India)                                       10 (23.8%)
                  Other                                                           2 (4.8%)
                  Unknown                                                        11 (26.2%)
              Received COVID-19 vaccine, N (%)                                  3 / 31 (9.7%)
                  How many doses, N (%)
                   1                                                           3 / 3 (100.0%)
                   2                                                            0 / 1 (0.0%)
                  Type, N (%)
                   Pfizer/BioNTech                                                0 (0.0%)
                   Oxford AstraZeneca                                          3 / 3 (100.0%)
                   Novavax                                                        0 (0.0%)
                   Moderna                                                        0 (0.0%)
                   Other                                                          0 (0.0%)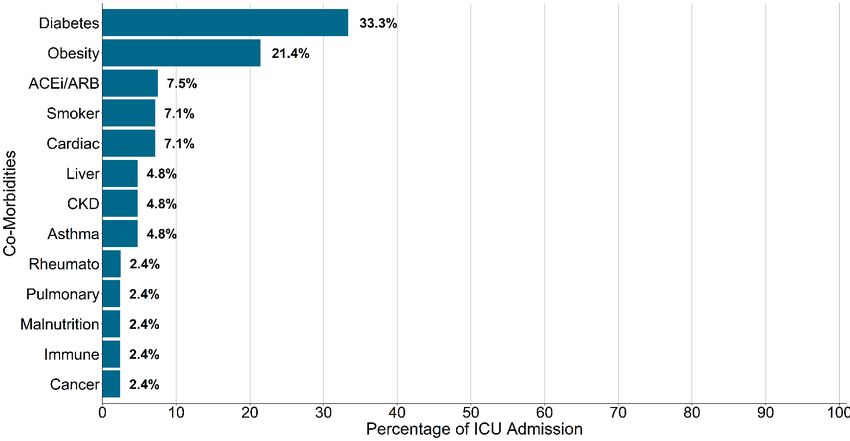
Confirmed COVID-19
 Demographics
                                                                     Overall
 Pregnant, N (%)                                                     0 (0.0%)
 Indigenous, N (%)                                                   0 (0.0%)
 Healthcare worker, N (%)                                            0 (0.0%)
 Admitted from nursing home / aged care hostel, N (%)                0 (0.0%)
 APACHE-II on day 1, median (IQR)                                 7.0 (5.0 - 13.5)
 BMI at admission, median (IQR)                                  29.4 (23.8 - 31.8)
 BMI group, N (%)
  Underweight                                                        1 (2.4%)
  Normal weight                                                     10 (23.8%)
  Overweight                                                         9 (21.4%)
  Obese - Class I                                                   12 (28.6%)
  Obese - Class II                                                   2 (4.8%)
  Obese - Class III                                                  2 (4.8%)
  Not stated                                                         6 (14.3%)
Notes: IQR is the interquartile range presented at the 25th and 75th percentiles. BMI is
calculated for all aged 18 years and over.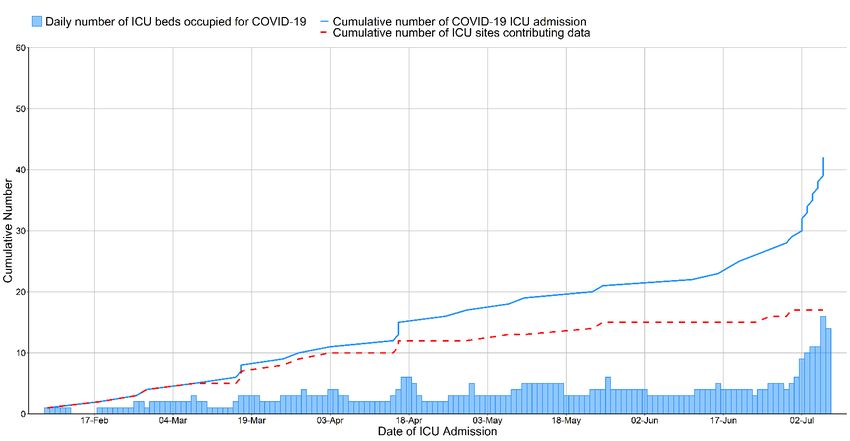
Figure 3. Age and sex distribution – Confirmed COVID-19

Figure 4. Age and mortality distribution – Confirmed COVID-19
Comorbidities
The prevalence of reported comorbidities is summarised in Figures 6 and 7 for ICU admission with confirmed COVID-
19.

Figure 5. Prevalence of comorbidities for admitted Confirmed
         COVID-19 according to the phase

Figure 5.1. Prevalence of comorbidities reported for admitted
         Confirmed COVID-19 according to the phase
Figure 6. Distribution of common combinations of reported
comorbidities – Confirmed COVID-19Symptoms
The prevalence of symptoms reported at hospital presentation is summarised in Figures 8 and 9 for confirmed
COVID-19 admissions.
Figure 7. Prevalence of symptoms reported at hospital presentation
according to the phase – Confirmed COVID-19Figure 8. Distribution of common combinations of reported
symptoms – Confirmed COVID-19Treatments
The treatments received by patients at any time during ICU admission are presented in Figures 10 and 11 for ICU
admissions with confirmed COVID-19.
Figure 9. Treatment reported at any time during ICU admission
according to the phase – Confirmed COVID19Figure 10. Distribution of combinations of the most common
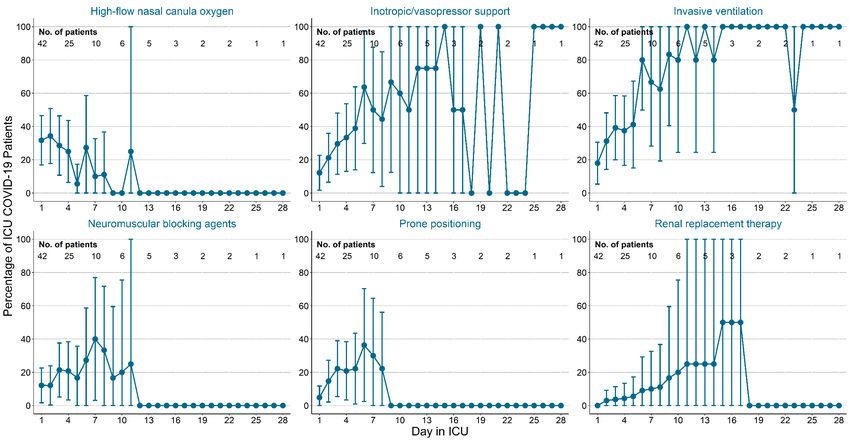
treatments – Confirmed COVID-19Daily Follow-up The SPRINT-SARI database records daily follow-up data for patients during their stay in ICU. The nursing-to-patient ratio for confirmed COVID-19 patients was 1:1 for 80.2% of patients in ICU on any given day. The daily treatments received by confirmed COVID-19 patients during their stay in ICU are presented in Figure 12. Figure 12. Daily treatment while in ICU according to the phase – Confirmed COVID-19
Outcomes
    ICU and hospital outcomes are summarised in Tables 3 and 4 for ICU admission with confirmed COVID-19 and with
    completed outcome data. LOS in ICU for this cohort is provided in Figure 13 and LOS in hospital is provided in Figure
    14.

    Table 3. Patient outcomes according to the phase – Confirmed COVID-19*
                                                         All Confirmed         WITH invasive WITHOUT invasive
    Outcomes
                                                           COVID-19             ventilation     ventilation
    N                                                            42                    12                     30
    Length of ICU stay (days)*
                                                           3.8 (2.8 - 7.1)      9.0 (7.0 - 19.5)        3.1 (1.9 - 4.0)
     Median (IQR)
    Length of stay in hospital (days)*
                                                          12.2 (7.3 - 19.4)    17.1 (13.4 - 21.6)      9.5 (6.2 - 18.5)
     Median (IQR)
    Days of mechanical ventilation (days)**
                                                           5.5 (3.0 - 14.0)     5.5 (3.0 - 14.0)              ---
     Median (IQR)
    Days of non-invasive ventilation (days)**
                                                           1.0 (1.0 - 1.0)       1.0 (1.0 - 1.0)              ---
     Median (IQR)
    Days of ECMO (days)**
                                                         10.5 (10.2 - 10.8)    10.5 (10.2 - 10.8)             ---
     Median (IQR)
    Days of renal replacement therapy (days)**
                                                         16.0 (16.0 - 16.0)a   16.0 (16.0 - 16.0)a            ---
     Median (IQR)
    Patient status, N (%)
        No. with hospital outcome***                         23 (54.7%)            6 (50.0%)             17 (56.7%)
        Ongoing care in ICU                                  12 (28.6%)            3 (25.0%)              9 (30.0%)
        Ongoing care in hospital ward                        7 (16.7%)             3 (25.0%)              4 (13.3%)
        Transfer to other hospital/facility                   0 (0.0%)              0 (0.0%)              0 (0.0%)
        Transfer to rehabilitation                            4 (9.5%)              1 (8.3%)              3 (10.0%)
        Discharged home                                      18 (42.9%)            4 (33.3%)             14 (46.7%)
        Mortality - ICU                                       1 (2.4%)              1 (8.3%)              0 (0.0%)
        Mortality - Ward                                      0 (0.0%)              0 (0.0%)              0 (0.0%)
Notes: This weekly report includes data from 62 sites.

* ICU/hospital LOS is reported as the observed median time between ICU/hospital admission and discharge dates. The
observed LOS is also only calculated for patients with both ICU/hospital admission and discharge dates recorded. IQR is
the interquartile range presented as observed ICU/hospital LOS at the 25th and 75th percentiles.

** Only in patients who received the support

*** A patient with hospital outcome is defined as a patient classified as discharged home, transferred to rehabilitation or
dead
a   Available just in one patient
Table 4. Patient characteristics, with and without invasive ventilation – Confirmed COVID-
19
Confirmed COVID-19 Confirmed COVID-19
WITH invasive ventilation WITHOUT invasive ventilation
Discharged from Discharged
Mortality in ICU Mortality in ICU
ICU alive from ICU alive
N 8 1 21 0
Age at admission, median (IQR) 47.5 (40.2 - 53.2) 77.0 (77.0 - 77.0) 59.0 (41.0 - 63.0) ---
Age group, N (%)
0-9 years 0 (0.0%) 0 (0.0%) 0 (0.0%) ---
10-19 years 0 (0.0%) 0 (0.0%) 1 (4.8%) ---
20-29 years 0 (0.0%) 0 (0.0%) 0 (0.0%) ---
30-39 years 2 (25.0%) 0 (0.0%) 3 (14.3%) ---
40-49 years 4 (50.0%) 0 (0.0%) 4 (19.0%) ---
50-59 years 0 (0.0%) 0 (0.0%) 3 (14.3%) ---
60-69 years 1 (12.5%) 0 (0.0%) 9 (42.9%) ---
70-79 years 1 (12.5%) 1 (100.0%) 0 (0.0%) ---
80-89 years 0 (0.0%) 0 (0.0%) 1 (4.8%) ---
Sex, N (%)
Male 3 (37.5%) 1 (100.0%) 16 (76.2%) ---
Female 5 (62.5%) 0 (0.0%) 5 (23.8%) ---
APACHE-II on day 1, median (IQR) 11.0 (8.0 - 13.0) 25.0 (25.0 - 25.0) 5.5 (4.2 - 8.5) ---
Treatments reported at any time
during ICU, N (%)
Antibiotic 6 (85.7%) 1 (100.0%) 11 (55.0%) ---
Invasive ventilation 8 (100.0%) 1 (100.0%) 0 (0.0%) ---
Inotropic/vasopressor support 7 (87.5%) 1 (100.0%) 1 (4.8%) ---
Neuromuscular blocking agent 6 (75.0%) 1 (100.0%) 0 (0.0%) ---
High-flow nasal canula oxygen 3 (37.5%) 0 (0.0%) 8 (38.1%) ---
Corticosteroid 7 (100.0%) 1 (100.0%) 15 (75.0%) ---
Prone positioning 2 (25.0%) 1 (100.0%) 3 (14.3%) ---
Hydroxychloroquine 0 (0.0%) 0 (0.0%) 0 (0.0%) ---
Renal replacement therapy 0 (0.0%) 0 (0.0%) 0 (0.0%) ---
Non-invasive ventilation 1 (12.5%) 1 (100.0%) 0 (0.0%) ---
Other cardiac intervention 2 (25.0%) 0 (0.0%) 1 (4.8%) ---
Tracheostomy inserted 2 (25.0%) 0 (0.0%) 0 (0.0%) ---
Inhaled nitric oxide 0 (0.0%) 0 (0.0%) 0 (0.0%) ---
Antiviral - Oseltamivir 0 (0.0%) 0 (0.0%) 0 (0.0%) ---
Antiviral - Lopinavir/Ritonavir 0 (0.0%) 0 (0.0%) 0 (0.0%) ---
Antiviral - Other 3 (42.9%) 0 (0.0%) 12 (63.2%) ---
Venovenous ECMO 1 (12.5%) 0 (0.0%) 0 (0.0%) ---
Notes: This weekly report includes data from 61 sites.
IQR is the interquartile range presented as age at the 25th and 75th percentiles.Background In response to the COVID-19 pandemic, the Australian and New Zealand Intensive Care Society Clinical Trials Group (ANZICS-CTG), the Australian and New Zealand Intensive Care Research Center (ANZIC-RC), Monash University, and with international collaborators in Oxford, launched the SPRINT-SARI database. The goal of SPRINT-SARI was to provide near real time, detailed reporting of the sickest patients admitted to the ICU with confirmed or suspected COVID-19 infection. This data will be used to inform the ongoing clinical management of such patients and the public health response. Methods Participating sites across Australia were identified following an expression of interest to ANZICS-CTG affiliated sites, or through previous affiliation with the SPRINT SARI AUS team. The ANZICS-CTG is a well-established research network with highly experienced research coordinators familiar with conducting high quality research studies. The case report form (CRF) had extensive development by local and international clinical experts, and includes standardized data fields that align with our international SPRINT-SARI collaborators. Data in this report was entered by the research coordinator at the participating site. The patients relevant background and presenting symptoms were recorded on the day of study recruitment. Daily follow-up was then completed until discharge from ICU. A final form was competed with details of the hospital outcomes. To support the rapid institution of data collection and reporting, SPRINT-SARI AUS hosts a data platform that includes an electronic data capture system, a secure repository and an analytic framework. Data are entered to a web-based REDCap data management system, securely stored, and used to inform regular reports as above. All analysis was performed by the Monash University team using Stata version 16 (Stata Corp, College Station, Tx, USA) and R statistical software (R Core Team, 2019). Descriptive statistics and bar graphs were reported in this report to summarise patient demographics and clinical characteristics for confirmed COVID-19 patients. Continuous variables have been reported with the mean and standard deviation (SD) or median and interquartile range (IQR) and frequencies and percentages have been presented for categorical variables. In some instances, categories are collapsed due to small numbers and with appropriate clinical input. Length of stay (LOS) in ICU/hospital has been reported as the observed median time from ICU/hospital admission date to ICU/hospital discharge date and the IQR is also presented as observed LOS in ICU/hospital at the 25th and 75th percentiles. Human Research Ethics Committee (HREC) approval for data collection, with a waiver of informed consent, was granted via the National Mutual Acceptance (NMA) scheme, through the Alfred (HREC/16/Alfred/59), or by separate applications to individual sites. Research Governance approval was granted by the Chief Health Officer (CHO) in South Australia and Victoria, and supported by the CHO in Queensland, under legislated public health powers. Individual site Research Governance approvals were granted at all sites where it was required.
Acknowledgements

Participating sites
 ACT          Canberra Hospital*                                      SA           The Queen Elizabeth Hospital
 NSW          Bankstown-Lidcombe Hospital                             SA           Wakefield Hospital
 NSW          Calvary Mater Newcastle*                                TAS          Launceston Hospital*
 NSW          Campbelltown Hospital*                                  TAS          Royal Hobart Hospital*
 NSW          Children's Hospital at Westmead*                        VIC          Albury Wodonga Health
 NSW          Concord Hospital*                                       VIC          Angliss Hospital*
 NSW          John Hunter Hospital*                                   VIC          Austin Hospital*
 NSW          Liverpool Hospital*                                     VIC          Ballarat Base Hospital*
 NSW          Nepean Hospital*                                        VIC          Barwon Health*
 NSW          Prince of Wales Hospital                                VIC          Bendigo Hospital*
 NSW          Royal North Shore Hospital*                             VIC          Box Hill Hospital*
 NSW          Royal Prince Alfred Hospital*                           VIC          Cabrini Hospital*
 NSW          St George Hospital*                                     VIC          Casey Hospital*
 NSW          St Vincent's Hospital Sydney*                           VIC          Dandenong Hospital*
 NSW          Westmead Hospital*                                      VIC          Epworth Richmond*
 NSW          Wollongong Hospital*                                    VIC          Footscray Hospital*
 NSW          Sydney Children's Hospital, Randwick*                   VIC          Frankston Hospital*
 NT           Alice Springs Hospital                                  VIC          Maroondah Hospital*
 NT           Royal Darwin Hospital*                                  VIC          Mildura Base Hospital
 QLD          Bundaberg Hospital*                                     VIC          Monash Children's Hospital*
 QLD          Caboolture Hospital*                                    VIC          Monash Medical Centre*
 QLD          Cairns Hospital                                         VIC          Northeast Health Wangaratta
 QLD          Gold Coast Hospital*                                    VIC          Royal Children's Hospital*
 QLD          Hervey Bay Hospital*                                    VIC          Royal Melbourne Hospital*
 QLD          Ipswich Hospital*                                       VIC          St Vincent's Hospital Melbourne*
 QLD          Logan Hospital*                                         VIC          Sunshine Hospital*
 QLD          Mater Misericordiae Limited                             VIC          The Alfred Hospital*
 QLD          Princess Alexandra Hospital*                            VIC          The Northern Hospital*
 QLD          Queensland Children's Hospital                          VIC          Warrnambool Base Hospital*
 QLD          Redcliffe Hospital*                                     VIC          Werribee Mercy Hospital*
 QLD          Royal Brisbane and Women's Hospital*                    WA           Bunbury Hospital
 QLD          Sunshine Coast University Hospital (ICU and             WA           Fiona Stanley Hospital*
              PCCU)*
 QLD          The Prince Charles Hospital*                            WA           Joondalup Health Campus*
 QLD          Toowoomba Hospital                                      WA           Perth Children's Hospital*
 SA           Adelaide Women's and Children's Hospital                WA           Rockingham General Hospital*
 SA           Ashford Community Hospital                              WA           Royal Perth Hospital*
 SA           Flinders Medical Centre*                                WA           Sir Charles Gairdner Hospital*
 SA           Flinders Private Hospital                               WA           St John of God Midland*
 SA           Lyell McEwin                                            WA           St John of God Murdoch
 SA           Royal Adelaide Hospital*

Notes: All sites have Ethics approval either under NMA (The Alfred Hospital) or local HREC authority. All sites have governance
authority to enter data either through jurisdictional Enhanced Surveillance or through local governance approval.
*The site contributed data during this reporting period.
Statistical analysis and reporting team Aidan Burrell Monash University, DEPM, SPHPM, ANZIC-RC Andrew Udy Monash University, DEPM, SPHPM, ANZIC-RC Tony Trapani Monash University, DEPM, SPHPM, ANZIC-RC Jamie Cooper Monash University, DEPM, SPHPM, ANZIC-RC Ary Serpa Neto Monash University, DEPM, SPHPM, ANZIC-RC Tessa Broadley Monash University, DEPM, SPHPM, ANZIC-RC Susannah Ahern Monash University, DEPM, SPHPM, Registry Science and Research Arul Earnest Monash University, DEPM, SPHPM, Registry Science and Research Breanna Pellegrini Monash University, DEPM, SPHPM, Registry Science and Research Farhad Salimi Monash University, DEPM, SPHPM, Registry Science and Research Jessy Hansen Monash University, DEPM, SPHPM, Registry Science and Research
You can also read