Effect of Dam Construction on Vegetation Cover and Shoreline: A case study
←
→
Page content transcription
If your browser does not render page correctly, please read the page content below
International Journal of Engineering Research and Technology. ISSN 0974-3154, Volume 13, Number 7 (2020), pp. 1686-1691
                             © International Research Publication House. http://www.irphouse.com

     Effect of Dam Construction on Vegetation Cover and Shoreline: A case
                                    study
                              Shivangi Mishra1, Priyanka Dhurvey2, Subha Sinha3*, Pallav Kumar4
                              1,3,4
                                      Assistant Professor, MIT Muzaffarpur, Muzaffarpur – 842003, India.
                              2
                               Assistant Professor, MANIT Bhopal – 462003, Madhya Pradesh, India.

Abstract                                                                    is used in EIA. Some of them are; data management, overlay
                                                                            analysis and trend analysis. The other purposes it can serve is
Geographical Information System (GIS) as a tool for
                                                                            to act as sources of data sets for mathematical impact models,
environmental impact assessment (EIA) has gained the interest
                                                                            habitat and aesthetic analysis, for public consultation. Recently,
of researchers in the last two decades. The present research is
                                                                            the use of GIS in EIA has increased extensively for the purpose
aimed at studying the effect of dam construction on vegetation
                                                                            of data preparation, analysis/modeling and generating results in
cover and dam shoreline under two scenarios: (b) before-and-
                                                                            computational analysis. GIS have also been used for the
after dam construction and (a) three consecutive years after
                                                                            presentation of environmental baseline information and project
dam construction, using GIS. With this motivation, dam under
                                                                            description, through the preparation of thematic maps for the
construction on Lower Subansiri river is considered for the
                                                                            several environmental descriptors. Also, the overlay of baseline
research. To discern the changes before dam construction,
                                                                            information maps with project layouts is frequently used for
images are obtained using Landsat 4, for the year (1999) before
                                                                            impact identification. GIS also enable the use of a set of simple
dam construction. However, Landsat 7 is used for obtaining the
                                                                            operations such as overlay, classification, interpolation,
change in trend of vegetation and dam shoreline over the years
                                                                            aggregation of spatial information that can generate additional
from 2009 to 2011, after dam construction. Normalized
                                                                            information to support impact prediction. The overview on
Difference Vegetation Index (NDVI) and Normalized
                                                                            application of GIS as a tool in different fields developed the
Difference Water Index (NDWI) are calculated for different
                                                                            interest of authors to further use this tool in impact assessment
years using Red-Green-Blue (RGB) bands and Near-Infra-Red
                                                                            of dam construction on vegetation cover and dam shoreline
(NIR). It is observed that there is substantial decrement in
                                                                            areas around the Lower Subansiri river.
vegetation cover and significant increment in dam shore line
due to the construction of dam. The decrement in the vegetation
cover over three consecutive years are found to be 35% and
                                                                            LITERATURE REVIEW
80% and increment in dam shoreline are found to be 17% and
33%, taking first year as base among three consecutive years,               A review of literatures conducted towards use of GIS as a tool
with area under consideration of 30*30 km2. The approach                    for environmental impact assessment for different projects is
given in the present study can be useful in quantifying the                 given here. Sahin and Kurum (2002) assessed the impact of
changes in vegetation cover and dam shore line over the years,              dam constructions on the areas having higher landscape value
using GIS. The results may be helpful in predicting any chances             using GIS for Seyhan Kopru Hydroelectric Dam project.
of danger or hazard to the environment for such projects.                   Amdihun (2008) made an attempt to study the environmental
                                                                            impacts of Finchaa irrigation project using GIS and remote
Keywords- Normalized Difference Vegetation Index (NDVI),
                                                                            sensing techniques. The parameters such as natural
Normalized Difference Water Index (NDWI), Remote Sensing,
                                                                            environment, soil/land and water quality were considered in the
GIS.
                                                                            study. Normalized vegetation index (NDVI) was used as basis
                                                                            to identify the spatial and temporal change of vegetation
                                                                            biomass in the study area. For discerning the changes, the
INTRODUCTION
                                                                            satellite images of different years were used in the study. This
GIS as a tool is having a wide range of application in different            helped in identification of the vegetation cover with the
area of research. Specifically, in the field of Civil Engineering,          expansion of the irrigation in Finchaa valley. In another study
it has become a potential tool for usage in different stages of             by Adel and Ryutaro (2007), maximum likelihood supervised
Environmental Impact Assessment (EIA). It has an integrative                classification and post-classification change detection
framework which can be classified into different steps. The                 techniques were applied to Landsat images, for the images
major steps in the entire framework are; generation, storage,               which were obtained different years. The years selected for the
and display of the thematic information related to the                      study were 1987 and 2001 to map land cover changes in the
vulnerability/sensitivity of the affected resources. The impact             Northwestern coast of Egypt. A supervised classification
prediction of any affected resources can be done with various               technique was employed to obtain the six reflective bands for
evaluation tool, which will be helpful in decision support. From            the two images separately. Another study by Yaw et al. (2003)
analytical perspective, there are several purposes for which GIS            put an emphasis on assessment of negative impacts of Volta

                                                                     1686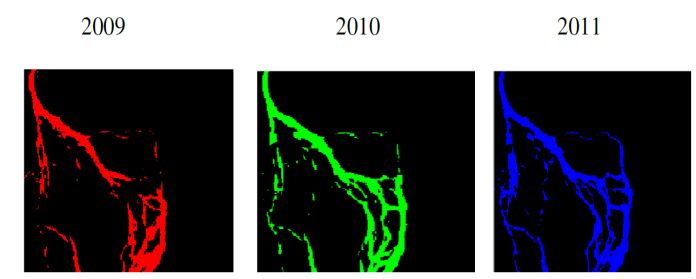
International Journal of Engineering Research and Technology. ISSN 0974-3154, Volume 13, Number 7 (2020), pp. 1686-1691
                             © International Research Publication House. http://www.irphouse.com

River Project, Ghana using remote sensing as a tool to ascertain           the present study is conducted with primary objective to assess
the impacts. The study further obtained Landsat Thematic                   the effect of dam construction on vegetation growth and dam
Mapper (TM) and Enhanced Thematic Mapper (ETM+)                            shoreline for Lower Subansiri river, in Assam.
floating scenes of May 1985 and June 2000 from the United
State Geological Survey (USGS) Department. The study area
was then subseted using Erdas Imagine subset tool. Jain et al.             STUDY AREA
(2002) proposed an index-based approach, which is based on
                                                                           The Subansiri Lower Dam is officially named Lower Subansiri
the factors responsible for soil erosion. The factors considered
                                                                           Hydroelectric Power Project (LSHEP), is a gravity dam on the
are; soil type, vegetation, slope and catchment properties such
as drainage density and form factor. A case study is made to               Subansiri River in northeastern India. This project is located at
illustrate the approach, where catchment area was selected                 2.3 km upstream of Gerukamukh village in Dhemaji district
                                                                           and Lower Subansiri district on the border of Assam and
immediately upstream of the Ukai Reservoir located on the
                                                                           Arunachal Pradesh states. The project has aquired 3180 ha area
River Tapi in Gujarat State, India. The combined effects of
                                                                           of land, including 1333 Ha forest land, and 2867 ha area under
parameters are evaluated to find different areas vulnerable to
                                                                           submergence. As forest area is greatly affected, there is an
soil erosion. Based on the study, two watersheds were
identified as most susceptible to soil erosion. Integrated index           impact caused on the flora and fauna of the area. The species
was used as basis and recommended to provide a priority rating             are facing trouble by permanent increase in the water turbidity
                                                                           as an outcome of the dam construction. The excavation works
of the watersheds for soil conservation planning. Dewan et al.
                                                                           has caused changes in the streambed structures which in turn
(2009) studied the changes in land use/cover changes and urban
                                                                           has affected the creatures living there negatively; even resulted
sprawl for Greater Dhaka, Bangladesh. The evaluation of
changes in the just-mentioned attributes were made between                 in their death.
1975 and 2003 considering satellite images and socio-
economic data. The spatial and temporal changes in land
use/cover changes were quantified using three Landsat images.              MATERIAL AND METHODS
Moreover, a supervised classification algorithm was made                   The steps involved for analysis are given below:
using change detection algorithm in GIS. The accuracy of the
Landsat-derived land use/cover maps ranged from 85 to 90%.                  1. Images have been taken from glovis (glovis.usgs.gov) and
It was attributed based on analysis that significant growth of                 cropped around the dam location in size of (402 402)
built-up areas in Greater Dhaka for the period of study has                    pixels, resolution in 30 km. Images for the year 1999 and
resulted into considerable decrease in water bodies, cultivated                2010 have been taken for change detection. This collection
land, vegetation and wetlands. The expansion of urban land has                 includes images from Landsat 4 TM and Landsat 7,
been largely due to change in elevation, exponential population                respectively for the years just mentioned. All the Landsat
growth and higher level of economic development. The study                     sensors utilize World Reference System-2 (WRS-2). From
also concluded that the rapid expansion in urban area through                  the website, Red, Green, Blue (RGB) Band and Non-
infilling of low-lying areas and clearing of vegetation cover has              Infrared (NIR) images were obtained. Landsat 7 data is
created negative impact on environments and habitat quality.                   used for three years; 2009, 2010 and 2011.
Rokni et al. (2014) conducted a case study on Lake Urmia                    2. Images which have been used were not aligned in the same
during the period of 2000 to 2013. This case study was done                    coordinate system since they were obtained from two
with a motive to model the spatio-temporal changes in Lake                     different sources as Landsat 4 and Landsat 7. The
Urmia. To fulfill the objective multi-temporal images were                     alignment process is done using “i2k Align software.
collected from Landsat 5-TM, 7-ETM+ and 8-OLI images.
While doing so, different satellite-derived indices such as                 3. Once the images were aligned, it was given as input to
NDWI, MNDWI, NDMI, WRI, NDVI, and AWEI were                                    MATLAB software and their DN number were generated.
investigated for the extraction of surface water from Landsat                  Later, using those DN numbers, NDWI and NDVI were
data. Among the different indices, NDWI was found                              calculated using the formula given in successive two steps.
performing better compared to other indexes. Therefore, it was              4. Normalized Difference Water Index (NDWI) was
used as basis to model the spatiotemporal changes in the lake.                 developed for the extraction of water features from
Additionally, a new approach was proposed, which is based on                   Landsat imagery. It can be calculated as:
Principal Components of multi-temporal NDWI (NDWIPCs).
Further, it was evaluated for identification of change detection                 NDWI = (Green − NIR)/ (Green + NIR)                    .(1)
in surface water. Hegazy et al. (2015) made an attempt to assess
land use changes using GIS. The case study was conducted in                 5. The normalized difference vegetation index (NDVI) is a
Mansoura and Talkha for the time period of 1985 to 2010. An                    simple graphical indicator that can be used to analyze
analysis on change detection for built-up area was made. The                   remote sensing measurements, typically but not
change in built-up area was found to have increased                            necessarily from a space platform, and assess whether the
significantly over the year, from 28 to 255 km2, however,                      target being observed contains live green vegetation or not.
agricultural land has reduced significantly. Based on the time                 It can be calculated as:
series data of changes, future prediction is done by using the
Markov chain analysis.                                                             NDVI = (NIR− Red)/ (NIR+ Red)                      …(2)

With the background and motivation from previous literatures,               6. The logical images of NDWI and NDVI were obtained

                                                                    1687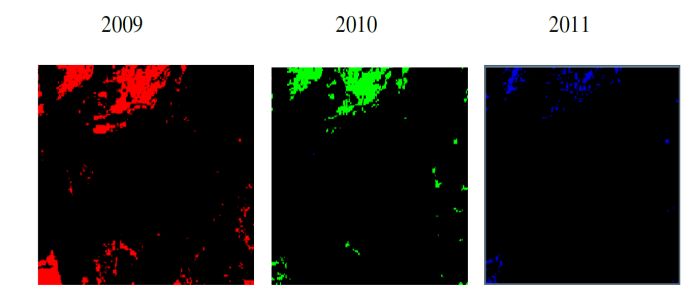
International Journal of Engineering Research and Technology. ISSN 0974-3154, Volume 13, Number 7 (2020), pp. 1686-1691
© International Research Publication House. http://www.irphouse.com
using MATLAB coding. The values of NDWI and NDVI In the subsequent subsections, the aforementioned three
which were smaller than 0 were designated as ‘0’ showing analysis are provided:
no change in the vegetation or dam shoreline. However, Analysis of Images for the Year Before Dam Construction:
the values greater than 0 were designated as ‘1’ showing 1999
the change in the vegetation or dam shoreline. For this
The six steps shown in methodology section were followed for
purpose, ‘XOR’ operation of coding language was used.
the year when dam was not constructed. Figure 1 to Figure 6
depicts the images obtained through different steps of
methodology. The images directly obtained from the website
RESULTS AND ANALYSIS
are shown in Figure 1 and Figure 2. NDWI image and NDWI
This section has three parts of analysis: logical images are shown in Figure 3 and Figure 4. The logical
(i) Analysis of images before dam construction images show the places where watershed along the dam
(ii) Analysis of images after dam construction shoreline is affected positively or negatively based on code
generated. Similarly, NDVI image and NDVI logical images
(iii) Changes in vegetation cover and dam shoreline for three
are shown in Figure 5 and Figure 6.
consecutive years
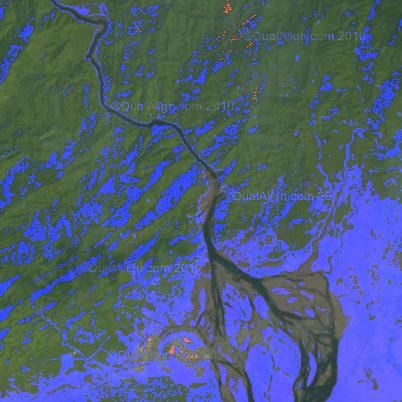
Fig 1.RGB image for year 1999 Fig 2.NIR image for year 1999
Fig 3. NDWI image for year 1999 Fig 4. NDWI logical image for year 1999
Fig 5. NDVI image for year 1999 Fig 6. NDVI logical image for year 1999
1688International Journal of Engineering Research and Technology. ISSN 0974-3154, Volume 13, Number 7 (2020), pp. 1686-1691
© International Research Publication House. http://www.irphouse.com
Analysis of Images for the Year after Dam Construction: and 12 represents the NDVI and NDVI logical images.
2010
The map of the changes in the dam shoreline and vegetation
Similar procedure as shown in previous section was applied for before and after construction of dam is shown in Figure 13 and
the year 2010, just after dam construction. Figure 7 and Figure Figure 14, respectively. From Figure 13, it is observed that dam
8 shows the RBG image of Subansiri Dam and NIR image of shoreline has increased at different places but also, at some
Subansiri Dam, respectively, obtained from website, as places, there are decrements observed. However, in case of
explained in methodology section. Figure 9 and 10 shows the vegetation, as shown in Figure 14, there is considerable
NDWI image and NDWI logical images whereas; Figure 11 decrement in growth.
Fig. 7 RGB image for year 2010 Fig 8.NIR image for year 2010
Fig 9. NDWI image for year 2010 Fig 10. NDWI logical image for year 2010
Fig 11. NDVI image for year 2010 Fig 12. NDVI logical image for year 2010
1689International Journal of Engineering Research and Technology. ISSN 0974-3154, Volume 13, Number 7 (2020), pp. 1686-1691
© International Research Publication House. http://www.irphouse.com
Change Map (Red - increment in Vegitation, Blue - decrement in vegitation, 1999-2010)
Increment in dam shoreline Increment in vegetation cover
`
Decrement in dam shoreline Decrement in vegetation cover
Fig 13. Changes in dam shoreline (1999-2010) Fig 14. Changes in vegetation cover (1999-2010)
Changes in Vegetation Cover and Dam Shoreline over the images of vegetation cover from year 2009 to 2011. The
Years changes are depicted in Figure 16 and Table 2. It can be clearly
identified from Figure 16 that the vegetation cover has been
To understand the changes in vegetation cover and dam
considerably decreased due to the construction of dam over the
shoreline over the years, the logical images were obtained for
years. To quantify this effect in terms of area of vegetation
three consecutive years; 2009, 2010 and 2011. Based on the
cove, area of vegetation cover was obtained based on the pixels
logical images, the area values are calculated using number of
of the logical images generated. If 2009 is considered as base
pixels for the entire area of 30*30 km2 taken into consideration
year, the area of vegetation cover is reduced by 35 % and 80%
for the present study. The changes in dam shore line over the
respectively for the overall area of 30*30 km2 taken into
years are depicted in Figure 15 and area affected are shown in
consideration. This clearly shows that vegetation cover is
Table 1. The changes can be easily observed through Figure 15
substantially affected due to construction of dam over the years.
for different years. Moreover, if 2009 is considered as base
year, as shown in Table 1, the change in dam shoreline in found
to be have increased by 17 % (in terms of area) for the year
Table 2. Change in Area of Vegetation Cover
2010 and 33% (in terms of area) for the year 2011, which is
from year 2009 to 2011
considerably high.
Year Vegetation Change in Surface
Cover (meter2) (meter2)
2009 96060 -
- 34140
- 77580
2010 61920
- 43440
2011 18480 -
Fig 15. Change in Dam Shoreline Logical images
from 2009 to 2011
Table 1. Change in Area of Dam Shore line
from year 2009 to 2011
Year Dam Shoreline Change in surface Area
(meter2) (meter2)
2009 93240 -
2010 109200 +16000 +31090
Fig 16. Change in Vegetation Cover from 2009 to 2011
+15090
2011 124290 -
On similar lines, analysis is carried out for change in logical
1690International Journal of Engineering Research and Technology. ISSN 0974-3154, Volume 13, Number 7 (2020), pp. 1686-1691
© International Research Publication House. http://www.irphouse.com
CONCLUSION 6, Issue: 5, pp. 4173-89, May 2014.
GIS has become a tool of great importance for analyzing the [7] Sahin S. and Kurum E., “Erosion risk analysis by GIS in
trends of images of change in natural slopes of river, vegetation environmental impact assessments: a case study Seyhan
cover, flood prediction, mitigation measures, and so on. Kopru Dam construction”, Journal of Environmental
Considering the usefulness of this tool, present study is focused Management, Vol 66, pp. 239-247, 2002.
on change detection due to dam construction at Lower
[8] Yaw, T.A., Andrew, M., Tommy, C.M. “Management
Subansiri dam in Assam. The changes in vegetation cover and
of Watersheds with Landsat TM Data: A Case Study of
shoreline of Lower Subansiri river, before and after the
the Volta River in Ghana”, Geoscience and Remote
construction of dam is assessed using images from satellite data
Sensing Symposium, IEEE International, Vol. 2, pp.
in GIS. Based on the changes in images over the years, NDVI
1004-1006, 2003.
and NDWI are calculated to identify the effect of dam
construction on vegetation and dam shoreline. The changes in
the images shows a significant impact due to dam construction
on the area of 30*30 km2 under consideration in the present
study. The effect on vegetation and dam shoreline is calculated
for three consecutive years; 2009, 2010 and 2011. The analysis
showed significant increase in dam shoreline area and
significant decrease in vegetation growth due to construction of
dam. The increment in dam shoreline were found to be 17%
and 33%, respectively for years 2010 and 2011, when
compared with year 2009 for 30*30 m2 area considered in the
present study. Similarly, the decrement in vegetation growth
are found to be 35% and 80 %, for the years 2010 and 2011
comparing with year 2009, which is also substantially high. The
steps and approach of image analysis presented in the study can
be useful in examining environment impact assessment for
similar kind of projects.
REFERENCES
[1] Amdihun,A. “GIS and Remote Sensing Integrated
Environmental Impact Assessment of Irrigation Project
in Finchaa Valley Area”, Impact of Irrigation on Poverty
and Environment in Ethiopia, Draft Proceeding of the
symposium and exhibition, Ethiopia, pp. 400-417, 2008.
[2] Adel, S. and Ryutaro, T. “Remote sensing and GIS for
mapping and monitoring land cover and land-use
changes in the Northwestern coastal zone of Egypt”,
Applied Geography, Vol. 27, Issue 1, pp 28-41, 2007.
[3] Dewan A.M., Yamaguchi Y., “Using remote sensing
and GIS to detect and monitor land use and land cover
change in Dhaka Metropolitan of Bangladesh during
1960–2005”, Environmental Monitoring and
Assessment, 150, pp. 237-249, 2009.
[4] Hegazy, I.R., Kaloop, M.R. “Monitoring urban growth
and land use change detection with GIS and remote
sensing techniques in Daqahlia governorate Egypt”,
International Journal of Sustainable Built Environment,
Vol. 4, pp. 117–124, February 2015.
[5] Jain S.K., Goel, M. K., “Assessing the Vulnerability to
Soil Erosion of the Ukai Dam Catchments using Remote
Sensing and GIS”, Hydrological Sciences Journal, Vol.
47, Issue 1, pp. 31-40, February 2002.
[6] Rokni K., Ahmad A., Selamat A., Hazini S., “Water
Feature Extraction and Change Detection using
Multitemporal Landsat Imagery”, Remote Sensing, Vol.
1691You can also read