DSpark 2020 in review - Tourism & Transport Forum
←
→
Page content transcription
If your browser does not render page correctly, please read the page content below
DSpark 2020
in review.
A review of insights gathered by DSpark on the important topics of 2020
including the effects of COVID-19 on travel in and around central business
districts, international tourism and retail, as well as an analysis on the effects
of the Australian Black Summer bushfires on tourism to regional areas.
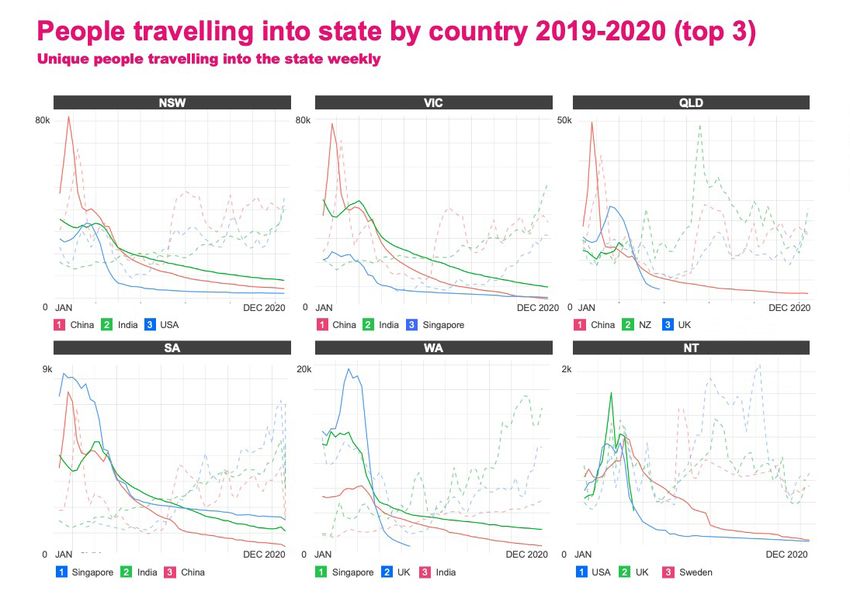
Table of
                                              contents.
                                              03 Introduction.

                                              04 Relative change in unique daily worker volumes in
                                                 Australian central business districts (CBDs) in 2020.

                                              06 Relative change in unique daily road users on Australian
                                                 central business district (CBD) links in 2020.

                                              08 Relative change in unique daily visitors to Australian
                                                 central business districts (CBDs) by mode of transport
                                                 in 2020.

                                              10 Top 3 international visitors by Australian states in 2020.

                                              12 2020 retail example: Chadstone Shopping Centre.

                                              15 2019-2020 Australian Black Summer bushfires analysis.

                                              20 Conclusion.

2   DSpark 2020 in review | dsanalytics.com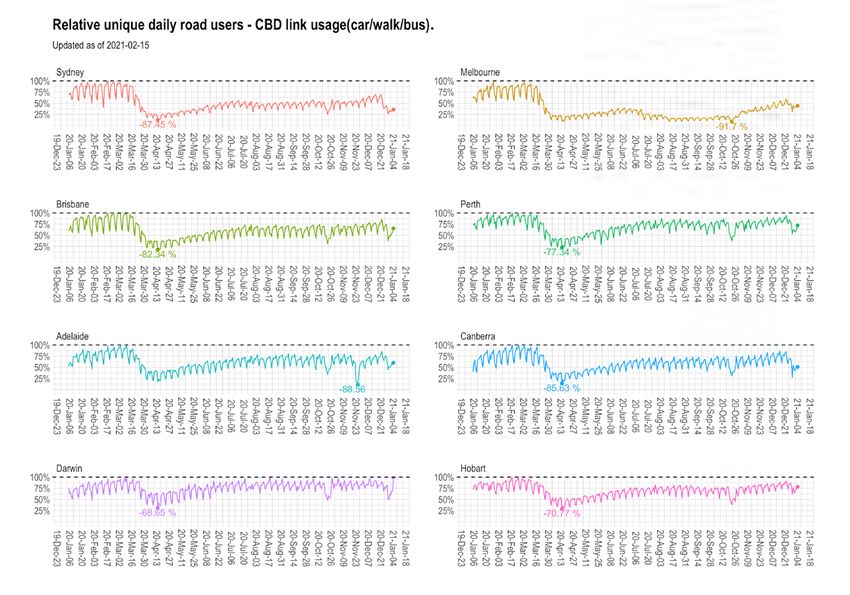
Introduction.
             Marked by a global pandemic on a scale that       The first confirmed case of COVID-19 in
             has not been seen for over 100 years, 2020        Australia was detected in Victoria on the
             was a year unlike any other in recent history.    25th of January 20202. By the end of the year,
             The year began with Australians experiencing      some Australian states had experienced two
             an unusually intense bushfire season that         waves of COVID-19 and the total number of
             displaced approximately 65,000 people1, with      COVID-19 cases reached 28,4083. Both the
             the majority of displacements occurring in        bushfires and COVID-19 had drastic impacts
             Victoria, New South Wales, the Australian         on the country and affected various aspects
             Capital Territory and South Australia. The        of Australian life such as work in cities, tourism
             Black Summer fires left regional cities and       (on both a domestic and international scale)
             towns devastated, not only due to homes           and retail. Utilising our anonymised
             being destroyed but also due to the sharp         telco-sourced data4, DSpark was able to
             decline in tourism to bushfire affected areas.    gather insights into how these industries were
             As the news of the Australian bushfires took      affected as a result of COVID-19 and the
             world headlines by storm, a new threat            bushfires. This report highlights some of
             emerged in the form of severe acute respiratory   our observations.
             syndrome coronavirus 2 (SARS-CoV-2).

            Interested in learning more about observations from 2020? Read on to find out.

3   DSpark 2020 in review | dsanalytics.com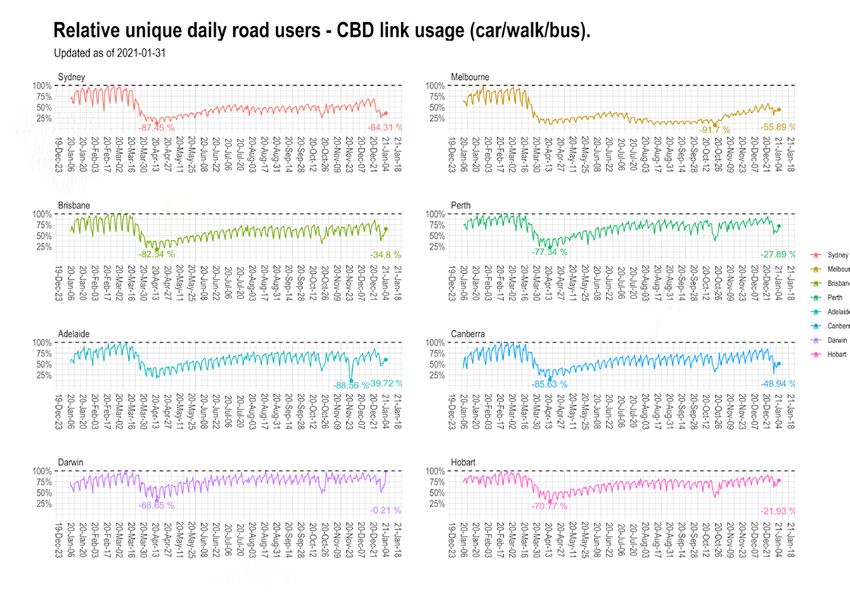
Relative change in
    unique daily worker
    volumes in Australian
    central business districts
    (CBDs) in 2020.
    Interested in the number of unique daily
    workers commuting into Australian CBDs,
    DSpark performed an analysis on each
    Australian capital city. Data from February
    2020 was used as a baseline to mitigate
    anomalous data due to school holidays in
    January, and also because COVID-19
    began to affect the Australian economy
    in the month of March. Essentially,
    February was the only month in 2020 that
    was indicative of a typical year (i.e. a year
    without a pandemic). To be considered a
    worker, a requirement was set for visitors
    to stay in the CBD for at least 2 hours
    between 8:00 AM and 7:30 PM.

4   DSpark 2020 in review | dsanalytics.com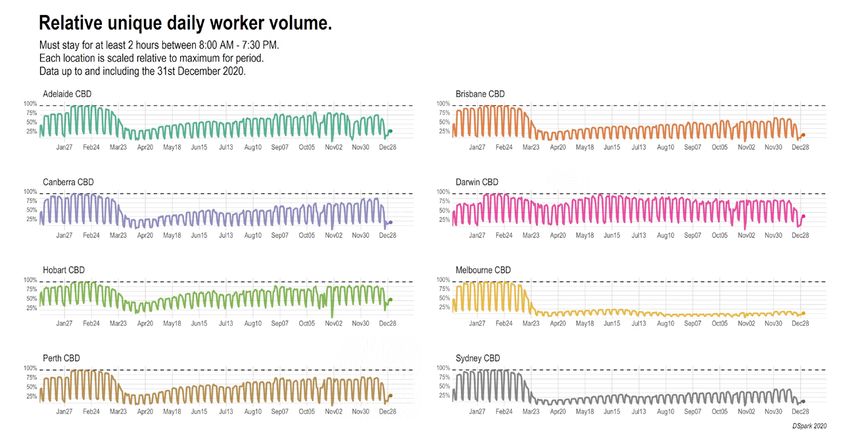
Relative change in unique daily worker volumes in Australian central business
    districts (CBDs) in 2020.
    It can be observed in Figure 1 that unique daily worker volumes (relative to the February 2020 baseline) in each CBD decreased
    markedly when the COVID-19 pandemic was announced by the World Health Organisation in March5 except for Darwin CBD,
    which remained relatively populated throughout the year. Workers gradually returned to CBDs throughout the year, with the
    exception of the Melbourne and Sydney CBDs. Interestingly, unique daily worker volumes did not return to February levels even
    in states that were less affected by COVID-19, which may provide an interesting insight into the future of workers in CBD offices.

    Figure 1. Relative change in unique daily worker volumes in Australian CBDs.
5   DSpark 2020 in review | dsanalytics.com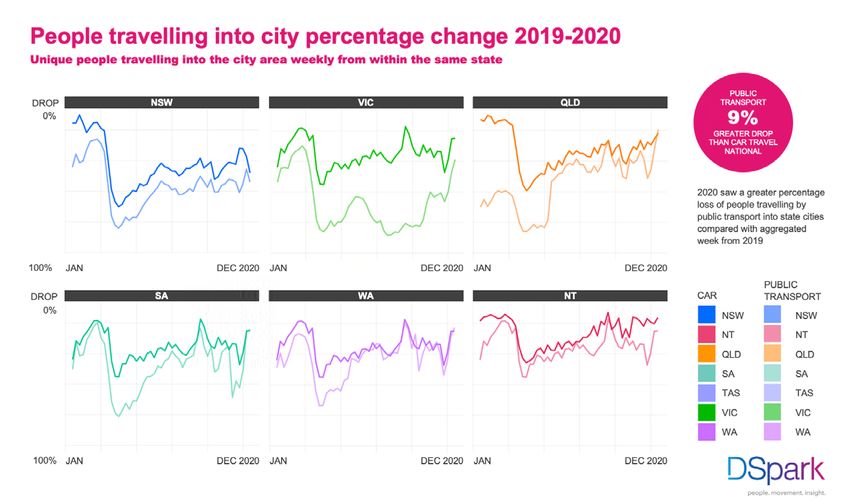
Relative change in
    unique daily road users
    on Australian central
    business district (CBD)
    links in 2020.

                DEFINITION:
                Link – A piece of road
                between two intersections.

    In a similar vein, DSpark was interested
    in determining the change in CBD road
    usage during the year. Analysing usage
    of CBD links in each capital city painted
    an interesting picture not too dissimilar
    to the relative unique daily worker
    volumes. Similar to the relative daily
    unique worker volumes analysis it was
    observed that when the pandemic was
    announced in March, road usage
    decreased across all CBDs, with Darwin
    CBD again being the least affected.

6   DSpark 2020 in review | dsanalytics.com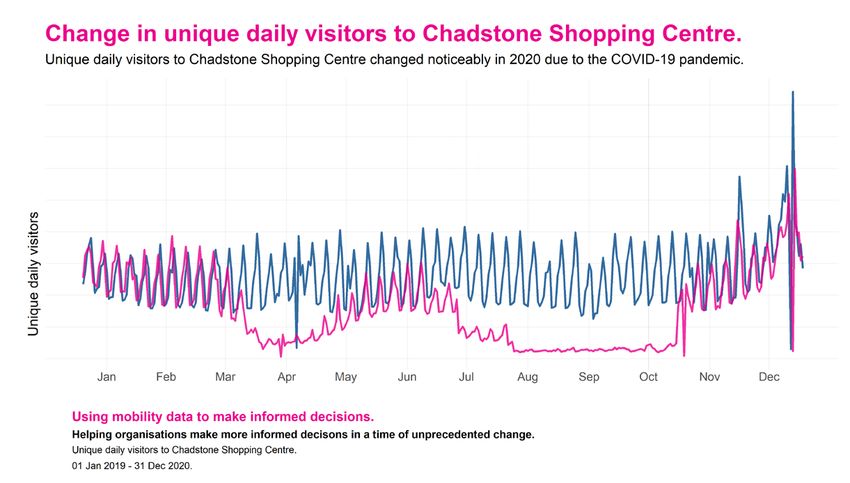
Relative change in unique daily road users on Australian central business district
    (CBD) links in 2020.
    Despite Victoria and New South
    Wales experiencing the highest
    number of COVID-19 cases in
    Australia6, and as result
    experiencing the greatest
    decrease in relative unique
    daily worker volumes to the
    Sydney and Melbourne CBDs,
    relative unique daily road users
    in Melbourne and Sydney
    were observed to decrease to
    a lesser extent compared to
    the change in relative unique
    daily worker volumes. At their
    lowest points, the Sydney and
    Melbourne CBDs experienced
    a –87.45% and –91.70%
    decrease in CBD link usage,
    respectively. For Sydney this
    occurred two weeks after the
    pandemic was announced and
    in Melbourne this year-low
    point occurred during mid-
    October when the 5 km travel
    restriction was in effect.           Figure 2. Relative change in unique daily road users using CBD links.

7   DSpark 2020 in review | dsanalytics.com
Relative change in unique
daily visitors to Australian
central business districts
(CBDs) by mode of
transport in 2020.
Performing an analysis of travel into
Australian CBDs by mode of transport it
was observed that when the pandemic
was announced in March by the World
Health Organisation, the number of
travellers who caught public transport
into the CBDs dropped by as much as
~85% in the states of New South Wales,
Victoria and Queensland. A sharp drop of
approximately 80% of travellers travelling
via public transport into the South
Australian CBD was observed, followed
by a 75% drop in Western Australia and a
50% drop in the Northern Territory.
8 DSpark 2020 in review | dsanalytics.comRelative change in unique daily visitors to Australian central business districts (CBDs) by
mode of transport in 2020.
Comparing public
transport travel to car
travel into the CBDs, it
can be seen in Figure 3
that whilst there was a
reduction of travellers
using both modes of
transport into state CBDs,
travel by car into the
CBDs deteriorated to a
lower degree compared to
public transport as
visitors may have decided
to utilise car travel as a
less-risky alternative (if
they decided to keep
travelling into the CBD).
Figure 3. Year-on-year comparison of unique daily visitors travelling into Australian CBDs by
car and public transport.
9 DSpark 2020 in review | dsanalytics.comTop 3 international
visitors by Australian
states in 2020.
As COVID-19 began to make headlines in
early 2020 the effects of the yet-to-be-
announced pandemic were sight unseen,
but as the first quarter of the year
steadily passed and with international
conferences such as Cisco Live 20207
and AWS Summit8 being cancelled it
began to emerge that COVID-19 would
have a prominent effect on tourism and
events. DSpark decided to conduct a
study to determine how international
visitor numbers changed as a result of
the COVID-19 pandemic.
10 DSpark 2020 in review | dsanalytics.comTop 3 international visitors by Australian states in 2020.
As seen in Figure 4, after the
Australian Federal Government
made the decision to close its
borders to non-citizens and
non-residents effective on the
20th of March 20209, international
visitor numbers decreased
sharply. As seen in Figure 4
comparing 2020 to 2019,
international visitor numbers from
the top 3 countries visiting each
state were significantly lower
and a sharp decrease occurred
in February and March when the
pandemic began to make
headlines. It can be seen in the
charts in Figure 4 that
international visitor numbers
have not recovered, unsurprisingly
due to the Australian border
remaining closed. The difference
in visitor numbers is quite
pronounced when comparing
2019 2020
the solid lines (2020) to the
dotted lines (2019). As observed
in Figure 4, the difference in visitor Figure 4. Number of international visitors in Australian states by top 3 countries.
numbers is quite pronounced
when comparing 2020 to 2019.
11 DSpark 2020 in review | dsanalytics.comWhat other
observations were
made in 2020?
12 DSpark 2020 in review | dsanalytics.com2020 retail example:
Chadstone Shopping
Centre.
Featuring over 550 stores10
encompassing everything from
supermarkets, department stores,
specialty food outlets, luxury brands and
the newly developed Hotel Chadstone,
Chadstone Shopping Centre is renowned
for its all-encompassing retail
experience. Attracting millions of
Australians as well as overseas visitors
each year, Chadstone Shopping Centre
measures in at over 200,000m2 giving it
the title of Australia’s largest shopping
centre11. Due to its recognition as a
premier retail experience, the unique
daily visitors to Chadstone Shopping
Centre were analysed and a comparison
between 2019 and 2020 was made to
determine the effect of the COVID-19
pandemic on footfall to the centre.
13 DSpark 2020 in review | dsanalytics.com2020 retail example: Chadstone Shopping Centre.
It can be observed in Figure 5 that unique daily visitors to Chadstone Shopping Centre in 2020 contrasted noticeably to data
from 2019. During the months of January and February visitors in 2020 effectively mirrored 2019 volumes. When the COVID-19
pandemic was announced by the World Health Organisation and a State of Emergency declared by the Victorian Government in
March, unique daily visitors to Chadstone declined by approximately 30% compared to January and February, and fell by a
further 60% in April after Stage 3 restrictions were announced (where residents were only allowed to leave home for four
reasons: shopping for essentials, caregiving, exercise and work or study).
5km travel restriction
COVID-19 pandemic
restriction removed.
declared in Victoria.
Stage 3 restrictions
State of emergency
increased to 25km.
Christmas Day and
declared by WHO.
5km restriction
25km travel
Boxing Day.
introduced.
introduced.
Year
2019 2020
Figure 5. Change in unique daily visitors to Chadstone Shopping Centre.
14 DSpark 2020 in review | dsanalytics.com2020 retail example: Chadstone Shopping Centre.
Interestingly, unique daily visitors to Chadstone recovered in May and June due to lower
COVID-19 cases as a result of the government measures implemented in March. It can
be observed in Figure 5 that the weekday visitor volumes to Chadstone in the months of
May and June edged closer to 2019 volumes, whereas weekend visitor volumes were,
on average, approximately 60% lower. Expectedly, the increase in visitors to Chadstone
Shopping Centre during this two-month period reflected an inverse relationship with
COVID-19 case numbers, which hovered around 10 new cases per day12 after steadily
decreasing in April (where the 5 km travel limit was introduced).
As daily new COVID-19 cases began to increase in Victoria in late June and into July13,
visitors to Chadstone Shopping Centre began to decline. Addressing the increasing
COVID-19 cases, the Victorian government implemented Stage 4 restrictions on the 2nd of
August14, which included the implementation of a 5 km travel limit restriction from people’s
homes. This ultimately led to a sharp but steady decline of daily new cases through the
months of August and September15. Despite this, and due to Stage 4 restrictions remaining
in place, unique daily visitors to the centre remained low in August and September. During
these two months volumes were, on average, 86.23% lower than the previous year. When
the 5 km travel restriction was increased to 25 km in mid-October16, unique daily visitor
volumes rose sharply and quickly began to resemble 2019 volumes, indicating a healthy
recovery of visitor numbers to the centre towards the end of the year.
15 DSpark 2020 in review | dsanalytics.com2019-2020 Australian Black
Summer bushfires analysis.
The 2019-2020 Australian “Black Summer”
bushfire season was unprecedented in its
severity and scope. Approximately 65,000
people were displaced between July 2019 and
February 202017. The fires destroyed over 3,100
homes, affecting over 8,100 people with
potentially longer-term displacement18. It was
estimated that over 17 million hectares of land
were burnt across NSW, Victoria, Queensland,
ACT, Western Australia and South Australia19.
Conservative estimates projected losses of over
1 billion mammals, birds and reptiles
combined20. As the fires occurred in regional
tourism areas such the Blue Mountains in New
South Wales (where approximately 80% was
burnt21) and East Gippsland in Victoria, the
tourism industry was affected and costs to the
industry were estimated to be $4.5 billion22.
In early 2020 DSpark performed an analysis to
investigate the effect of the bushfires on visitor
numbers to key tourism regions. The analysis
was performed over two 3-month periods
(November, December and January) and data
was collected from both 2019-2020 and
2018-2019 to show the year-on-year change.
16 DSpark 2020 in review | dsanalytics.com2019-2020 Australian Black Summer bushfires analysis. Analysing visitor data to the Blue Mountains, DSpark discovered that there were over 60 days where visitor levels were lower compared to the same time in the previous year. This equated to more than 300,000 fewer unique daily visitors over the entire three-month period. At its lowest point, visitor numbers to the Blue Mountains were observed to be nearly 40% lower than the same period in the prior year. Figure 6. Year-on-year change in visitors to Blue Mountains. 17 DSpark 2020 in review | dsanalytics.com
2019-2020 Australian Black Summer bushfires analysis.
   Investigating visitors to the Gippsland Lakes, it was observed that unique daily visitor numbers began to decrease when tourists
   were first warned to evacuate the area on the 23rd of December. When a second warning to evacuate was issued on the 29th of
   December23, visitor numbers can be seen to decrease sharply, ending the year at approximately 50% less visitors compared to
   the same time the year prior. The largest reduction in total unique daily visitor numbers was seen on the 6th of January 2020,
   where numbers were observed to be approximately 15,000 fewer, equating to a 79% decrease in visitors compared to the same
   period the year prior.

   Figure 7. Year-on-year change in visitors to the Gippsland Lakes (East Gippsland).

18 DSpark 2020 in review | dsanalytics.com
2019-2020 Australian Black Summer bushfires analysis.
   Contrasting to the unique daily visitor data for the Blue Mountains and Gippsland Lakes tourism regions, it was observed that
   Kangaroo Island was less affected by the Black Summer bushfires. Visitor levels remained relatively steady during November
   and December with a slight reduction in numbers at the start of December of approximately 15%. When major fires broke out on
   the 3rd and 4th of January, the island experienced a steep decline in visitation numbers with the lowest point occurring on
   January 10th where approximately 1,800 fewer unique visitors visited the island. Between the 4th and 24th of January, Kangaroo
   Island experienced approximately 5,500 less visitors compared to the same period in the year prior.

   Figure 7. Year-on-year change in visitors to Kangaroo Island.

19 DSpark 2020 in review | dsanalytics.com
Conclusion.
            DSpark conducted a number of analyses in 2020 not only with and for our partners, but also to
            share our knowledge of where, when, why and how people moved during the year. Only a handful
            of our studies were presented in this report.

            Whilst 2020 is behind us, the constant journey of gathering and analysing data to infer novel
            insights still lies ahead. As bushfire affected regions continue to grow anew, and with various
            SARS-CoV-2 vaccines currently in production and being shipped to countries for administering to
            citizens, it is currently unknown what insights 2021 will deliver.

            If you are interested in how DSpark can help your organisation create meaningful and novel
            insights based on mobility data, get in touch with us today.

20 DSpark 2020 in review | dsanalytics.com
Elisabeth du Parc, Louisa Yasukawa, “The 2019-2020 Australian Bushfires: From temporary evacuation to longer-term displacement”, 2020, p. 5.
Endnotes 1
2
Department of Health, “First confirmed case of novel coronavirus in Australia”, 25 January 2020.
3
Department of Health, “Coronavirus (COVID-19) at a glance – 31 December 2020”, accessed 19th January 2021.
4
DSpark considers data privacy to be of the utmost importance. We utilise de-identified, anonymised and aggregated data in our products and
services to provide useful insights on where, when, why and how people move. We do not collect any data on persons under the age of 18. For
more information please consult the DSpark Privacy Policy located on our website.
5
World Health Organisation, “WHO Director-General’s opening remarks at the media briefing on COVID-19 – 11 March 2020”, accessed 19th January
2021.
6
Department of Health, “Coronavirus (COVID-19) current situation and case numbers”, accessed 27/01/2021.
7
Guy Campos, “Cisco Live Melbourne cancelled as virus strikes”, AV Magazine, 26/02/2020.
8
Justin Hendry, “AWS cancels Sydney Summit due to coronavirus”, itnews, 05/03/2020.
9
Prime Minister of Australia, “Border Restrictions”, 19/03/2020.
10
Chadstone The Fashion Capital, “About Us”, accessed 08/02/2021.
11
Vicinity Centres, “Chadstone”, accessed 08/02/2021.
12
Department of Health and Human Services, “Victorian coronavirus (COVID-19) data”, accessed 09/02/2021.
13
Department of Health and Human Services, “Victorian coronavirus (COVID-19) data”, accessed 09/02/2021.
14
Yara Murray-Atfield, Joseph Duncan, “Melbourne placed under stage 4 coronavirus lockdown, stage 3 for the rest of Victoria as a state of
disaster declared”, ABC News, 03/08/2020.
15
Department of Health and Human Services, “Victorian coronavirus (COVID-19) data”, accessed 09/02/2021.
16
ABC News, “Daniel Andrews eases Victoria’s coronavirus restrictions on travel, outdoor gatherings, sport, hairdressers and auctions”,
accessed 09/02/2021.
17
Elisabeth du Parc, Louisa Yasukawa, “The 2019-2020 Australian Bushfires: From temporary evacuation to longer-term displacement”, 2020, p. 4.
18
Elisabeth du Parc, Louisa Yasukawa, “The 2019-2020 Australian Bushfires: From temporary evacuation to longer-term displacement”, 2020, p. 4.
19
Parliament of Australia, “2019-20 Australian bushfires – frequently asked questions: a quick guide”, 12 March 2020.
20
Parliament of Australia, “2019-20 Australian bushfires – frequently asked questions: a quick guide”, 12 March 2020.
21
Lisa Cox, Nick Evershed, “It’s heart-wrenching’: 80% of the Blue Mountains and 50% of Gondwana rainforests burn in bushfires”, The Guardian,
17th January 2019.
22
Tamara Thiessen, “Australia Bushfires Burn Tourism Industry: $4.5 Billion as Holidayers Cancel”, 20th January 2020.
23
Vic Emergency, “Residents and visitors to East Gippsland should leave now as fire danger increases”, 29th December 2019.
21 DSpark 2020 in review | dsanalytics.comDSpark 2020 in review. Get in touch with us today. Understand when, why and how people move. We turn mobility data into actionable insights to help you make informed business decisions. dsanalytics.com DSpark considers data privacy to be of the utmost importance. We utilise de-identified, anonymised and aggregated data in our products and services to provide useful insights on where, when, why and how people move. We do not collect any data on persons under the age of 18. For more information on our Privacy Policy please visit dsanalytics.com.
You can also read