Queensland commercial stout whiting (Sillago robusta) fishery: recommended total allowable catch for 2021 - August 2020
←
→
Page content transcription
If your browser does not render page correctly, please read the page content below
Queensland commercial stout whiting (Sillago
robusta) fishery: recommended total allowable catch
for 2021
August 2020

This publication has been compiled by J. Wortmann of Fisheries Queensland, Department of Agriculture and Fisheries

Enquiries and feedback regarding this document can be made as follows:
Email:          info@daf.qld.gov.au
Telephone:      13 25 23 (Queensland callers only)
                (07) 3404 6999 (outside Queensland)
                Monday, Tuesday, Wednesday and Friday: 8 am to 5 pm, Thursday: 9 am to 5 pm
Post:           Department of Agriculture and Fisheries GPO Box 46 BRISBANE QLD 4001 AUSTRALIA
Website:        daf.qld.gov.au

Interpreter statement
             The Queensland Government is committed to providing accessible services to Queenslanders from all culturally and
             linguistically diverse backgrounds. If you need an interpreter to help you understand this document, call 13 25 23 or visit
             daf.qld.gov.au and search for ‘interpreter’.

© State of Queensland, 2020.

The Queensland Government supports and encourages the dissemination and exchange of its information. The copyright in this
publication is licensed under a Creative Commons Attribution 4.0 International (CC BY 4.0) licence.

Under this licence you are free, without having to seek our permission, to use this publication in accordance with the licence terms.

You must keep intact the copyright notice and attribute the State of Queensland as the source of the publication.

Note: Some content in this publication may have different licence terms as indicated.

For more information on this licence, visit creativecommons.org/licenses/by/4.0.

The information contained herein is subject to change without notice. The Queensland Government shall not be liable for technical
or other errors or omissions contained herein. The reader/user accepts all risks and responsibility for losses, damages, costs and
other consequences resulting directly or indirectly from using this information.
Summary
Stout whiting form a single biological stock in Queensland and New South Wales. This assessment
analysed the Queensland commercial harvest and effort to calculate standardised catch rates. The
stout whiting catch rates have increased since 2016 to above the 30 year average. Since 2017, the total
allowable commercial catch (TACC) for Queensland has been 1106 tonnes (t).
Based on the trends in the standardised catch rates, nine recommended total allowable commercial
catch options are presented for consideration by Fisheries Queensland managers and the fishery working
group (Table 1).
Table 1: Recommended 2021 TACC (t) for the Queensland stout whiting fishery
TACC (t)
Target reference point
conservative least conservative
estimate
estimate estimate
1 (relative to fishing years 2010–2015) 1123 1131 1157
2 (relative to fishing years 1991–2020) 1142 1160 1217
3 (relative to fishing years 2011–2020) 1162 1192 1284
1 Introduction
In Queensland, stout whiting (Sillago robusta) are caught by Danish seine and fish otter-trawl methods
between Sandy Cape and the Queensland–New South Wales border. Other than the T4 fishing sector,
no other sectors are licenced to retain stout whiting that are caught as by-catch. The Queensland
commercial fishing sector is identified by a T4 symbol and currently operated by two licensed vessels.
The stout whiting T4 sector is managed by limiting vessel participants and total allowable commercial
catch (TACC) between water depths of 20–50 fathoms. As part of a management trial, a permit was
issued between 2017 and 2020 that allowed the T4 operators to fish within 20 fathoms. The T4 sector
is managed and monitored separately to the trawl-whiting (stout and eastern school whiting) vessels
operating in New South Wales. The T4 sector is also managed separately to the much larger otter-trawl
sectors that target eastern king prawns along Australia’s east coast.
Since 2007 the quota was adjusted annually in response to changes in standardised catch rates and fish
catch-at-age frequencies (Table 1.1). Since 2015, when the age sampling ceased, the TACC was set
based on information from the standardised catch rate analysis. The standardised catch rate analysis
was used to set the TACC for 2016 (O’Neill et al. 2016) and 2017 (Wortmann et al. 2016). Both reports
were published in 2016, with data in O’Neill et al. (2016) up to the end of May 2015 and data in Wortmann
et al. (2016) up to the end of March 2016. Since 2017 the TACC for Queensland has been 1106 tonnes
(t). The TACC has not been adjusted since 2017.
Queensland commercial stout whiting fishery: recommended TAC for 2021 1Table 1.1: Recent history of annual quota changes
Calendar year TACC (t) Catch (t)
2007 1250 930
2008 1350 721
2009 1450 1158
2010 1500 1170
2011 1500 664
2012 1400 784
2013 1350 704
2014 1150 581
2015 1150 787
2016 1090 945
2017 1106 1026
2018 1106 1041
2019 1106 1105
2020 1106 725
Method 1 in O’Neill et al. (2016) and Wortmann et al. (2016) adjusted the following year’s TACC based
on the previous year’s TACC. In 2020, Fisheries Queensland undertook a retrospective analysis and
supported Method 1 as being most appropriate for the T4 fishery based on the following:
• Historically, Method 1 has been used for the quota setting process
• There is minimal risk as the TACC will be reset by a stock assessment every 3 years, and in the
interim years the annual TACC would be adjusted using Method 1 outputs
• The harvest strategy will utilise “hockey stick rules” taking a precautionary approach in setting the
TACC until a biomass of 60% is achieved
The aim of this document is to present harvest and standardised catch rates for the Queensland com-
mercial stout whiting fishery for the period January 1991–May 2020, and the estimated Queensland
TACC for 2021 using Method 1. Results from this study will provide input data for a stock assessment
model.
2 Methods
Data sources included in this study are detailed in Table 2.1.
Table 2.1: Data used in this analysis
Data Years Source
Commercial January 1991–May 2020 CFISH—Logbook data collected by Fisheries Queensland
Wind January 1991–May 2020 bom.gov.au—Bureau of Meteorology
O’Neill et al. (2014)—continuous daily luminous scale of 0
Lunar January 1991–May 2020
(new moon) to 1 (full moon)
Mariott et al. (2014)—seasonal patterns of catch rates cor-
Seasonality January 1991–May 2020
responding to autumn, winter, spring and summer periods
Queensland commercial stout whiting fishery: recommended TAC for 2021 2New data in this analysis since Wortmann et al. (2016) were:
• Commercial harvest data for April 2016–May 2020
• Wind speed and direction for standardised catch rates up to May 2020
• Standardised catch rates up to May 2020.
Fishing year was defined as the months from July to June. For example, the months starting from July
2019 to June 2020 were labelled as the 2020 fishing year, with July being the first fishing month and
June being the twelfth fishing month.
Harvest data were all stout whiting caught and retained by the T4 fishing sector.
For standardised catch rates, data from CFISH logbooks were filtered to obtain daily catch records of
stout whiting for each fishing operation. A fishing operation was defined by a vessel, fishing method and
owner to account for changes in vessel ownership or fishing method. Catch record data were included
or excluded based on the following criteria:
• Excluded catch over multiple fishing days (491 out of 63670 records, 0.8%, 30 out of 30950 t,
0.001%)
• Included catch in 30’ by 30’ logbook grids from w33 to w38 (Fig 2.1, 63479 out of 63670 records,
99.7%, 30202 out of 30264 t, 99.8% )
• Excluded catch for fishing operation 3 (28 records in fishing year 2000, 7 (1 record in fishing year
1997 and 5 records in 1998), 14 (26 records in 1991) and 15 (46 records in 1991 and 9 records in
1992)
• Included records for net shots of zero stout whiting catch (114 out of 11128 records, 1%)
Catch rates of stout whiting were analysed by fishing year and zones between water depths of 20–50
fathoms (Figure 2.1, Table 2.2). An area weighted approach was used to calculate the overall Queens-
land commercial catch rate.
Figure 2.1: Map of the east Australian stout whiting fishery analysis zones
Queensland commercial stout whiting fishery: recommended TAC for 2021 3Table 2.2: Zone definitions for catch rate standardisation
30 by 30 minute logbook grid Zone Name
w32, w33, x32, x33 w33 Fraser Island waters
w34, x34 w34 Fraser Island waters
w35, x35 w35 Sunshine Coast to Double Island Point waters
w36, x36 w36 Caloundra waters
w37, w38, w39, x37, x38, x39 w38 Stradbroke Islands and Gold Coast waters
The catch rate model was a hierarchical generalized linear model (HGLM), (Appendix 1 of O’Neill et al.
(2016)). This model was used because the T4 fleet is small (there were only 2–5 vessels fishing per
year) and the HGLM model allowed for unequal variances between vessels and the random occurence
of zero catch. Factors (daily data) in the catch rate standardisation were:
• seasonality (Appendix A)
• fishing year (from logbooks)
• zone (from logbooks)
• fishing operation (from logbooks)
• hours fished (from logbooks)
• lunar (Appendix A)
• water depth (from logbooks)
• fishing experience (Appendix A)
• wind speed and direction (Appendix A)
• the use of sonar (Appendix A).
Standardised catch rates were calculated in the statistical software GenStat (VSN International 2019).
Catch rates were in kilograms per boat day and were scaled relative to the overall mean catch rate for
1991–2020.
The TACC was given by:
TACCk+1 = min(TACCk × θk+1 , 1363) (2.1)
! 1x
Ī
θk+1 = (2.2)
Itarget
where
• TACCk is the total allowable commercial catch in year k
• 1363 was the Maximum Sustainable Yield (MSY) in tonnes estimated in O’Neill et al. (2014). This
value is treated as a maximum for quota due to data uncertainty and literature recommending
quotas be set below MSY (O’Neill et al. 2016)
• Ī is the indicator, from the average of the Queensland commercial catch rates in years k and k − 1
• Itarget is the target reference point:
1. target 1 = an average standardised catch rate of 1.0 from the fishing years 2010–2015 from
O’Neill et al. (2016) and Wortmann et al. (2016).
2. target 2 = a long term mean of 1.0 across all years 1991–2020
3. target 3 = an average standardised catch rate of 1.0 from the last ten years 2011–2020
reflective of the lifespan of stout whiting
Queensland commercial stout whiting fishery: recommended TAC for 2021 4• x = 1, 2, 3 adjusts the TACC according to the linear, square-root or cube-root transformation. The
cube-root transformation (x = 3) is the strongest to mitigate variance and limit the magnitude of
quota change (the conservative estimate) whereas the liner transformation (x = 1) is the least
conservative method.
3 Results and discussion
Two vessels fished for stout whiting since 2013. In the 2020 fishing year, 1180 t were harvested
(Figure 3.1a). Annual landings averaged 1179 t for the fishing years 2018–2020, which was also the
maximum harvest in the last ten years. Harvests illustrated by calendar years are summarised in
(Figure 3.1b).
a) Harvest by fishing year
2000
harvest (t)
1500
1000
500
0
1990 2000 2010 2020
fishing year
b) Harvest by calendar year
2500
2000
harvest (t)
1500
1000
500
0
1990 2000 2010 2020
calendar year
Figure 3.1: Reported commercial T4 harvest in Queensland January 1991–May 2020—TACC settings
are shown on subplot b
From 2011–2020, most of the effort (days fished) was in the ‘w38’ fishing zone (offshore waters from
around the Stradbroke Islands and Gold coast; Figure 3.2). Prior to the year 2000, the bulk of the fishing
effort was focused in the Sunshine Coast to Double Island Point waters (zone ‘w35’) (Figure 3.2). This
pattern then shifted north to Fraser Island waters (zones ‘w33’ and ‘w34’) from 2001–2010 and then to
southern waters (zone ‘w38’) 2011–2020. Fishing for stout whiting was closed in zone ‘w38’ between
2001 and 2009.
Queensland commercial stout whiting fishery: recommended TAC for 2021 5w33
w34 n
0.8
0.6
Zone
w35
0.4
0.2
w36 0.0
w38
1990 2000 2010 2020
Fishing year
Figure 3.2: Proportion of boat-days for the Queensland fishery in Queensland waters January
1991–May 2020
The addition of a factor for zone adjusted catch rates down from the reported-observed catch rates from
2015 onwards (Figure 3.3). The parameter estimate from the catch rate model for zone w38 was high,
indicating that if there was fishing in this zone, then the annual catch would be high. The catch rate
standardisation model assumed an average spatial pattern of fishing, thus in the later years, when most
fishing was in zone w38 (Figure 3.2), the model adjusted catch rates down. The addition of fishing
experience adjusted catch rates up in the years before 1997 and adjusted catch rates down in the years
from 2014 onwards. The effect of sonar is only seen in years before 1997 as it was completely adopted
by 2000. In early years with no sonar it would have been harder to find fish, thus catch rates were
adjusted upwards.
reported
year:zone
year:zone:season
1.4 year:zone:season:op
year:zone:season:op:hrs
year:zone:season:op:hrs:lunar
relative catch rate (proportion)
year:zone:season:op:hrs:lunar:depth
year:zone:season:op:hrs:lunar:depth:exp
year:zone:season:op:hrs:lunar:depth:exp:sonar
year:zone:season:op:hrs:lunar:depth:exp:sonar:wind
1.2
1.0
0.8
1990 2000 2010 2020
year
Figure 3.3: Influence of each factor in the commercial standardised catch rates for stout whiting in
Queensland January 1991–May 2020—in the legend ‘op’ is fishing operation, ‘hrs’ is hours fished and
‘exp’ is fishing experience
Queensland commercial stout whiting fishery: recommended TAC for 2021 6The 2020 catch rate index was above the long term mean (Figure 3.5) and fishing zones w33–w36
exhibited increasing catch rates in recent years (Figure 3.4). Catch rate diagnostics are in Appendix A.
w33 w34
2.5
2.0
1.5
1.0
relative catch rate (proportion)
0.5
0.0
w35 w36
2.5
2.0
1.5
1.0
0.5
0.0
1990 2000 2010 2020
w38
2.5
2.0
1.5
1.0
0.5
0.0
1990 2000 2010 2020
fishing year
Figure 3.4: Annual relative standardised catch rates and 95% confidence interval for each zone of the
Queensland stout whiting fishery January 1991–May 2020
2.0
relative catch rate (proportion)
1.5
1.0
0.5
0.0
1990 2000 2010 2020
fishing year
Figure 3.5: Annual relative standardised catch rates and 95% confidence interval for the Queensland
stout whiting fishery January 1991–May 2020
The calculations of the 2021 TACC covered a range of settings outlined in Table 1. The estimated 2021
TACC increased from the 2020 TACC of 1106 t by between 17 and 178 t, giving an estimated TACC for
2021 of between 1123 and 1284 t. Uncertainty in the TACC estimates should be considered as they
were sensitive to the data inputs and assumptions.
The proposed harvest strategy for the Queensland stout whiting fishery will consist of a stock assess-
ment (due 2021) that will be run every three years. The aim of the stock assessment is to inform thesetting of the TACC so that the fishery achieves or maintains a biomass of 60%. In the years between
stock assessments, the quota calculations from this study will be used to guide the TACC setting.
References
Mariott, Ross J., Michael F. O’Neill, Stephen J. Newman, and Craig L. Skepper (2014). “Abundance
indices for long-lived tropical snappers: estimating standardized catch rates from spatially and tem-
porally coarse logbook data”. In: ICES Journal of Marine Science: Journal du Conseil 71.3, pp. 618–
627. URL: http://icesjms.oxfordjournals.org/content/71/3/618.full.pdf.
O’Neill, Michael F. and George M. Leigh (2014). Queensland Stout Whiting fishery: Commercial quota
setting 2014. Tech. rep. Brisbane: Department of Agriculture and Fisheries.
— (2016). Stout Whiting Fishery Summary: Queensland total allowable catch for 2016. Tech. rep. Bris-
bane: Department of Agriculture and Fisheries. URL: era . daf . qld . gov . au / 5200/ (visited on
06/09/2016).
VSN International (2019). Genstat for Windows 20th Edition. Type: Computer Program. VSN Interna-
tional, Hemel Hempstead, UK. URL: Genstat.co.uk.
Wortmann, Joanne and Michael F. O’Neill (2016). Stout Whiting Fishery Summary: Commercial quota
setting for 2017. Tech. rep. Brisbane: Department of Agriculture and Fisheries. URL: era.daf.qld.
gov.au/5199/ (visited on 06/09/2016).
A Appendix - Standardised catch rates
Wind direction and strength data were sourced by Fisheries Queensland from the Bureau of Meteorology
(bom.gov.au). The wind data were from representative coastal weather stations (Table A.1).
Table A.1: Weather stations used for zones
Station number Station name Zone
40068 Double Island Point Lighthouse w33, w34
40043 Cape Moreton Lighthouse w35, w36
40764 Gold Coast Sedgeway w38
The recorded measures of wind speed (km hour−1 ) and direction (degrees for where the wind blew from)
in each latitude band were converted to an average daily reading based on recordings between 6 am
and 6 pm. From this data the north-south (NS) and east-west (EW) wind components were calculated:
NS = wind speed × cos(wind direction) (A.1)
EW = wind speed × sin(wind direction) (A.2)
where wind speed was in km hour−1 and wind direction was converted to radians.
The wind components were used to test their effect on catch rates for different wind directions and
strengths. The component functions considered the BOM defined wind directions as degrees measured
clockwise from true north.
The influence of lunar phase on catch rates was tested by the addition of a sinusoidal luminance (lunar)
pattern as described by using a continuous daily luminous scale of 0 (new moon) to 1 (full moon) through-out the lunar cycle. A lagged response of catch rates to lunar phase was assessed using a covariate
1
(lunar advance) which advanced the luminance measure seven days (approximately 4 lunar period). The
two variables were modelled together to estimate the variation of catch according to the moon phase
(i.e. contrasting waxing and waning patterns of the moon phase).
Six trigonometric functions modelled an average monthly pattern of catch (Mariott et al. 2014):
! !
2πd y 2πd y
s1 = cos , s2 = sin (A.3)
Ty Ty
! !
4πd y 4πd y
s3 = cos , s4 = sin (A.4)
Ty Ty
! !
6πd y 6πd y
s5 = cos , s6 = sin (A.5)
Ty Ty
where
• d y was the cumulative day of the year
• T y was the total number of days in the year (365 or 366)
Using sine and cosine functions together identified the seasonal patterns of catch rates corresponding
to autumn, winter, spring and summer periods.
Fishing experience was calculated to follow an exponential learning curve:
!
vy
log (A.6)
1 + vy
where v y was the cumulative number of at-sea fishing days divided by 365.25.
The increase in experience was assumed sharpest in the initial fishing years, then levelling out to a limit.
The use of sonar was filled in manually. The fishery had 2–5 vessels per year so the information was
obtainable.
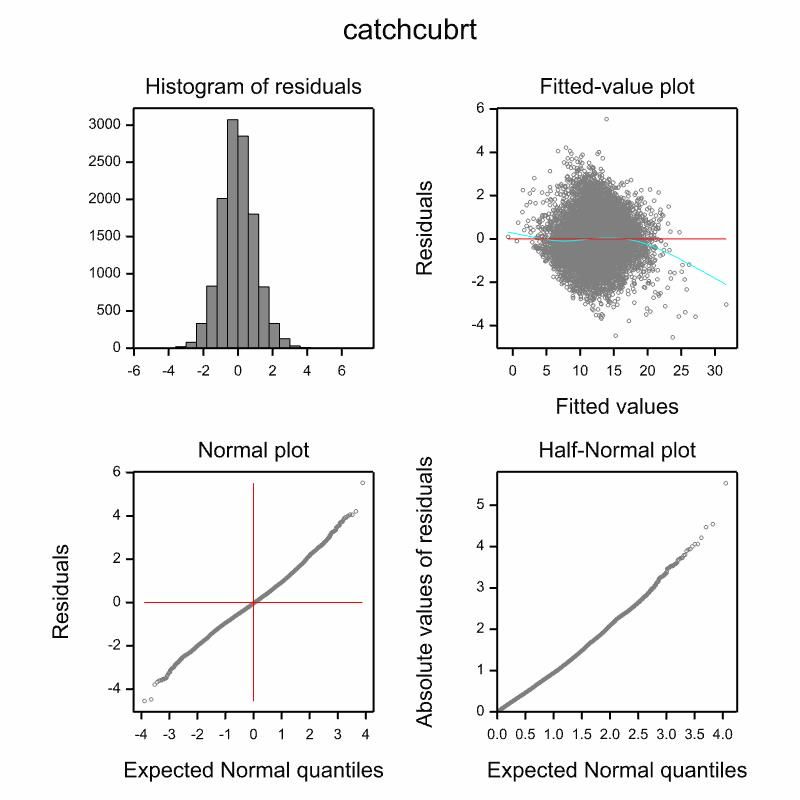
Queensland commercial stout whiting fishery: recommended TAC for 2021 9Figure A.1: Residual checking plots for the hierarchical generalized linear model (HGLM) analysis Queensland commercial stout whiting fishery: recommended TAC for 2021 10
You can also read