Latest Decadal Forecast: 2014-2018 - January 2014
←
→
Page content transcription
If your browser does not render page correctly, please read the page content below
Latest Decadal
Forecast: 2014-2018

January 2014

  280114_MetOffice_DecadalForecast_researchnews_final   -1–
  © Crown copyright 2008
Summary

      •   This paper summarises the outcome of the latest experimental decadal time-
          scale forecast for 2014-2018 made by the Met Office Hadley Centre as part of its
          climate research programme1.
      •   This 5-year forecast is produced from a 10-member ensemble prediction
          system using the latest version of the Hadley Centre’s climate model,
          HadGEM3, initialised with the current state of the climate system (atmosphere
          and ocean) in November 2013.
      •   Both the resolution of the model and the number of ensemble members are
          limited by the current availability of supercomputing power. For these reasons
          the following results should not be over-interpreted.
      •   For this forecast the baseline period has been updated to be 1981-2010
          (compared to 1971-2000 used previously). This provides a more recent context
          and is consistent with our seasonal forecasts and WMO recommendations.
      •   Averaged over the 5-year period 2014-2018, global average temperature is
          expected to remain high and is likely to be between 0.17°C and 0.43°C above
          the long-term (1981–2010) average. This compares with an anomaly of +0.26°C
          observed in 2010, the warmest year on record. There is a reasonable chance of
          new record global temperatures over the next 5 years.
      •   Since the forecast is initialised from the current state of the climate system,
          unlike the climate change projections used in the IPCC AR5, the forecast
          reflects the slightly cooler conditions currently prevailing associated with the
          recent ‘pause’ in global surface warming.
      •   Averaged over the 5-year period 2014-2018, forecast patterns suggest
          enhanced warming over land versus the oceans, and at high northern latitudes
          in line with what is expected from global warming.
      •   There are also indications of a developing pattern of cooling in the north
          Atlantic sub-polar gyre, which suggests that a change in the Atlantic Multi-
          decadal Oscillation may be starting to occur. The implications for the climate of
          the UK and western Europe, if this were to happen, will be explored further in
          the coming months.
      •   A larger ensemble and a deeper understanding of the global temperature pause
          would be needed to robustly quantify the probability of new record
          temperatures and other regional aspects of the forecast.

1
    http://www.metoffice.gov.uk/research/climate/seasonal-to-decadal/long-range/decadal-fc

                                                 2
© Crown copyright 2014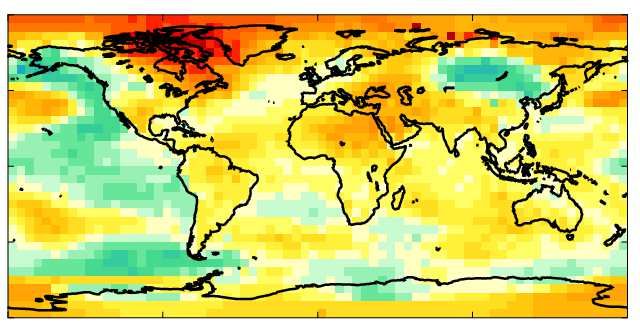
Background
Decadal forecasts are specifically designed to forecast large-scale fluctuations in the
climate system over the next few years through knowledge of the current climate state
and multi-year variability of the oceans. In terms of their application for climate change
policy and to underpin other decision-making, decadal forecasts provide guidance on likely
near-term trends in global and regional quantities2.
Decadal forecasts are produced using state-of-the-art climate models, which include the four
fundamental elements of the climate system: atmosphere, ocean, cryosphere and land
surface. They include a comprehensive representation of the key fluid dynamics,
thermodynamics and radiative transfer. The fundamental physical formulation of these
models is the same as those used for climate change projections. In the case of the Met
Office, the atmospheric component is also the same as that used in global weather
forecasting, in which the model is tested and evaluated on a daily basis.
Decadal forecasts start from the current state of the climate system and include the current
concentrations of greenhouse gases and aerosol loadings in the atmosphere and their
expected evolution over the period of the forecast. However, the forecast outcome, at least in
the first few years, could be dominated by natural variations in the climate system,
predominantly from the ‘weather’ in the oceans, such as ocean currents and phenomena like
El Nino3. Likewise forecasts made, say, a year apart may differ because they start from a
different initial state, and ocean ‘weather’ may evolve differently.
There are analogies between weather forecasting for a few days ahead and longer-term
decadal forecasts for the next few years. When we make a weather forecast we are
predicting what the likely evolution of the global atmospheric circulation will be over the next
few days; when we make a decadal forecast we are essentially predicting ocean ‘weather’ –
in other words how the global ocean circulation will evolve over the next few years and its
subsequent impact on the atmosphere. The different timescales for these forecasts reflects
the differences in density and thermal capacity of air and water, and the much slower
motions in the ocean compared with the atmosphere.
Just as weather forecasts differ depending on what date they are started from, so too do
decadal forecasts. Similarly, just as we increasingly recognize that weather forecasts have to
be probabilistic because of the chaotic nature of the atmosphere, so too do decadal forecasts
because the ocean is also a chaotic system – but chaotic on longer timescales because the
ocean moves much more slowly. A decadal forecast system therefore consists of a number,
often called an ensemble, of forecasts, in this case 10, and the output of the system attempts
to span the range of predicted outcomes.

2
  Smith, D M, Eade, R, Dunstone, N J, Fereday, D, Murphy, J M, Pohlmann, H and Scaife, A A
(2010). Skilful multi-year predictions of Atlantic hurricane frequency. Nature Geoscience, 3, 846-849,
doi:10.1038/ngeo1004
3
   See Research News ‘Decadal Forecasting - What is it and what does it tell us?’ for further
information on the fundamentals of decadal forecasting and the role of ocean ‘weather’.
http://www.metoffice.gov.uk/research/news/decadal-forecasting

                                                3
© Crown copyright 2014
Forecast for 2014 to 2018
The forecast being described here is from the experimental decadal prediction system using
the latest Met Office climate model, HadGEM3, developed as part of the Hadley Centre
Climate Programme. This system is at the cutting edge of research in understanding,
simulating and predicting decadal variability.
HadGEM3 is a higher resolution and more complex model than HadCM3 which formed the
basis of the decadal prediction system prior to 2012. Due to the increased computational
expense of the new model, it is only feasible to run the forecast out for the next 5 years.
Furthermore, the number of ensemble members (10) is also limited by the current availability
of supercomputing power and is substantially less than that used in the Met Office seasonal
forecasting system (42). For these reasons the following results should not be over-
interpreted.
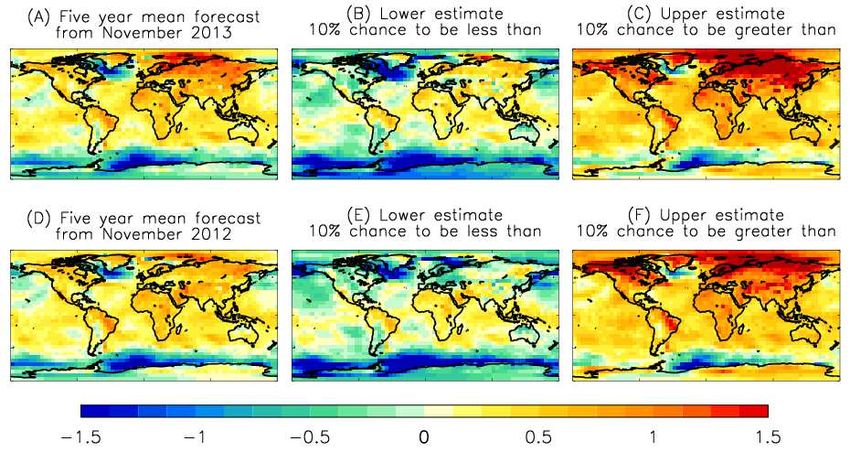
The latest decadal forecast produced in January 2014, for the 5-year period 2014-2018, is
shown in Figure 1 as the set of dark blue lines, each representing an individual forecast from
the 10-member ensemble. For comparison last year’s forecast is shown in light blue lines.
Note that the baseline 30-year mean climatology against which the forecast anomalies have
been expressed has been updated this year from 1971-2000 to 1981-2010, in line with WMO
recommendations and other forecast products.
Figure 1: Global annual temperature record since 1960 and the latest ensemble of
forecasts from the Met Office decadal prediction system produced in January 2014. The
dark blue lines show the evolution of the 10 individual forecasts from this year’s forecast
starting from November 2013 and the pale blue lines the equivalent for last year’s
4
© Crown copyright 2014
forecast. All data are rolling annual mean values. The gap between the black curves and
blue curves arises because the last observed value represents the period November
2012 to October 2013 whereas the first forecast period is November 2013 to October
2014.
The thin black curves show the observed annual-mean time-series from 3 independent
datasets. Previous predictions starting from November 1960, 1965,…, 2005 are shown in
red, and 22 Coupled Model Intercomparison Project phase 5 (CMIP5) model simulations
that have not been initialised with observations are shown in green. In both cases, the
shading represents the probable range, such that the observations are expected to lie
within the shading 90% of the time. All temperatures are represented as anomalies from
the 1981-2010 mean.
The results show that, in agreement with last year’s forecast, global mean temperatures are
expected to maintain the record warmth that has been observed over the last decade.
Averaged over the 5 year period 2014-2018, global average temperature is expected to
remain between +0.17°C and +0.43°C (90% confidence range) relative to the long-term
(1981–2010) mean.
The warmest individual year in the 160-year Met Office Hadley Centre global temperature
record is 2010, with a temperature of +0.26°C compared to the 1981-2010 mean. The
forecast for continued high global average temperatures is largely driven by continued high
levels of greenhouse gases. However, the forecast initially remains towards the lower end of
the range simulated by Coupled Model Intercomparison Project phase 5 (CMIP5) models
(green shading in Figure 1); this is consistent with the fact that the CMIP5 projections have
not been initialised and therefore do not necessarily represent the current state of the climate
system. Recent studies have suggested that multi-decadal variations in the exchange of heat
between the upper and deep ocean appear to have caused at least part of the pause in
surface warming, with the Pacific Ocean potentially playing a key role (e.g. Meehl et al.
2013). Further discussion on the pause in surface warming can be found here4.
During the 5-year period, the latest forecast suggests a high chance of new record global
surface temperatures. However, as Figure 1 emphasises, the interannual variability, due to
phenomena such as ENSO, within each forecast is quite large and the ensemble size is not
yet large enough to quantify robustly the probabilities. Consequently care must be taken not
to read too much from the latest forecast.
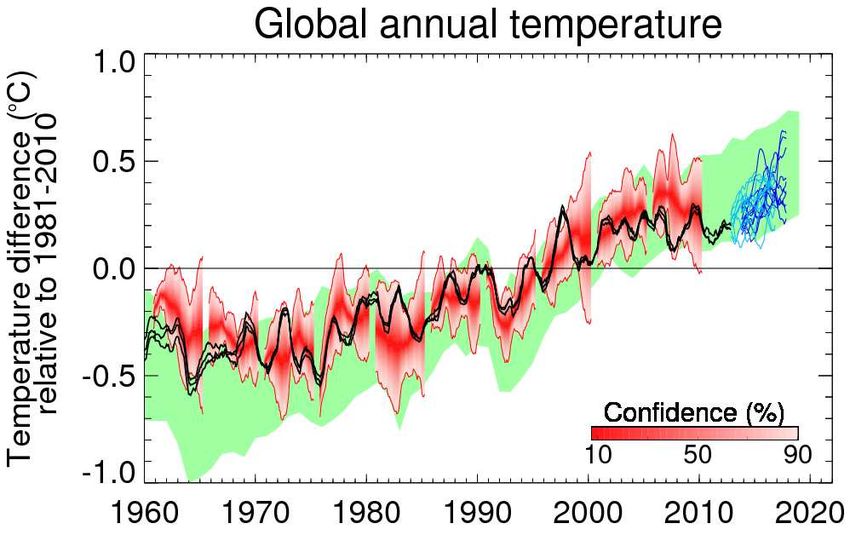
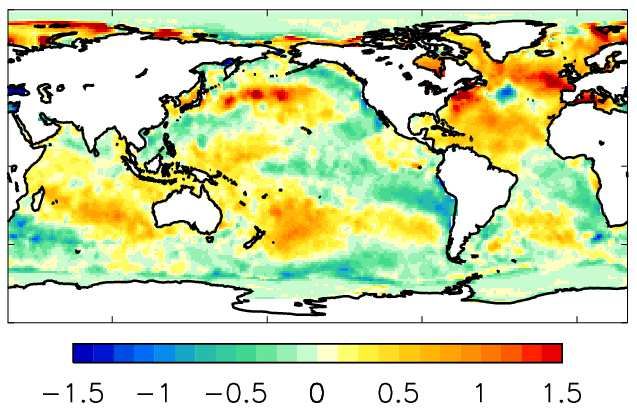
The latest Met Office decadal forecast presented here was started from the observed sea
surface temperature pattern shown in Figure 2, along with similar observations of
temperature and salinity below the ocean surface, and atmospheric winds, temperatures and
surface pressure. The temperatures in Figure 2 show relatively cool conditions across much
of the central tropical Pacific and warmth in the West Pacific and Indian Oceans, cool
conditions in the Southern Ocean, and warm conditions in the North Atlantic. These are
similar to the conditions that prevailed when last year’s forecast was initialised.
4
See Paper 2: The recent pause in global warming (2): What are the potential causes?
http://www.metoffice.gov.uk/research/news/recent-pause-in-warming
5
© Crown copyright 2014o
Figure 2: Observed sea surface temperature differences ( C) relative to 1981-2010 for October 2013.
These, together with similar observations below the ocean surface, have been used as starting
conditions for the latest decadal forecast.
The following maps (Figure 3 A-C) show the difference between the predicted geographical
distribution of temperatures over the period November 2013 to October 2018 and the
climatology for 1981-2010.
Figure 3: Forecast (A) maps of surface temperature differences (oC) relative to 1981-
2010 for the 5-year period November 2013 to October 2018. Forecasts consist of 10
ensemble members starting from November 2013. The probable range is diagnosed from
the ensemble spread, and shown as the lower (B) and upper (C) limits for each 5o grid
box, such that there is a 10% chance of the observations being cooler than (B), and a
10% chance of the observations being warmer than (C). Lower panels (D, E, F) show the
equivalent forecasts issued in December 2012 for the period November 2012 to October
2017 relative to 1981-2010.
6
© Crown copyright 2014Panel A is the average forecast outcome. Panels B and C indicate the range of forecast
temperatures, such that we expect only a 10% chance of temperatures at a particular
location being less than those in B, and only a 10% chance of temperatures being higher
than in C5. For comparison, the equivalent maps (D, E and F) for last year’s forecast are also
shown: these show very similar patterns to the latest forecast. For the period 2014-2018
most regions are expected to be warmer than the average of 1981 to 2010, but regional
cooling is possible over much of the Pacific, North Atlantic and Southern Oceans, and over
some land regions.
All the patterns in Figure 3 show greater warming over most land areas than over the
oceans, and enhanced warming over the Arctic and sub-polar regions, all of which are
consistent with the signature of global warming. One further feature stands out. All the
forecasts show a change to much cooler ocean temperatures in the North West Atlantic. The
latest forecast (Figure 3 A-C) is very similar to the forecast issued a year ago (Figure 3 D-F)
and has reinforced the signal of a switch to colder conditions in the North Atlantic and
Labrador Sea as part of the North Atlantic sub-polar gyre. This area of the North Atlantic has
been exceptionally warm in the last few years (Figure 4), so if these forecasts are correct
then this suggests a change in Atlantic Multi-Decadal Oscillation (AMO) in the coming
decade. Changes in the AMO are known to have climatic impacts over Europe, America and
Africa6; these aspects of the forecast will be investigated in more detail over the coming
months and the implications for the climate of the UK and western Europe will be explored
further.
On the other hand there is little evidence in the forecast (Figure 3) of strong signals related to
the Pacific Decadal Oscillation (PDO), sometimes also referred to as the Interdecadal Pacific
Oscillation. A cold phase of the PDO has been a notable feature of surface ocean
temperatures during the last decade, as Figure 4 indicates. Were this cold phase to continue
as forecast, this would act to moderate global warming in the next few years, as it has over
the last decade7.
There has been a lot of debate recently on the ability of the IPCC Fifth Assessment Report
climate models to predict the current negative phase of the PDO and hence the recent pause
in global surface warming. The key misunderstanding here is that the IPCC climate
projections (shown by the green shading in Figure 1) are not initialised; they are driven by
the long-term external forcings, from greenhouse gases to volcanoes and changes in the
energy received from the sun, and the projections cover many decades. They may well
replicate decadal variability, but as they are not ‘tied’ to the real world in the way initialised
climate predictions are, they do not necessarily simulate any given period of variability at the
time that it happens in the real world. To say the climate models are flawed as a result, would
be like saying that weather forecast models must be wrong because they can’t forecast the
5
Note that these ranges are for each individual location. The chances of these limits being met
everywhere are very small, so the complete patterns shown in diagrams B and C are unlikely to be
realised.
6
Jeff R. Knight, Chris K. Folland, Adam A. Scaife, 2006: Climate impacts of the Atlantic Multidecadal
Oscillation. Geophysical Research Letters, DOI: 10.1029/2006GL026242
7
See Paper 2: The recent pause in global warming (2): What are the potential causes?
http://www.metoffice.gov.uk/research/news/recent-pause-in-warming
7
© Crown copyright 2014weather on a particular day a month ahead.
o
Figure 4: Observed surface temperature differences ( C) relative to 1981-2010 for the 5-year
period November 2008 to October 2013.
Nevertheless, there is good evidence that climate models, including HadGEM3, are able to
simulate decadal variability in the Pacific Ocean that corresponds well with the observed
pattern of the PDO8. There is less evidence so far that there is predictability in the evolution
of the PDO; this may be in part due to limitations in the ocean observing system and in
understanding the drivers of the PDO. This highlights the fact that decadal forecasting is
experimental and challenging. Investigating the predictability of the PDO will be a major
focus for research in the coming year in order to develop improved capabilities in future.
8
Meehl, Gerald A., Aixue Hu, Julie M. Arblaster, John Fasullo, Kevin E. Trenberth, 2013: Externally
Forced and Internally Generated Decadal Climate Variability Associated with the Interdecadal Pacific
Oscillation. J. Climate, 26, 7298–7310. doi: http://dx.doi.org/10.1175/JCLI-D-12-00548.1
8
© Crown copyright 2014Conclusions
Decadal forecasts are specifically designed to forecast fluctuations in the climate system
over the next few years through knowledge of the current climate state and multi-year
variability of the oceans.
Decadal forecasting is immensely valuable, scientifically, because it represents a stringent
test of how well the model simulates natural variability and also how well it captures the
longer-term anthropogenic warming trend. It also has a broad range of potential applications
in terms of policy making and investment decisions.
The latest decadal forecast, issued in January 2014, shows that global temperatures are
expected to maintain the record warmth that has been observed over the last decade, and
furthermore that it is possible that new record global temperatures may be reached in the
next 5 years.
Considering the regional patterns of surface temperatures, the forecasts show a developing
pattern of cooling in the north Atlantic sub-polar gyre which suggests that a change in the
Atlantic Multidecadal Oscillation may occur in the next decade. The implications for the
climate of the UK and western Europe, if this were to happen, will be explored further in the
coming months.
9
© Crown copyright 2014Paper authored by:
Julia Slingo
Stephen Belcher
Adam Scaife
Doug Smith
Jeff Knight
Leon Hermanson
Matt Palmer
Martin Andrews
10
© Crown copyright 2014Met Office Tel: 0870 900 0100 FitzRoy Road, Exeter Fax: 0870 900 5050 Devon EX1 3PB enquiries@metoffice.gov.uk United Kingdom www.metoffice.gov.uk
You can also read