NORTHERN GULF SEASONAL CLIMATE OUTLOOK - Grazier & Landholder Information
←
→
Page content transcription
If your browser does not render page correctly, please read the page content below
NORTHERN GULF SEASONAL
   CLIMATE OUTLOOK
Grazier & Landholder Information
            July 2020
       Northern Australian Rainfall Onset
     predictions released, and is a La Niña a
             possibility of forming?
                     In this issue…
 ❖ Northern Rainfall Onset Predictions
 ❖ ENSO Update: La Niña likelihood increases
 ❖ Rainfall totals across the Northern Gulf region
 ❖ Rainfall outlooks for Spring and into Summer
 ❖ Drought Monitoring across the country
 ❖ Analysis of Current & Future Pasture Growth
 ❖ Temperature projections for North Queensland.
 ❖ Drivers and influences and what is forecast for the
   next few months: ENSO, IOD, MJO

                     John McLaughlin
 NACP Climate Project Officer & Rangelands Project Officer
                   Northern Gulf Region

                                                             1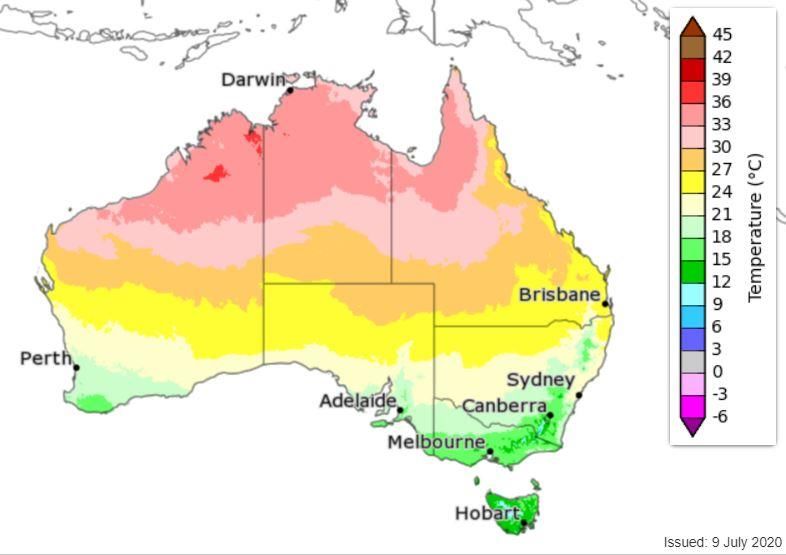
NORTHERN AUSTRALIAN RAINFALL ONSET (NRO)
Early rainfall onset likely for much of northern Australia, though only about a 50% likelihood for
most of North Queensland and the Northern Gulf region (represented by white colouration).
The chance of the first rains for northern Australia arriving early in 2020-21 is higher than average over much
of northern Australia, with the highest likelihood across central Queensland.
The northern rainfall onset outlook gives an indication of whether the first significant rains after 1 September
are likely to be earlier or later than normal. This is the first issue of the Northern Rainfall Onset (NRO) forecast
for the 2020–21 season. The NRO will be updated fortnightly until the end of August.

The median Northern Rainfall Onset for North Queensland and the Northern Gulf
region is mid-November (dark green), or closer to 1st December (pale green).
Influences Impacting Northern Australian Rainfall Onset
Warmer than normal Indian Ocean temperatures, and an increased chance of La Niña in 2020 are
raising the likelihood of an earlier than normal rainfall onset over central northern Australia.
This is due to increased moisture in the atmosphere which can enhance rainfall over the north of the country
when weather patterns are favourable to rain. The ENSO Outlook is at La Niña WATCH, indicating that there
is a 50% chance a La Niña could develop in the coming months – twice the normal likelihood. During La Niña,
the northern rainfall onset typically occurs earlier than usual.
RAINFALL
This issue analyses rainfall totals from across the Northern Gulf region from 31 st June 2019 to 1st July 2020,
and demonstrates broad shortages across the entire region. For most locations within the region rainfall
totals remain in the 20-40th percentiles, reflecting a relatively poor 12-months of rainfall. Normanton was the
only location to receive closer to median rainfall over this period, while the Georgetown areas experienced
totals in the 11th percentile – reflecting an extremely harsh 12-month period.
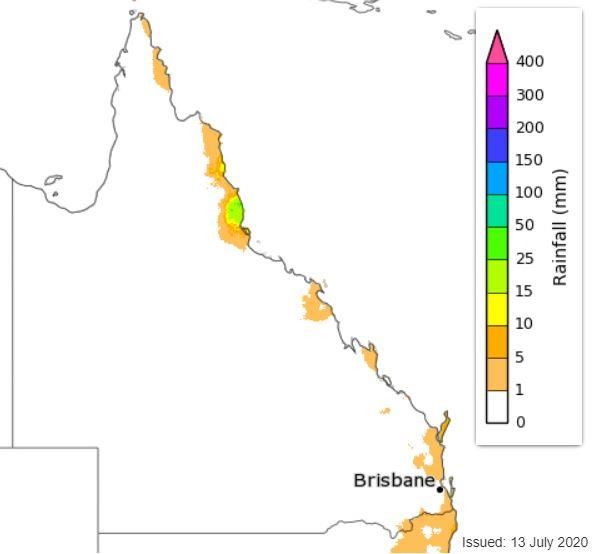
Recent rainfall totals for June and into the start of July are typical for this time of the year, with relatively no
rain falling across the region. The exception to this is Greenvale, that has received good rain over recent weeks.
The rainfall totals for the June-July (2020) period and the 2019-2020 Financial Year at several
Northern Gulf locations are included in the table below:
2019-2020 Financial Year Recent Rainfall
[31st June 2019 – 1st July 2020] [1st June – 13th July 2020]
Location
Median Actual + or - Median Actual + or -
Rainfall
Rainfall Rainfall Rainfall Rainfall
Median (mm) Percentiles Median (mm)
(mm) (mm) (mm) (mm)
Normanton 855 789 -66 43% 1 0 -1
Vanrook Station 897 640 -257 21% 0 0 0
Iffley Station 574 418 -156 23% 0 0 0
Croydon 733 652 -81 34% 1 0 -1
Esmeralda Station 653 501 -152 25% 1 0 -1
Georgetown 756 481 -275 11% 0 2 2
Abingdon Station 808 669 -139 28% 0 1 1
Mt Surprise 737 570 -167 24% 3 2 -1
Forsayth 730 517 -213 19% 2 3 1
Einasleigh 668 597 -71 37% 2 4 2
Greenvale 613 429 -184 19% 6 29 23
Almaden 771 671 -100 35% 0 4 4
Chillagoe 840 673 -167 25% 3 3 0
Dimbulah 716 616 -100 29% 7 5 -2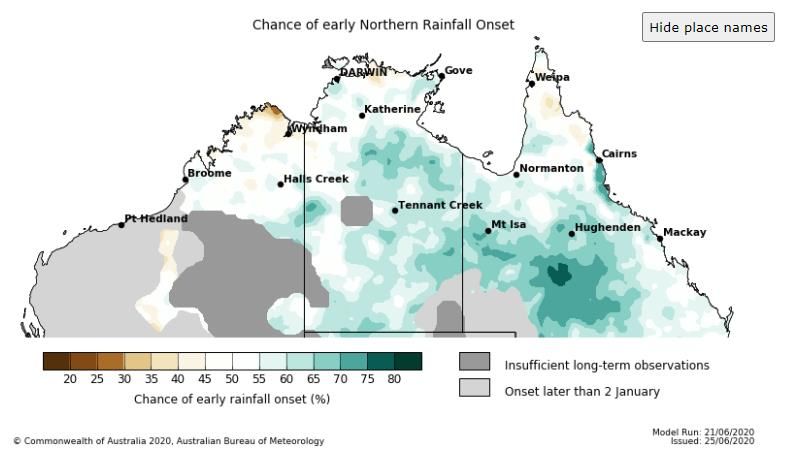
12 Month Rainfall Anomalies
1st July 2010 to 30th June 2020
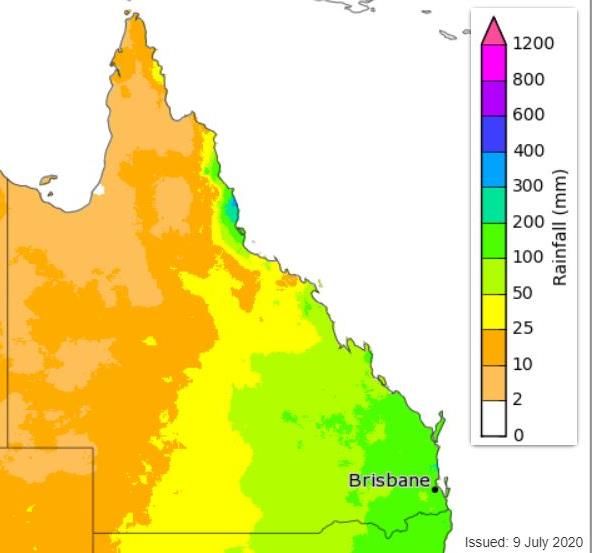
Figure 1 illustrates the Rainfall Anomalies across Queensland for the 12-month period 1st July 2019 to 31st
June 2020. The only consistency across the map is that no areas have a positive anomoly for this period.
The North Queensland and Northern Gulf regions experienced fairly considerable negative rainfall
anomalies over this period. Bright yellow represents between 200-400mm deficits from the median,
while pale yellow regions represent between 100-200mm deficiciencies. Most of south-west and western
Queensland experienced minor negative rainfall anomolies of between 0-100mm. Part of Cape York, the
Cairns Coast, and other areas along the eastern coastline such as Bowen and Rockhampton experienced
rainfall totals of 400m or more below normal levels.
Rainfall anomolies from across Queensland over this period were consistently below normal levels,
particularly across the eastern side of the state, in the south-east and in the North.
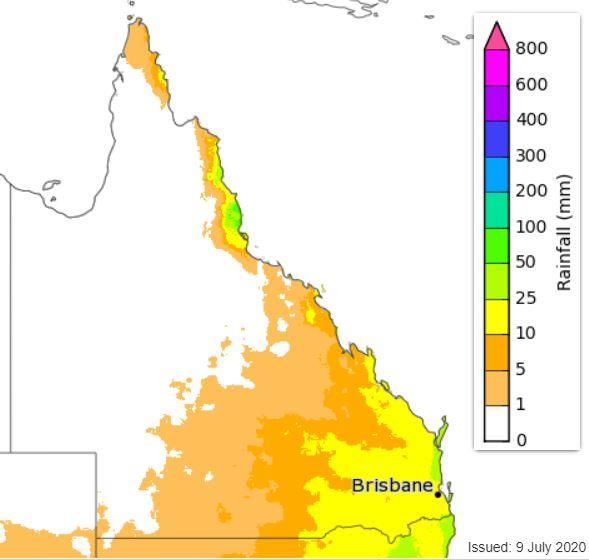
1 Month Rainfall Anomalies
                                            April 2020
Figure 2 illustrates the rainfall anomalies for the month of June 2020 in the Northern Gulf region. As
expected in the dry winter months, rainfall anomalies across North and Western Queensland are
close to normal (which is often near zero). Therefore, the slight grey shade is common across much
of the Queensland rangelands that do not experience winter rainfall, and thus have levels ‘close to
normal’. Storms across Central Queensland (Longreach, etc.) and off the Bowen/Townsville coast did
bring above normal rainfall totals to isolated areas of the state. For those regions that typically do
experience winter rainfall, mostly toward Queensland’s south-east, the absence of rain in June has
bought below median levels throughout the month, represented by shades of yellow on the map.

For North Queensland and the Northern Gulf region, who typically receive very little rain in June,
rainfall anomolies were close to normal with almost no rain falling across the region in this month.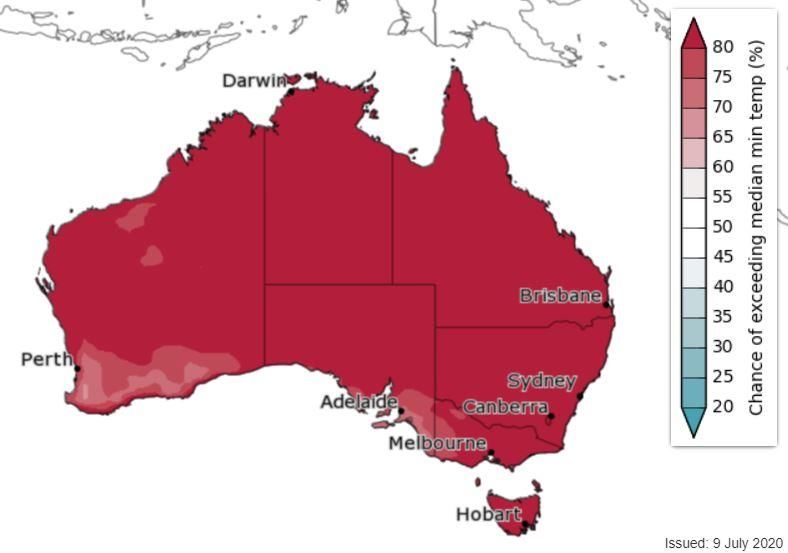
DROUGHT
According to the Bureau of Meterology, most of Queensland is not experiencing any serious form of rainfall
deficency according to the Drough Metric. The first image below demonstrates rainfall deficiencies in the 3-
months from 1st April to 30th June 2020 – with only scattered locations towards Queensland south
experiencing serious or severe rainfall defieciencies. The second image demonstrates rainfall deficiencies
over the past 27 months from 1st April 2018 to 30th June 2020 – similarly, almost no areas in Queenslands
North appear to be experiencing serious or severe rainfall defieincies. Queenslands south-east corner,
however, is experiencing a much wider rainfall shortage at this longer time scale.

Across Australia, there is still a wide expanse of regions expiring serious or severe rainfall
deficiencies. Using the 27-month time period, all states have significant areas impacts by drought
conditions.
PASTURE GROWTH
 Pasture Growth in the Northern Gulf region for the 6-months from January to June 2020 was significantly
varied. Red and orange colours indicate low growth, grey indicates average growth, and green and blue
indicate high growth. This figure [Left] shows a large area of Northern Queensland experienced well-below
or extremely below average Pasture Growth conditions over these 6 months – indicated by the orange and
red colouration. This low growth was reversed moving North or south toward central & western Queensland.
Projecting forward from July to September, the Northern Queensland region can expect seasonally low growth
– indicated by the white colouration. However, given that absolute pasture growth over this period is relatively
low, this is more likely to indicate that the region will miss out on any small level of growth that might be
expected at this stage of the year.

SOIL MOISTURE
Soil moisture was above
average for June for much of
the Northern Gulf Region. This
is likely to be in response to
winter rainfall across much of
this region toward the end of
May.
Soil moisture, together with
sunlight and temperature,
largely      govern     growth
conditions for pasture.
RAINFALL OUTLOOKS (75% probability of occurring*)
Major Australian climate drivers such as the El Niño–Southern Oscillation (ENSO) and the Indian Ocean Dipole
(IOD) are neutral and forecast to remain neutral through Autumn. When these major climate drivers are
neutral, widespread above or below average seasonal rainfall tends to be less likely. Models do indicate a
relatively high probability values of exceeding the long-term median for autumn across much of Northern
Australia – though the outlook is less optimistic for North Queensland which has little to no rain forecast.

2-Week Rainfall Total:
18th to 31st July, 2020

A dry fortnight expected for the Northern Gulf
region, and North Queensland more broadly. The
only rain within the vicinity is forecast for the
coast, with rainfall of 25-50mm expected in and
around the Cairns region.

Monthly Rainfall Total:
August 2020

For the month of August, the Northern Gulf region
is predicted to receive no rainfall. This can be
expected for this month of the year, with median
rainfall levels for much of the region being close to
0.0mm. Areas closer to the east coast might
receive a light shower, with coastal areas expected
to receive rainfall throughout the month. Parts of
south-east Queensland might also experience rain
throughout August.

3-Month Rainfall Total:
August to October 2020

As we push toward Spring in the Northern Gulf
region, the BOM doesn’t appear to offer any
significant rainfall for the region. Between now
and October, most of Queensland can expect
approximately 10mm, though totals do increase as
you head toward the states south-east corner. By
October, the states south-east might have
experienced as much as 100mm.
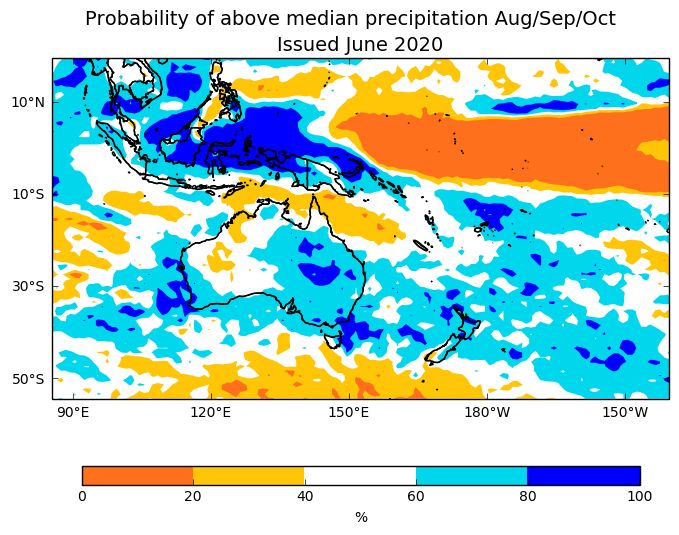
Long-term Rainfall Outlooks – August to December
European Centre for Medium-Range Weather Forecasts (ECMWF) [OCTOBER-DECEMBER]
ECMWF forecast rainfall probability values for northern and eastern Australia – and the region generally for October
to December 2020. At this stage, many regions of Australia indicate 70%-80% probability of above median rainfall
for this seasonal period (Spring→Summer 2020), indicated by the brighter green colouration. This is a hopeful sign
for pastoralists across the country that a strong wet season could be possible

The United Kingdom Meteorological Office (UKMO) Forecast [AUGUST-OCTOBER]
UKMO forecast map displays the probability of getting above median precipitation for the total period August to
October 2020. Regions shaded lighter blue have a 60-80% probability of above median precipitation. Regions
shaded dark blue have an 80- 100% probability of above median precipitation.

The ECMWF and UKMO forecasts suggest above median rainfall is likely for North Queensland and
the Northern Gulf in the medium term (approximately August-December). This will be interesting
to follow as we push past winter and into spring and summer, though there is reason to be
optimistic for graziers.
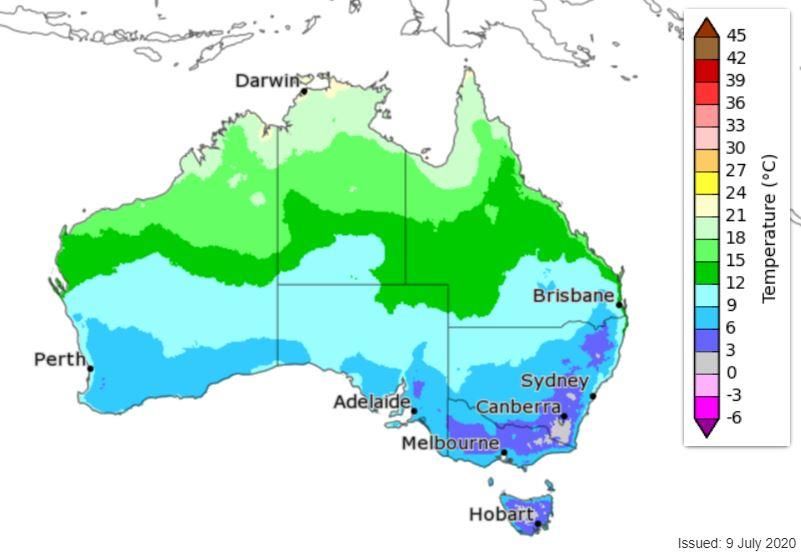
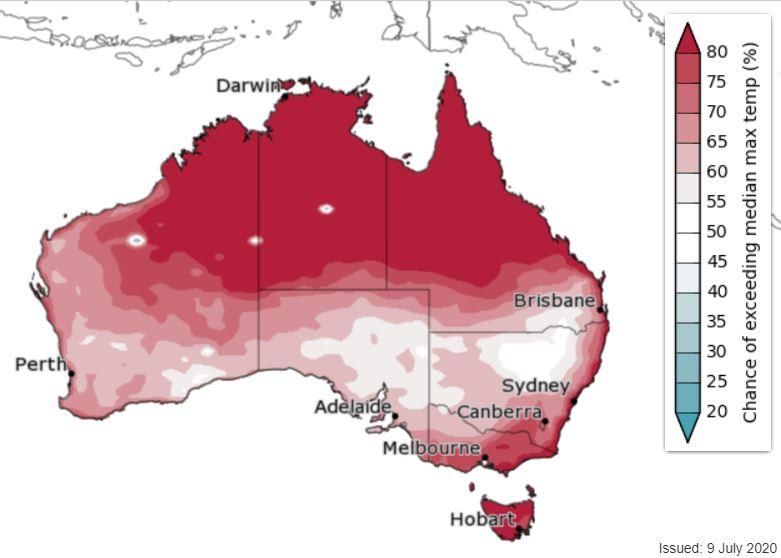
TEMPERATURE
  Days and nights from August to October are likely to be warmer than average across the Northern Gulf region.
  In parts of Southern Australia, however, maximum temperatures could be below average as we move out of
  winter and into spring.

  Maximum Temperatures – August to October 2020
  Daytime temperatures for August to October are very likely to be above average across northern Australia
  (greater than 80% chance for most areas), though slightly below average for much of Southern Australia. For
  the Northern Gulf region, this means maximum temperatures will push to above 30°C for most of the region.

  Figure 1: Maximum Temperature information for the Northern Gulf; [Left] Chance of exceeding the Median Maximum Temperature
  and [Right] Median Maximum Temperatures for the region in August-October.

  Minimum Temperatures – August to October 2020
  August to October night-time temperatures are very likely to be warmer than average for almost all of
  Australia. For the Northern Gulf region, temperatures are unlikely to fall below 18°C to the west, or below
  15°C for the eastern/southern part of the region, as we move out of the colder winter months.

Figure 2: Minimum Temperature information for the Northern Gulf; [Left] Chance of exceeding the Median Minimum Temperature and
[Right] Median Minimum Temperatures for the region in August-October.
CLIMATE DRIVERS
La Niña watch: ACTIVATED
The ENSO Outlook remains at La Niña WATCH. This means that
while the El Niño-Southern Oscillation is currently neutral, the
chance of a La Niña forming in the coming months has increased
to around 50% - twice the normal likelihood.
While the recent cooling trend in the tropical Pacific Ocean (towards
La Niña thresholds) has eased in recent weeks, climate models
indicate this stalling is likely to be temporary, and further cooling
during winter and spring is likely. A La Niña WATCH is not a guarantee that a La Niña will occur; it is an
indication that some of the typical precursors of an event are in place. Over half the climate models surveyed
by the BOM suggest that La Niña thresholds are likely to be approached or exceeded during the southern
hemisphere spring.
Sea Surface Temperature (SST)
SSTs are projected to remain slightly warmer than average around parts of Australia, particularly off the
country’s northern coastlines and down the east coast.

                                                                      The image below illustrates SST in the
                                                                      Coral Sea will continue to remain
                                                                      warmer than normal from August to
                                                                      October, as a cool body of water
                                                                      develops in the Tropical Pacific Ocean.

                                                                      This body of cool water could suggest a
                                                                      La Niña-like state in the tropical Pacific
                                                                      Ocean is possible later in the southern
                                                                      hemisphere winter or spring.

Most international climate models surveyed by the BOM indicate central tropical Pacific sea surface
temperatures in the NINO3.4 region will cool in the coming months. Two of the eight surveyed models reach the
La Niña threshold during August, with three more models approaching thresholds in September and November.
The other three models remain more clearly at neutral levels.

ENSO events, El Niño or La Niña,
typically begin to develop during
autumn, before strengthening in
winter and spring. The Forecast
mean in this image suggests that
monthly SST anomalies will
border the threshold for a La
Niña event as we approach spring
(September). BOM will continue
to closely monitor the potential
for either to develop this year.
Southern Oscillation Index The SOI is currently in a ‘consistently near zero’ phase. The 30-day SOI for the 30 days ending 5th July was −2.6. The 90-day value was −1.1. Both the 30-day and the 90-day SOI have moved closer to zero over the past fortnight, mostly due to higher pressure at Darwin, and are within the ENSO neutral range. Sustained negative values of the SOI below −7 typically indicate El Niño while sustained positive values above +7 typically indicate La Niña. Values between +7 and −7 generally indicate neutral conditions. While the SOI is an important index that tracks changes in tropical air pressure, we consider a wider range of atmospheric and oceanic conditions when we assess the status of ENSO. This includes winds, clouds, ocean currents, both surface and sub-surface ocean temperatures, as well as outlooks for the months ahead. The Madden-Julian Oscillation (MJO) A moderately strong pulse of the Madden– Julian Oscillation (MJO) is currently located in the western Indian Ocean. Climate models generally agree that this pulse will weaken prior to moving into the eastern Indian Ocean. At this time of the year, an MJO pulse near the western Indian Ocean normally has no widespread influence on rainfall patterns across northern Australia, Papua New Guinea or most of Indonesia. However, an MJO pulse in this region may contribute to stronger than average easterly flow across parts of northern Australia, particularly across eastern parts. The Madden Julian Oscillation (MJO) impacts weather in tropical Australia (and occasionally in higher latitude areas) on a weekly to monthly timescale.
The Indian Ocean Dipole
The Indian Ocean Dipole (IOD) is currently neutral – and much of the eastern Indian Ocean remains warmer
than average. The latest weekly value to 5th July is +0.2 °C, which represents a decrease in the index over the
past fortnight.
Three of the six international climate models surveyed by BOM reach or exceed negative IOD thresholds during
the Southern Hemisphere winter or early spring, and remain so through spring. The other three models
suggest neutral IOD is most likely.
A negative IOD typically brings above average winter–spring rainfall to much of southern Australia.

What is the Indian Ocean Dipole?
The Indian Ocean Dipole (IOD) compares sea surface temperatures. An IOD negative state, having warmer
than average sea surface temperatures near Australia, provides more moisture for frontal systems and lows
crossing Australia.
Sustained changes in the difference between sea surface temperatures of the tropical western and eastern Indian Ocean
are known as the Indian Ocean Dipole or IOD. The IOD is one of the key drivers of Australia's climate and can have a
significant impact on agriculture. This is because events generally coincide with the winter crop growing season.
The IOD has three phases: neutral, positive and negative. Events usually start around May or June, peak between August
and October and then rapidly decay when the monsoon arrives in the southern hemisphere around the end of spring.
Neutral IOD Phase – Water from the Pacific flows between the islands of Indonesia, keeping seas to Australia's northwest
warm. Temperatures are close to normal across the tropical Indian Ocean, and hence the neutral IOD results in little
change to Australia's climate.
Positive IOD Phase – Westerly winds weaken along the equator allowing warm water to shift towards Africa. Generally,
this means there is less moisture than normal in the atmosphere to the northwest of Australia, often resulting in less
rainfall and higher than normal temperatures over parts of Australia during winter and spring.
Negative IOD Phase – Westerly winds intensify along the equator, allowing warmer waters to concentrate near Australia.
A negative IOD typically results in above-average winter–spring rainfall over parts of southern Australia as the warmer
waters off northwest Australia provide more available moisture to weather systems crossing the country.
WHERE CAN YOU FIND MORE INFORMATION?
Bureau of Meteorology Climate Website
This page is updated every fortnight. There is a lot of information you can get from this page, including ENSO
situation and forecasts, and rainfall and temperature maps. The maps can be zoomed in to a regional level for
perspective. Click on http://www.bom.gov.au/climate/
Climate Drivers
The Madden-Julian Oscillation (MJO)              http://www.bom.gov.au/climate/mjo/

ENSO Wrap-Up                                     http://www.bom.gov.au/climate/enso/

The Indian Ocean Dipole (IOD)                    http://www.bom.gov.au/climate/iod/

Southern Oscillation Index                       http://www.bom.gov.au/climate/enso/history/ln-2010-12/SOI-what.shtml

Rainfall
Recent Rainfall                                  http://www.bom.gov.au/jsp/awap/rain/index.jsp

Rainfall Outlook                                 http://www.bom.gov.au/climate/outlooks/#/rainfall/summary

Northern Rainfall Onset                          http://www.bom.gov.au/climate/rainfall-onset/

Temperature                                      http://www.bom.gov.au/climate/outlooks/#/temperature/summary

Drought                                          http://www.bom.gov.au/climate/drought/

Soil Moisture                                    http://www.bom.gov.au/climate/drought/#tabs2=Soil-moisture

The Long Paddock Website
A Queensland Government initiative providing seasonal climate and pasture condition information to the
grazing community. Click on https://www.longpaddock.qld.gov.au/
Pasture Growth                                   https://www.longpaddock.qld.gov.au/aussiegrass/?tab=aussie-grass-maps

CliMate app
This is a great free program where you can access a whole lot of climate information about your district,
including how the season is going compared to average, when it is likely to rain, what the trends are, and much
more. Click on the link https://climateapp.net.au/
You need to register, which is a simple process, but write down your username and password as you will need
to put them in from time to time.

Northern Australia Climate Program Website
The ‘Northern Australia Climate Program’ (NACP) is a partnership between the Queensland Government, Meat
and Livestock Australia Donor Company and USQ, targeted at helping the grazing industry better manage
drought and climate risks through a range of research, development and extension activities. NACP is funded
by the Drought and Climate Adaptation Program. Click on https://nacp.org.au/about

Still need more information?
Contact John McLaughlin on 0411 294 331 or email John.McLaughlin@northerngulf.com.au

                                                                                                                         1
You can also read