PRICING CARBON IN AN EMERGING ECONOMY: THE ROAD TO PARIS FOR CHILE - Juan-Pablo Montero - Ferdi
←
→
Page content transcription
If your browser does not render page correctly, please read the page content below
PRICING CARBON IN AN
EMERGING ECONOMY:
THE ROAD TO PARIS FOR CHILE

                   Juan-Pablo Montero
                   Department of Economics and
                   Center for Global Change
                   PUC-Chile

     CERDI-Clermont-Ferrand, France, October 8, 2014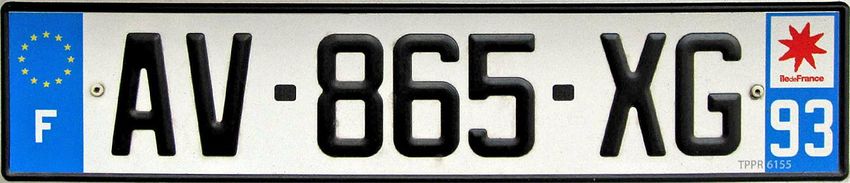
2   Outline
    1. Some background information
    2. Actions taken by the government so far
    3. The recently approved CO2 tax: 5 US$/ton; its
       political economy and its costs
    4. How does Chile’s CO2 tax compare to carbon-
       pricing initiatives around the globe?
    5. Moving forward: implementing cap-and-trade
       and linking to international markets
    6. What to do with the transportation sector (my
       current research)?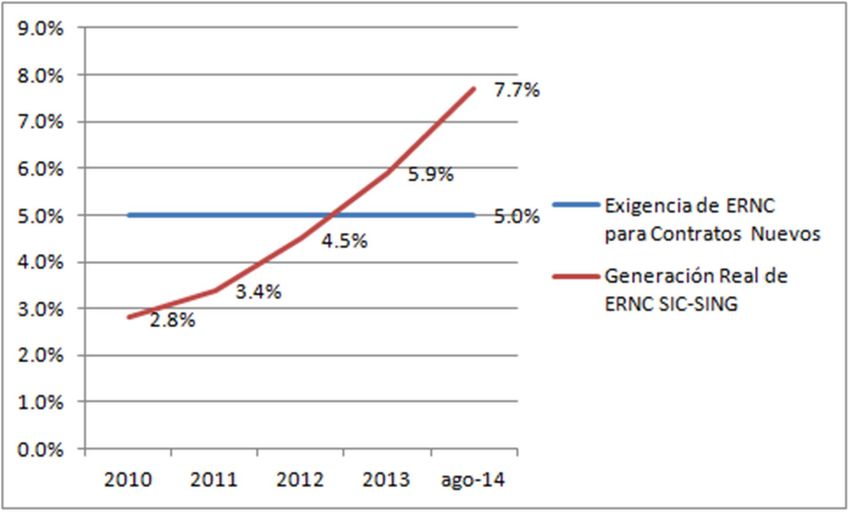
3   I. Brackground information
    Population 2013: 17 million
    GDP 2013: 277 billion US$
    GDP per capita 2013: 19,100 US$ (PPP)
    (15,800 nominal)
    CO2 in 2011: 80.1 million ton
    and growing….(73.9 in 2009)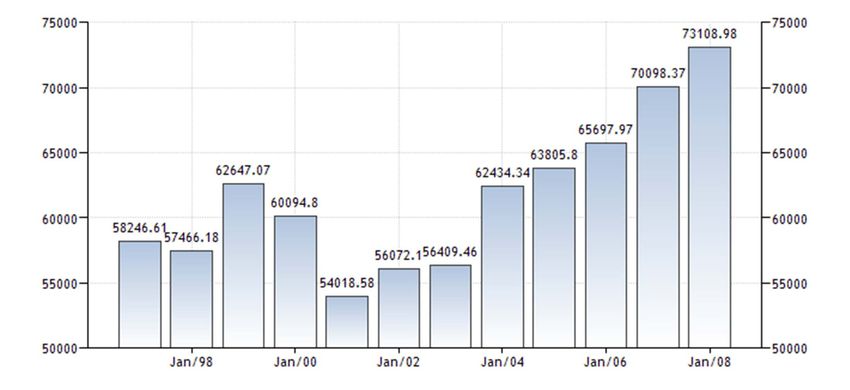
Evolution of CO2 (kilo tons)
4
Growth rate of CO2 emissions
5

    250%

    200%

    150%                                            Chile
                                                    China
                                                    Unión Europea
    100%                                            India
                                                    América Latina y el Caribe
                                                    Miembros OCDE
    50%                                             Estados Unidos
                                                    Mundo

     0%

    -50%

           Source: Own using data from World Bank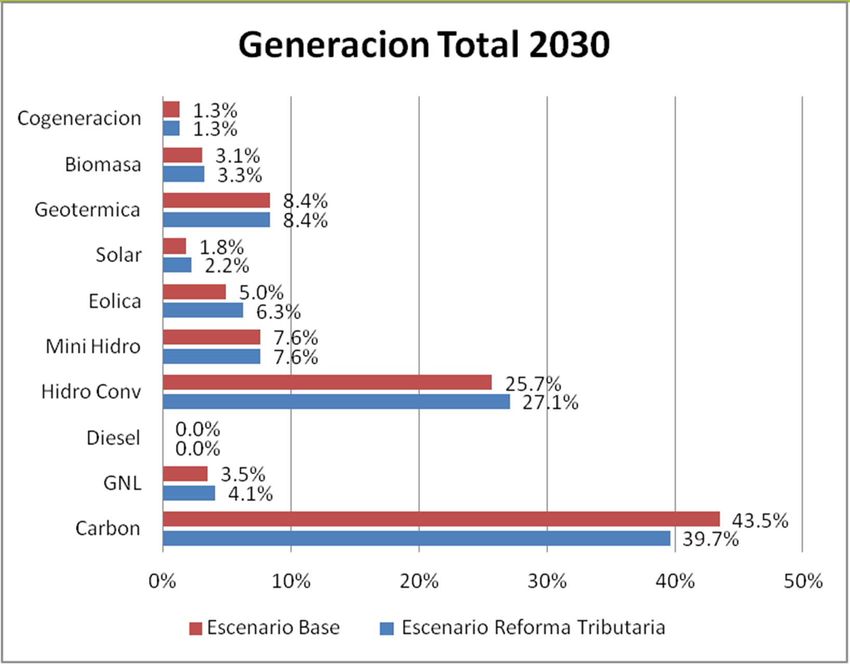
6   II. Chile’s climate policies
    1.   Voluntary 20/20 abatemente agreement
         1.   reduce 20% of GHGs by 2020 using 2007 to project
              baseline
         2.   announced in December 2009
         3.   internally “adopted” in May 2010

    2.   Substantial participation in Clean
         Development Mechanism
    3.   Most important, CO2 tax
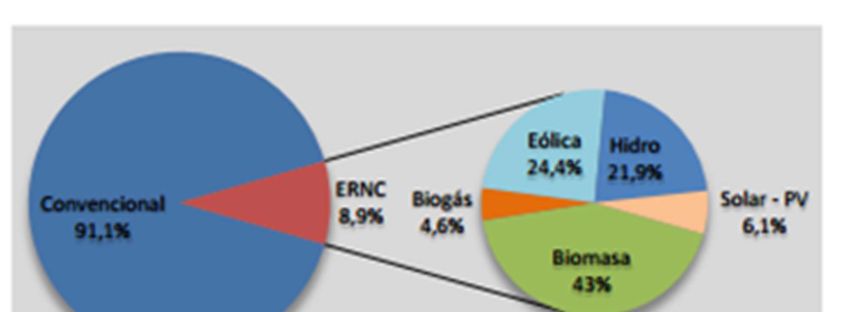
Unexpected increase of
    renewables
8
Law 20.257for the promotion of
    renewable not binding
9
Intensive use of CDM
     (additionality an issue?)
11

 Tipología               2003 2004 2005 2006 2007 2008 2009 2010 2011 2012 2013 Total
 Reforestation               1                   1              1                    3
 Biomass                          2    2         1    2         2    1    1        11
 Fuel switching             1                                   1    1               3
 Methane capture            3             10    3    3     2    2    1              24
 Co‐generación              1                                                        1

 Self‐generation                                                2                    2
 Wind generation                                1          1    5        11         18
 Methane reduction                                                        2          2
 Biogas generation                                                        2          2
 Geo generation                                                           1          1
 Hydro generation           1    1    2    3    3    3          9    5   15         42
 N2O                                            1               1    1               3
 Management activities                                                   11    1    12
 Methane recovery                     3    1               1                         5
 Fertilizer mangement                                                2               2
 Solar                                                          1         6          7
 Transporte                                                     1                    1
 Total per year             7    3    7   14    10   8     5   28   11   49    1   139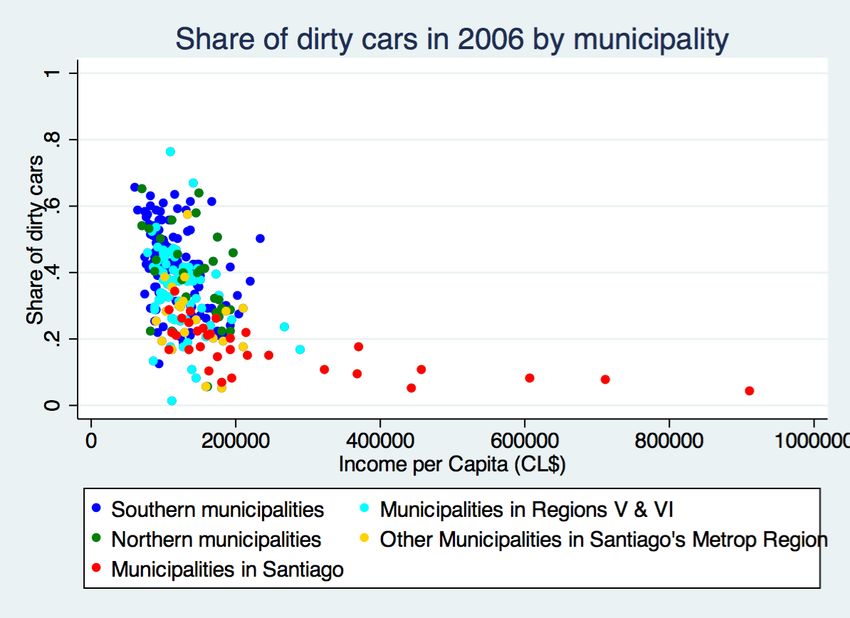
Chile ranks 6th in CDM credits
12
         CDM Credits by country                        Million               % of total
                                                       Credits

     China                                                    784.6                 61.8%
     India                                                    170.9                 13.5%
     South Korea                                              107.1                  8.4%
     Brazil                                                    81.9                  6.4%
     Mexico                                                    20.3                  1.6%
     Chile                                                     13.9                  1.1%
     Argentina                                                 13.3                  1.0%
     Egypt                                                     10.0                  0.8%
     Vietnam                                                    8.0                  0.6%
      Source: AND-Chile, may 2013; using information from CDM Pipeline, may 2013.
13 III. The 5 US$/ton CO2 tax
1. what is it? what does it cover?
2. established along with other (local)
pollution taxes: PM2.5, NOx & SOx
3. its political economy
4. its costs and benefits (and its impact on
CO2 emissions)What is the CO2 tax doing?
14
Proposed in March 2014 by the new President and
signed into law in September 2014
It applies to power plants and large industrial facilities
(greater than 50 MW) starting in 2018
It covers roughly 55% of the country’s CO2 emissions
90% of CO2 from power plants (84 out of 154)
70% of CO2 from industrial sources (233/6678)
Transportation (30%) is not affected
the law also considers taxes for three local pollutants
(PM2.5, SOx, NOx) applied to the same sourcesPolitical economy of Chile’s
green taxes
15
the CO2 tax is expected to raise US$ 425 million/year
(roughly evenly split between industry and power sectors)
the other local taxes are expected (according to a CGC-
UC calculation) to raise another US$ 1192 million/year
these taxes were NOT proposed and debated in isolation
rather, were part of a comprehensive tax reform package
(increasing corporate taxes mainly) aiming at collecting an
additional 3% of GDP (US$ 8 billion/year)
Very unlikely that any of these “green” taxes would have
been pushed and approved in isolation
(Mexico’s CO2 tax of 3 US$/ton, approved in Jan 2014,
followed similar path)Costs and benefits of the CO2
tax (besides the extra revenues)
16
Major benefit: build the institutions that will be
required as we engage in more ambitious
mitigation efforts over the next decade
monitoring, compliance
bring reductions from transportation and forestry
sectors with offsets
the cost for the power sector in terms of higher
retail prices: 2% by 2030 (estimation CGC-UC)
Impact on CO2 emissions and on renewables?Evolution of CO2 emissions power
17
sector: BAU v. 5 dollar tax
Fuente: Elaboración PropiaCO2 abatement: 10% by 2030 18
Power generation in 2030:
19
     BAU v. 5 dollar tax
Impact on renewables
20
Generation renewables
30,0%
2030; 27,8%
25,0%
2030; 25,9%
2025; 18,8%
20,0%
2025; 18,1%
15,0% 2020; 12,6%
2020; 11,9%
10,0%
5,0%
0,0%
2014 2016 2018 2020 2022 2024 2026 2028 2030
BAU CO2 Tax21
IV. Comparing to other
carbon-pricing initiatives
1. To cap-and-trade systems (EU ETS,
New Zealand, RGGI, California-Quebec,
China 7 cities, etc)
2. To other tax systems (Mexico, Sweden)Source: The World Bank 22
23   V. Moving forward
     1.   Why is important to move to a country-wide
          CO2 cap-and-trade system?
     2.   Quantity limits at the country level; not CDM
     3.   Linking to international markets
     4.   Chile has ample experience with markets of
          property rights for managing natural resources
          (particulates, water rights, fishing quotas)
     5.   Already complete report to the World Bank
          (lead by Suzi Kerr from Motu-New Zealand) on
          setting-up cap-and-trade in Chile
We need to move to quantity
limits at the country level
24
Negotiating prices vs negotiating quotas
Quotas superior for many reasons (despite Weitzman
2014):
It is easier for a country to undo the (marginal) workings
of a tax (with internal policies that are not visible)
easier to monitor emissions at the country level (GDP,
fuel mix, etc)
Linking easier among quantity-based regimes
How can a developing country sell credits in the
international market when is using a country-wide tax?
It must necessarily have negotiated quota limits
Nevertheless, taxes are good to start with (Australia)Chile’s experience with quota
markets
25
Water markets; introduced in 1981
100% "grandfathering”
quite successful in valleys in the central district; less so in
northern and southern districts
ITQ for fisheries introduced in 2001
came to replace the previous Olympic race that only set the
total catch; large cost savings as a result
100% grandfathering; a legal reform of January 2013
preserved ITQs
Market for particulates in Santiago in 1992
based on an executive order (didn't require Congress
approval)
100% grandfathering26 VI. Transportation sector
1. What to do with it? Offsets? Upstream
regulation
2. Why not driving restrictions? incentives
for a faster fleet turnoverAdopting a cleaner technology:
The effect of driving restrictions on fleet turnover
Work in Progress
Hernán Barahona Franciso Gallego Juan-Pablo Montero
Department of Economics
PUC-Chile
Toulouse School of Economics, October, 2014
Barahona, Gallego, Montero (PUC) driving restrictions and fleet turnover October 2014 1 / 58driving restrictions are popular
Driving restrictions —basically you cannot drive your car once a
week— are increasingly popular for fighting congestion and (local) air
pollution
they come in different formats but all based on last digit of vehicles’
license plates: some are permanent once-a-week restrictions, others
work only in days of bad pollution or once a week but only during
rush hours, others exempt cleaner cars from it, etc.
why so popular? they are politically visible and relatively easy to
enforce
Cities that have or had in place driving restriction policies (in its
different formats): Santiago (1986), Mexico-City (1989), São Paulo
(1996), Bogotá (1998), Medellı́n (2005), San José (2005), Beijing
(2008), Tianjin (2008), Quito (2010), Paris (March 2014)
Barahona, Gallego, Montero (PUC) driving restrictions and fleet turnover October 2014 2 / 58Driving Restrictions
some unfortunate evidence on how these restrictions work

      A few papers looking at the Mexico-City restriction (Hoy-No-Circula)
      as implemented in 1989
              Eskeland and Feyzioglu (WB Econ R, 1997): more cars on the road
              and higher gasoline consumption in the long run
              Davis (JPE 2008): applying RDD to hourly pollution data found no
              effect in the short run; and also more cars in the long run
              Gallego-Montero-Salas (JPubE 2013): looking at carbon monoxide
              during morning peak hours (90% comes from vehicles unlike other
              pollutants) found (i) a 10% reduction in the short run but a 13%
              increase in the long run (after a year) and (ii) great disparity in policy
              responses among income groups
      Also looking at the evolution of pollution data, Lin et al (2013) failed
      to find air quality improvements from restrictions elsewhere: Bogotá,
      São Paulo and Tianjin (they found some for Beijing)

Barahona, Gallego, Montero (PUC)   driving restrictions and fleet turnover   October 2014   3 / 58
this paper: driving restrictions may accelerate the
introduction of cleaner cars
there is an important long-run effect in some driving restrictions that
has not been studied
by only placing a restriction on old-polluting cars, they may help
accelerate both the introduction of cleaner cars and the retirement of
older cars
the city of Santiago reformed its existing driving restriction policy in
1992 (Mexico-City in 1994) so that any new car was
required to be equipped with a catalytic converter (a device that
reduces pollution considerably, specially lead)
and exempted from any driving restriction
how did it work? not obvious for two reasons
there are two forces operating: some may bypass the restriction buying
a new, cleaner car (sooner than otherwise), yet others may buy a
second older car like in Hoy-No-Circula (which now can be even
cheaper)
local vs global emissions (CO vs CO2)
Barahona, Gallego, Montero (PUC) driving restrictions and fleet turnover October 2014 4 / 58the Santiago driving restriction
1985: prohibition to the import of used cars into the country
1986: driving restriction is introduced in the city of Santiago; but
only for days of unusually bad air quality
1990: the restriction becomes, for practical purposes, permanent from
April to October; 20% of the fleet off the road during weekdays
1992: cars that passed a new environmental standard (catalytic
converter) would get a green sticker
new cars bought in 1993 and after without the green sticker are
not allowed to circulate in Santiago’s Metropolitan Region and
neighboring Regions V and VI (see map)
a car with a green sticker is exempt from any driving restriction
Barahona, Gallego, Montero (PUC) driving restrictions and fleet turnover October 2014 6 / 58Santiago vs the rest of the country
Table: Some statistics of Chile and Santiago
Chile RM Santiago
Population 16,926,084 6,891,011 5,015,070
Average income $ 241,339 $ 292,498 $ 331,673
# of cars∗ 2,162,308 994,723 797,046
cars∗ p.p. 12.75% 14.44% 15.89%
(∗) counting only particular light cars
Figure: Chilean Map Figure: South America
Barahona, Gallego, Montero (PUC) driving restrictions and fleet turnover October 2014 7 / 58our data
our main database consists of a panel of 323 counties/municipalities
and 7 years (2006-2012) with detailed information on fleet evolution
(number of cars per vintage).
Figure: Evolution of the car fleet at the country level
Barahona, Gallego, Montero (PUC) driving restrictions and fleet turnover October 2014 8 / 58Preliminary evidence: Santiago vs the rest of the country
Figure: Fleet in 2006 Figure: Fleet in 2012
compelling evidence that the fleet in Santiago is cleaner than in the
rest of the country
but how much is explained by income? (Santiago is richer)
Barahona, Gallego, Montero (PUC) driving restrictions and fleet turnover October 2014 9 / 58Santiago vs the rest of the country “controlling” for
income
Figure: Red cars as function of income in 2006
it seems that municipalities in Santiago (more than 30) have a
smaller fraction of red cars (vintage 92 and older) in their fleets
Barahona, Gallego, Montero (PUC) driving restrictions and fleet turnover October 2014 11 / 58controlling for income and used-car dynamics
there may be different reasons behind the higher fleet turnover in
Santiago
it could be the restriction policy
but also that a high turnover in high-income municipalites in Santiago
results in a faster turnover in middle and low-income municipalities in
the city (people get rid of a 92 car not because it is dirty but old)
to test for this second possibility we look at the share of 92 and 93
cars, so let
q1992
92/93it ≡
q1992 + q1993
be the 92/93 ratio in municipality i in sample year t
Barahona, Gallego, Montero (PUC) driving restrictions and fleet turnover October 2014 12 / 58the 92/93 ratio: municipalities in Santiago vs the rest
results supporting the policy effect look stronger now
Figure: 92/93 ratio for sample 2006
Barahona, Gallego, Montero (PUC) driving restrictions and fleet turnover October 2014 13 / 58more formally...
Table: OLS results for different adyacent-year ratios
(1) (2) (3) (4) (5)
88-89 91-92 92-93 93-94 95-96
Santiago 0.0166 0.00166 -0.171∗∗∗ -0.0183 -0.00646
(0.014) (0.013) (0.018) (0.015) (0.012)
Population -0.000208 0.00235 -0.00743 -0.00174 0.000280
(0.005) (0.004) (0.006) (0.005) (0.004)
Income per capita -0.00145 -0.00522 -0.00655 -0.00655 -0.0100∗
(0.005) (0.005) (0.006) (0.005) (0.004)
Distance to Santiago -0.0626∗ -0.0138 0.141∗∗∗ 0.0184 0.00601
(0.026) (0.024) (0.033) (0.027) (0.022)
(Distance to Santiago)2 0.0285 0.0200 -0.0906∗∗∗ 0.00330 0.00805
(0.020) (0.018) (0.025) (0.020) (0.017)
Far away regions 0.0974∗∗ -0.0451 0.00516 0.135∗∗∗ 0.0760∗∗
(0.034) (0.031) (0.043) (0.035) (0.029)
Income dispersion 0.00262 -0.000899 0.00143 -0.00741 0.00369
(0.006) (0.005) (0.007) (0.006) (0.005)
North 0.0240∗ 0.0398∗∗∗ -0.0277 0.0346∗∗ -0.0250∗
(0.012) (0.011) (0.015) (0.012) (0.010)
Urbanization -0.0485∗∗ -0.0288 -0.00372 -0.00707 0.0108
(0.017) (0.015) (0.021) (0.017) (0.014)
Constant 0.372∗∗∗ 0.413∗∗∗ 0.542∗∗∗ 0.559∗∗∗ 0.444∗∗∗
(0.014) (0.013) (0.018) (0.015) (0.012)
Observations 266 266 266 266 266
R2 0.165 0.085 0.520 0.336 0.189
Standard errors in parentheses
∗ ∗∗ ∗∗∗
p < 0.05, p < 0.01, p < 0.001
Income per capita in hundreds of thousends of pesos.
Population in hundreds of thousends of persons.
Distance to Santiago in hundreds of kilometers.
Barahona, Gallego, Montero (PUC) driving restrictions and fleet turnover October 2014 15 / 58Conclusions
We find a great impact on the evolution of the car fleet as a result of
the driving restriction policy implemented in Santiago.
Older cars were exported from Santiago to the rest of the country,
where local pollution is less of a problem (what about global
pollution?)
We built a theoretical model to better understand how different
policies (different driving restrictions designs in particular) work and
how close they can take us to the first best.
We still need to characterize the transition phase; since transitions are
slow, it is important for welfare to get it right
We also need to better understand the trade-off between local and
global pollution from moving cars from one region to another
There is still a lot of work to be done
Barahona, Gallego, Montero (PUC) driving restrictions and fleet turnover October 2014 58 / 58You can also read