Yahoo Japan Corporation - FY2018-1Q Business Results July 27, 2018 - Yimg.jp
←
→
Page content transcription
If your browser does not render page correctly, please read the page content below
Yahoo Japan Corporation
FY2018-1Q Business Results
         July 27, 2018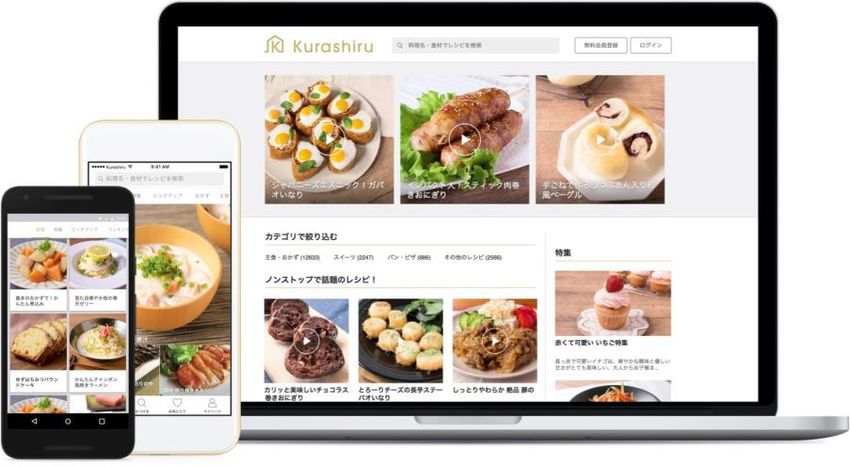
Table of Contents
    P. 4        FY2018-1Q Financial Highlights
    P. 12       Media Business
    P. 24       Commerce Business
    P. 41       Aiming to Improve Corporate Value
    P. 48       Supplemental Information

    Unless otherwise specified, English-language documents are prepared solely for the convenience of
    non-Japanese speakers. If there is any inconsistency between the English-language documents and the
    Japanese-language documents, the Japanese-language documents will prevail.
2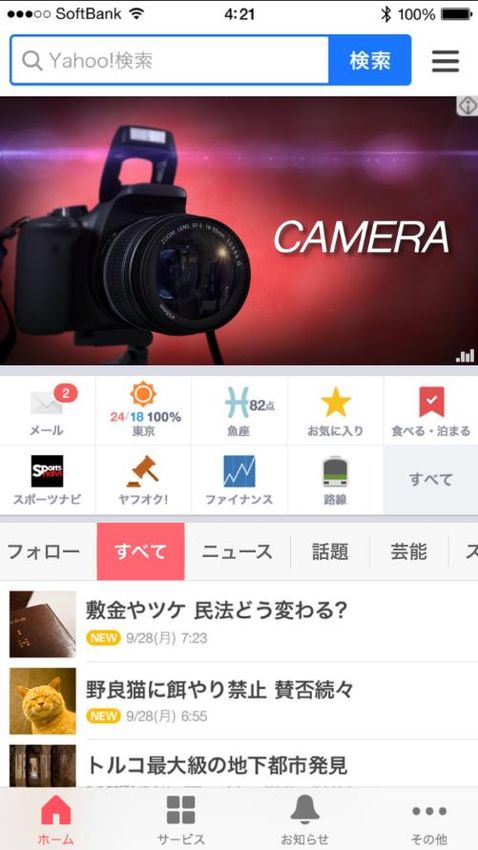
Statements made at the meeting or included in the documents
    that are not historical facts are forward-looking statements about
    the future performance of Yahoo Japan Corporation (Company,
    Yahoo! JAPAN) and its consolidated subsidiaries and affiliates.
    The Company cautions you that a number of important factors could
    cause actual results to differ materially from those discussed
    in the forward-looking statements.
    Such factors include, but are not limited to, the items mentioned in
    “Risk Factors” in “Results for the Three Months Ended June 30,
    2018.”
    Unauthorized use of the information or the data in this document
    is not permitted.

3
FY2018-1Q
    Financial Highlights
4
FY2018-1Q Topics

        Paid search advertising revenue achieved
    1   a double-digit growth YoY

        Established a joint venture with SoftBank Corp.
    2   to expand mobile payment business

        Entered into capital alliances and conducted
    3   share buyback to improve corporate value
5
Revenue
(¥Billion)

           Revenue of ASKUL Group
                                                                                                                       ¥ 231.8 billion
           Revenue excluding ASKUL Group                                                                                                                   YoY +9.0%
                                                                                                                                                                              231.8
                                                                                                                                                   204.2       212.7

                                                                                                                           99.9        110.5
                                                                                                               97.2
                                                              67.6         70.5        71.8        77.5
                                      56.6        65.5
              38.8        49.2                                                                                                                     121.9       129.6          135.7
  24.4

FY2004        2005        2006        2007        2008        2009        2010         2011        2012        2013        2014        2015         2016        2017          2018
  1Q           1Q          1Q          1Q          1Q          1Q          1Q           1Q          1Q          1Q          1Q          1Q           1Q          1Q            1Q
                                                JGAAP                                                                                        IFRS
              Gross basis                                              Net basis
 Note: Between FY2008 and FY2012, we indicated revenue on a net rather than gross basis, by eliminating certain items in cost of sales and SG&A.
       ASKUL Group includes ASKUL Corporation, AlphaPurchase Co., Ltd., Charm Co., Ltd., and others.
6      Revenue of ASKUL Group has been calculated based on the fiscal period of Yahoo! JAPAN, and consolidation elimination within ASKUL Group has been taken into account.
Changed Recording Policy for Payment Fees
Starting from FY2018, part of payment fees is deducted from
revenue to adapt to changes in accounting policy for revenue
recognition
                          Until FY2017-4Q                       FY2018-1Q onwards

      Revenue                                        Revenue

                                      Payment fees
        Cost of                                       Cost of
         sales                                         sales

          Gross                                        Gross               No impact
          profit                                       profit

7   Note: image diagram
Revenue Excluding Impact from Change in Recording Policy

(¥Billion)

                                        236.2
                               212.7
                      204.2                      Adjustment

                                                               YoY

     99.9
             110.5                      231.8
                                                              +11%
    FY2014   FY2015   FY2016   FY2017   FY2018
      1Q       1Q       1Q       1Q       1Q
8
Operating Income
(¥Billion)
Operating income of ASKUL Group
¥ 47.5 billion
Operating income excluding ASKUL Group YoY -8.9%
50.8 52.2
49.0 48.7 49.1 47.5
42.1
37.6 38.8
32.8 34.2
29.6
23.9
18.4 51.2 47.8 48.8
13.4
FY2004 2005 2006 2007 2008 2009 2010 2011 2012 2013 2014 2015 2016 2017 2018
1Q 1Q 1Q 1Q 1Q 1Q 1Q 1Q 1Q 1Q 1Q 1Q 1Q 1Q 1Q
JGAAP IFRS
Note: Includes amortization expenses of identifiable intangible assets recognized as of the date of business combination.
ASKUL Group includes ASKUL Corporation, AlphaPurchase Co., Ltd., Charm Co., Ltd., and others.
Insurance proceeds related to the fire incident at the Logistics Center of ASKUL Corporation of ¥4.9 billion included in FY2017.
9 Gain on sales of shares of IDC Frontier Inc. of ¥ 7.9 billion included in FY2018.Factors of Change in Operating Income
No change in guidance for full year operating income
as expenses for new challenges are expected to increase in 2H.
Gain on
Increase in sales of
(¥Billion) advertising shares of
revenue IDC Frontier
52.2
48.2
etc. Inc.
48.7 47.5
Impact of fire Investment Media- Commerce-
Increase in SG&A
incident at the for related related
associated with
Logistics human
business growth
Center of resource
ASKUL development
Corporation* Business growth and and service Expenses for new
improved efficiency platform challenges
FY2017-1Q FY2017-1Q FY2018-1Q FY2018-1Q
(after adjustments related to fire incident) (excludes expenses for new challenges)
10 * Total of insurance proceeds of ¥4.9 billion and temporary expenses of ¥0.9 billion related to the fire incident at the Logistics Center of ASKUL CorporationResults by Segments
FY2017 FY2018 YoY
(¥Billion) 1Q 1Q Actual result Main factors of change
Revenue 68.1 72.1 +6.0%
Media
Increase in paid search advertising revenue
business Operating
35.8 36.7 +2.5%
Income
Revenue
140.7 158.4 +12.5% Increase in Shopping-related advertising
ASKUL Group 83.0 96.1 +15.7% revenue
-Absence of insurance proceeds related to
Commerce the fire incident at the Logistics Center
business* Operating 26.1 15.4 -41.1% -ASKUL Group’s temporary strategy costs
Income ASKUL Group 4.3 -1.2 -129.7% (including bonus)
-Increase in sales promotion costs including
point-reward expenses, etc.
Revenue 5.9 3.1 -46.6% Impact of sales of shares of IDC Frontier Inc.
Other
Businesses Operating
income 1.0 8.9 +729.4% Gain on sales of shares of IDC Frontier Inc.
Note: Figures for adjustments are not shown. In cases where major services have been transferred between segments, prior data and comparative figures have been retroactively adjusted to the current segments.
11 * Figures on the lower row for Commerce business are consolidated revenue and operating income of ASKUL Group, consolidated based on the fiscal period of Yahoo Japan Corporation.
ASKUL Group includes ASKUL Corporation, AlphaPurchase Co., Ltd., Charm Co., Ltd., and others.Media Business 12
Number of Monthly Logged-In User IDs
(Million IDs)
                                        44.33

                                                 YoY

     27.82
                30.21
                        34.30
                                39.70
                                                +12%
     June       June    June    June     June
     2014       2015    2016    2017     2018

13
Time Spent by Logged-in Users
(Billion hours)
PC+Others *1
Smartphones *2
2.3
1.9 2.1
1.6 Via smartphones
1.4
1.1 1.3
1.6 YoY
0.7
0.5
+22%
FY2014 FY2015 FY2016 FY2017 FY2018
1Q 1Q 1Q 1Q 1Q
Note: Time spent by users logged-in with Yahoo! JAPAN IDs for each quarter
14 *1 Time spent including accesses via PCs, tablets and feature phones
*2 Time spent including accesses via applications and browsersVideo Viewing Time
YoY
2x
FY2017 FY2018
1Q 2Q 3Q 4Q 1Q
15 Note: Quarterly total of video viewing time in Yahoo! JAPAN services excluding GYAO!.
* Survey by Yahoo Japan CorporationYahoo! News - Number of Video Views
Established a system to deliver live video news for emergencies
(Million)
June 18 Earthquake in northern Osaka
3x
Average
0
2018/1/1
2018/2/1
2018/3/1
2018/4/1
2018/5/1
2018/6/1
16 Note: No. of Yahoo! News video views includes playbacks from video tab.Use of AI to Improve Yahoo! Knowledge Search
kukai, a super computer developed by Yahoo! JAPAN, used to
auto-analyze enormous amount of contents
9 months
↓
1 day
17 Photo: AfloAiming for No.1 in
Internet Advertising
Revenue…
18Advertising-Related Revenue
(¥Billion)
Display
Paid search
76.4
70.4
63.3 65.3
57.8
36.9
20.9
27.1 33.1
35.7 YoY
36.8 36.2 32.2 34.7 39.5
+8%
FY2014 FY2015 FY2016 FY2017 FY2018
1Q 1Q 1Q 1Q 1Q
19 Note: Includes advertising revenue recorded in Commerce BusinessPaid Search Advertising Revenue - YoY Growth Rate
+13.8%
First
double-digit growth
0
in 5 years
FY2014 FY2015 FY2016 FY2017 FY2018
1Q 3Q 1Q 3Q 1Q 3Q 1Q 3Q 1Q
20Factors of Growth for Paid Search Advertising
Revenue per search improved due to several measures
Until FY2017-4Q FY2018-1Q onwards
Changed display design
of ads (May)
Clearly separated each
information so that users can
easily find the information they
want
Started offering optional
function to complement
categories (April)
Supplementary information can
be added (e.g. subtitle that suits
the product or service)
21
Photo: AfloVideo Advertising Revenue via Smartphones
YoY
Approx. 3x
FY2017 FY2018
1Q 1Q
22Launch of Video Ads on Yahoo! JAPAN Top Page App
Launched
on July 21
Photo: Aflo
23Commerce
Business
24Commerce Business - Operating Income Trend
YAHUOKU!, Membership Services, O2O, Financial & Payment businesses, etc.
Yahoo! Shopping (includes revenues from advertising and payment in Yahoo! Shopping)
YJ Card Corporation
Expenses for YAHUOKU! measures
Profitability of
Yahoo! Shopping
improved
0
FY2013 FY2014 FY2015 FY2016 FY2017
Note: Excludes ASKUL Corporation and impacts of extraordinary factors related to ASKUL Corporation. YJ Card Corporation represents YJ Card Corporation’s operating income
25 consolidated to Yahoo Japan Corporation.Percentages of Shopping-Related Advertising Revenue*1 and
Point-Reward Expenses*2 to Yahoo! Shopping Transaction Value
% of Shopping-related advertising revenue
% of point-reward expenses
Transaction value
expanding
but “take rate”
unchanged
0
FY2015 FY2016 FY2017 FY2018
1Q 3Q 1Q 3Q 1Q 3Q 1Q
*1 Shopping-Related Advertising revenue / Yahoo! Shopping transaction value = “take rate”
26 *2 Point-reward expenses related to Yahoo! Shopping / Yahoo! Shopping transaction valueAiming for No.1 in
EC Transaction Value
(Sale of Goods)…
27Definition of EC Transaction Value from FY 2018
No change from FY17
New definition from FY18
¥880B
¥1.8T
YAHUOKU! YAHUOKU!
EC transaction
value
¥630B
(sale of goods) Yahoo! Shopping, LOHACO, Charm
Shopping
¥2.1T Business
EC transaction ¥230B
value ASKUL BtoB
※Name changed from
“Total domestic EC ¥60B
transaction value” Yahoo! Tickets, Ouchi-Direct* ,
Others
¥0.3T tradecarview, BOOKOFF Online
EC transaction Ikyu, Yahoo! Travel,
value (others) Yahoo! Dining, Fee-based digital contents
28 Note: Each figure represents actual transaction value for FY2017
* Real estate trading platform provided in collaboration with Sony Real Estate CorporationEC Transaction Value (Sale of Goods)
(¥Billion)
ASKUL BtoB
Others 469.9
Shopping business
425.8 61.6
YAHUOKU!
368.5 58.7 15.4
281.3
54.1
4.2
10.9
YoY
175.2
254.1 5.1 139.8
+10%
5.2 99.9
72.4
58.9
203.6 210.1 216.2 217.6
189.9
FY2014 FY2015 FY2016 FY2017 FY2018
1Q 1Q 1Q 1Q 1Q
29 Note: Includes transaction value of YAHUOKU! (including Yahoo! Government Auctions), shopping transaction value, other sale of goods transaction value and ASKUL’s BtoB-
related revenue via Internet (closing date: 20th of every month) from 2Q of FY2015 (one month in 2Q).Number of Yahoo! Premium member IDs
(Million IDs)
20.43
Exceeded
9.66
10.92
12.01
16.92
20 million IDs
FY2014 FY2015 FY2016 FY2017 FY2018
1Q 1Q 1Q 1Q 1Q (end of FY)
Note: SoftBank members and Y!mobile members, etc., who are eligible for Yahoo! Premium privileges. Overlap in IDs is excluded.
30Shopping Transaction Value
(¥Billion) 175.2
YoY
72.4
99.9
139.8
+25%
58.9
FY2014 FY2015 FY2016 FY2017 FY2018
1Q 1Q 1Q 1Q 1Q
Note: Includes transaction values of Yahoo! Shopping, LOHACO and Charm Co., Ltd. Overlaps are excluded for transaction values of LOHACO and Charm Co., Ltd. made via
31 Yahoo! Shopping.
LOHACO’s transaction value is the transaction value (closing date: 20th of every month) of LOHACO business, operated by ASKUL Corporation.Shopping-Related Advertising Revenue
(¥Billion)
7.0
YoY
5.5 +28%
2.9
0.9 1.3
FY2014 FY2015 FY2016 FY2017 FY2018
1Q 1Q 1Q 1Q 1Q
Note: Total of Yahoo Japan Corporation’s non-consolidated Shopping-related advertising revenue; advertising revenue of StoreMatch, an advertising product in Yahoo!
Shopping sold by ValueCommerce Co., Ltd. to stores in Yahoo! Shopping; and revenues of paid search advertising and YDN, etc., placed by stores in Yahoo! Shopping.
32 Revenues of paid search advertising and YDN, etc., placed by stores in Yahoo! Shopping are recorded in the advertising revenue of Media Business segment.Auction-Related Transaction Value
Until FY17-4Q FY18-1Q onwards
YAHUOKU!
Auction-related
Change of transaction Other transaction value
transaction value
definition value
YAHUOKU! YAHUOKU!
Yahoo! Tickets-related Yahoo! Tickets-related
Ouchi-Direct Ouchi-Direct
tradecarview tradecarview
BOOKOFF Online BOOKOFF Online
33YAHUOKU! Transaction Value
(¥Billion)
217.6
YoY
189.9
203.6 210.1 216.2
+0.6%
FY2014 FY2015 FY2016 FY2017 FY2018
1Q 1Q 1Q 1Q 1Q
34 Note: Transaction value of YAHUOKU! including Yahoo! Government Auctions. Includes transaction value of ClooShe for FY2014.Aiming for No.1 in
Mobile Payment…
353 Company Alliance to Offer Smartphone Payment Service
SoftBank Investment SoftBank
Group Corp. Vision Fund
Consolidated subsidiary Investment
Yahoo Japan
SoftBank Corp. Paytm Inc.
Corporation
50% owned 50% owned
equity method affiliate equity method affiliate
PayPay
Corporation Provision of
technologies
36Our Strength in Mobile Payment
Use of SoftBank’s group synergy
1 Marketing know-how and resources
Acquisition of users of both companies
Leverage user base of Yahoo! Wallet
2 40 million+ accounts
Mobile payment
Linkage with Yahoo! JAPAN’s 100+ services
transaction value
3 Monetization through data linkage with other businesses No.1
→Free payment fee for first 3 years*
4 Full use of Paytm’ s cutting-edge technologies
37 * Applicable only to payments in which users scan the QR code displayed by stores using an app.Strength of Paytm
India’s leading company in smartphone payment services
300 8 Invested by
million million SoftBank Vision Fund
Alibaba Group
Ant Financial
users merchants
38Steps To Monetization
Maximize
Monetization
transaction value
Strengthen
existing businesses
Advertising, e-commerce, credit card, etc.
Acquire Increase
merchants users Launch
new businesses
O2O (dining, retail, beauty, etc.)
Finance (credit, securities, insurance, etc.)
From 2018
3940
Aiming to Improve
     Corporate Value…

41
Announced Share Buyback
Strengthen collaboration with SoftBank Corp. to
achieve the three No.1s
Increased managerial freedom as a result of the
termination of JVA between SoftBank Group
Corp. and Altaba Inc.
Improve capital efficiency and shareholder
returns
42Strengthen Tie-ups with Other Companies
Encounter
Media
Ad
Enjoy Explore
Search
Service "Conversion media"
Contents Commerce
Data
Pay Purchase
Shopping
Wallet
cart
43Strategic Partnership with Retty Inc.
Jointly provide
solutions in
restaurant selection,
reservation and
payment
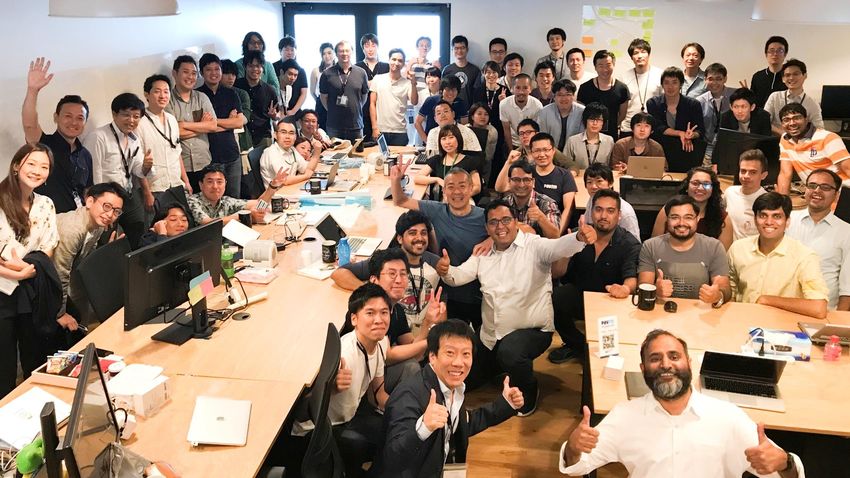
44Strategic Partnership with dely, Inc.
Aiming to become
No.1
in selecting recipes
and purchase of
food items
45Collaboration with SoftBank Vision Fund
Encounter
Media
Ad
Enjoy Explore
Search
Service "Conversion media"
Contents Commerce
Data
Pay Purchase
Certain "SoftBank Vision Fund" investments described herein are subject to pending regulatory approvals. The investments described herein represent a subset of the investments that have been acquired or
Shopping
will be acquired by SVF. This list does not purport to be a complete list of investments. The future operating plans described above are based on the beliefs of SB Investment Advisers at this time and nothing
Wallet
contained herein should be relied upon as a promise or representation as to future operating plans of SVF and its portfolio companies and/or SoftBank. All such operating plans are subject to the requirements
cart
and limitations of the relevant offering documents and/or governing agreements, including all notice and consent requirements, as applicable. Accordingly, there can be no assurance that the operating plans
and models described herein will be implemented and actual results may be significantly different. Nothing presented herein should be construed as a recommendation of any investment or security.
46 Ping An HealthKonnect also uses the name Ping An Healthcare Technology.Yahoo! JAPAN
will create a future that
can only be shaped by us
47Supplemental
Information
48Business Segment Breakdown
Media Business
・Advertising: Paid search advertising “Sponsored Search”,
Display advertising (“Yahoo! Display Ad Network (YDN)”, “Premium Advertising”)
・Business Services: CRM-related services, Media-related services and others
・Personal Services: Video-related services and others
Commerce Business
・Advertising: Display advertising (“Premium Advertising”)
・Business Services: ASKUL, Affiliate-related services, Reservation-related services,
Corporate system-use fees of YAHUOKU!, Payment-related services, Banking-related services,
Credit card-related services, Yahoo! Real Estate, Real estate-related services and others
・Personal Services: LOHACO, Yahoo! Premium, Personal system-use fees of YAHUOKU!, Credit card-related services,
Telecommunications carrier-related services, Pet supplies-related services,
Banking-related services, E-book-related services, FX-related service and others,
Payment-related services
・Others: Banking-related services
Others
・Advertising: Display advertising (“Premium Advertising”)
・Business Services: Data center-related services, Utilities payment-related service and others
49・Personal Services: Utilities payment-related service, Yahoo! Mail, Yahoo! Address Book and othersAdvertising Products
Main
Main Fee Placement
Advertising Products Advertiser
Format Calculation Pages
Base
Paid search Search results
Sponsored Search® Text Major
advertising pages
Per-click rate corporations
(Performance-based) *2
Text
Yahoo! Display Small and
Banner medium-sized
Ad Network
YDN and (YDN) *1 Per-view rate companies
Video
others (Performance-based) *2 Top page *1
Yahoo! Premium Per-impression
Banner page view rate Interior pages of
DSP (Performance-based) *2 service sites *1
Display Major
advertising Brand Panel Rich ads Per-impression corporations
Prime Display (including video) page view rate
Others Banner (Guarantee-based) *3
Premium Banner ads Per-guaranteed
Advertising Text ads period rate, etc. Yahoo!
Others Text (Guarantee-based) *3 Yahoo!
Shopping
Banner Shopping
Conversion- stores
PR Option
based
*1 Includes In-feed advertising on timeline view pages.
50 *2 Advertising that is programmatically or manually managed on a real-time basis to optimize advertisings effects
*3 Advertising for which specific placement is reserved in advanceOrganization Chart of Yahoo Japan Corporation
Chairman of the As of the end of June 2018
Board of Directors President & Representative
Director / CEO
Board of Directors
Media Services Group Business Promotion
ID Services Management Audit and
(622) Group (250) Supervisory
Group (263)
Search Services Group Shopping Services Committee
(375) Group (691) CFO
Media Marketing Solutions Commerce Reservation Services
Company Group (771) Company Group (131) CISO (Chief Information
Security Officer)
Platform Management YAHUOKU! Services
Group (407) Group (302) CDO
Business Promotion Financial & Payment (Chief Data Officer)
Group (59) Services Group (302)
CSO
Technology Group/ CTO (Chief Strategy Officer)
Corporate Group
(Chief Technology Officer)
Finance Management Group Internal Audit Office
System Management Group
Legal Management Group
(673)
People Development Group
Data & Science Solutions
Group (390) Social Responsibility Promotion
Group
51 Note: Figures in parentheses are number of employees.Consolidated Subsidiaries and Affiliates
As of the end of June 2018
Major consolidated subsidiaries
ASKUL Corporation Carview Corporation
CLASSIFIED Corporation Dynatech inc.
eBOOK Initiative Japan Co., Ltd. ecohai Co., Ltd.
GYAO Corporation Ikyu Corporation
Netrust, Ltd Passrevo Corporation
Synergy Marketing, Inc. The Japan Net Bank, Limited
ValueCommerce Co., Ltd. YJ Capital Inc.
YJ Card Corporation YJFX, Inc.
Y’s Insurance Inc. Y’s Sports Inc.
Z Corporation Incorporated
Major affiliates
Astmax Asset Management, Inc. BOOKOFF CORPORATION LIMITED
BuzzFeed Japan Corporation CRITEO K. K.
52 Sony Real Estate Corporation主な連結子会社および持分法適用会社 53
You can also read