EPISERVER PERFORM USER GUIDE - EPISERVER WEBHELP
←
→
Page content transcription
If your browser does not render page correctly, please read the page content below
Episerver Perform
User Guide
© Episerver 2019

Episerver Perform User Guide

  Release date 2019-07-26
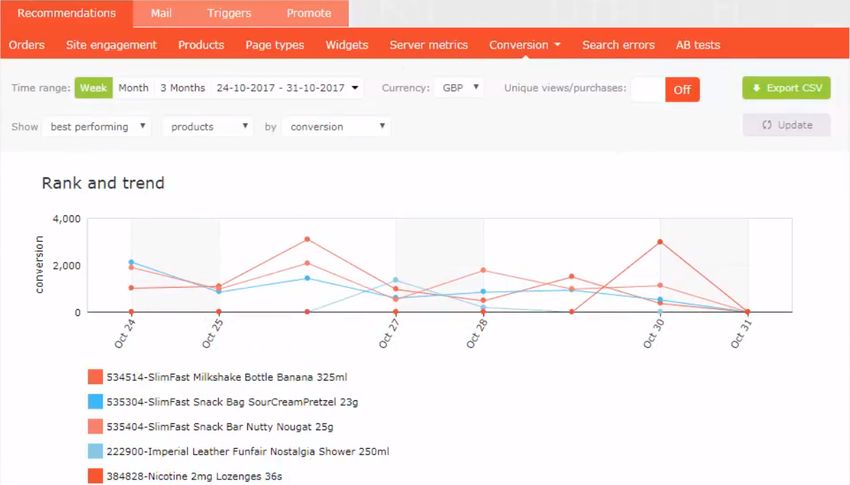
Table of Contents | 3

Table of contents

 Product recommendations                                      5
 Accessing the Recommendations interface                      6
 Setting up a merchandising campaign                          8
  Configuring main campaign details                           8
  Defining master rules                                       9
  Defining product recommendation rules                      12
  Applying exclusions                                        16
  Activating and previewing                                  17
 Product recommendation reports                              20
  Attribution Model                                          20
    Example                                                  20
  Orders tab                                                 21
  Site engagement tab                                        24
  Products tab                                               26
  Page Types tab                                             28
  Widgets tab                                                30
  Server Metrics tab                                         31
  Conversion tab                                             32
    Rank and trend view                                      34
  Search errors tab                                          35
  AB tests tab                                               36
    Daily charts                                             38
    Uplift charts                                            40
    History tab                                              42

                                © Episerver 2019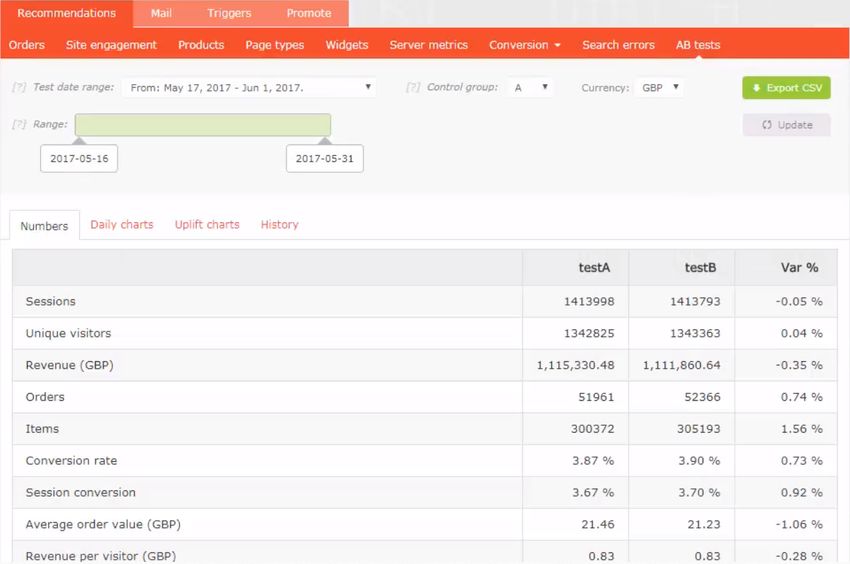
4 | Episerver Perform User Guide 2019-07-26

                                              © Episerver 2019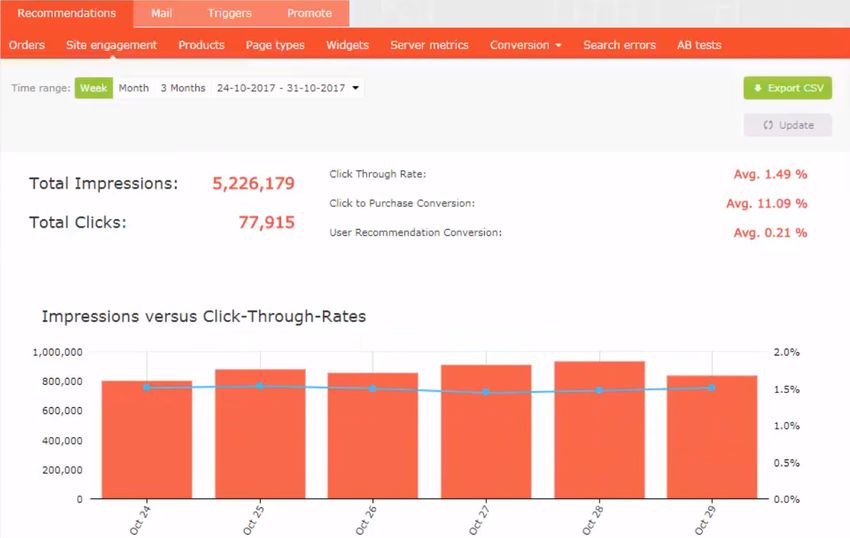
Product recommendations | 5

          Product recommendations

Episerver Personalization is the most advanced personalization tool set on the market. At its heart
is the T3 platform, a third-generation, proven technology that delivers consistently outstanding res-
ults. Episerver Personalization is easy to implement on every page of your website, working to max-
imize the impact of personalized product recommendations.

Each product recommendations widget on your site is configured in the Episerver back-end accord-
ing to a pre-agreed strategy. Each widget can have its own strategy depending on the identified
KPIs for personalization. If there is more than one widget served on the same page, each of the wid-
gets also can have a different strategy.

A strategy comprises a number of algorithms, developed by Episerver's data scientists and
machine learning experts. The algorithms are applied to each widget in a stack formation. This
means that the personalization engine looks at the visitor’s behavior, and tries to return a product
recommendation matching the first algorithm in the stack. If the system is unable to identify a suit-
able product, it looks at the next algorithm in the stack, and so on, until the required number of
products for this widget are returned.

Episerver's Recommendations interface lets you refine the product recommendations generated by
Episerver algorithms, or override Episerver product recommendations to execute specific mer-
chandising campaigns in accordance with your overall site strategies and targets.

You can control merchandising rules in the Episerver for the Personalization Portal, switching them
on/off and changing them in real time.

                                         © Episerver 2019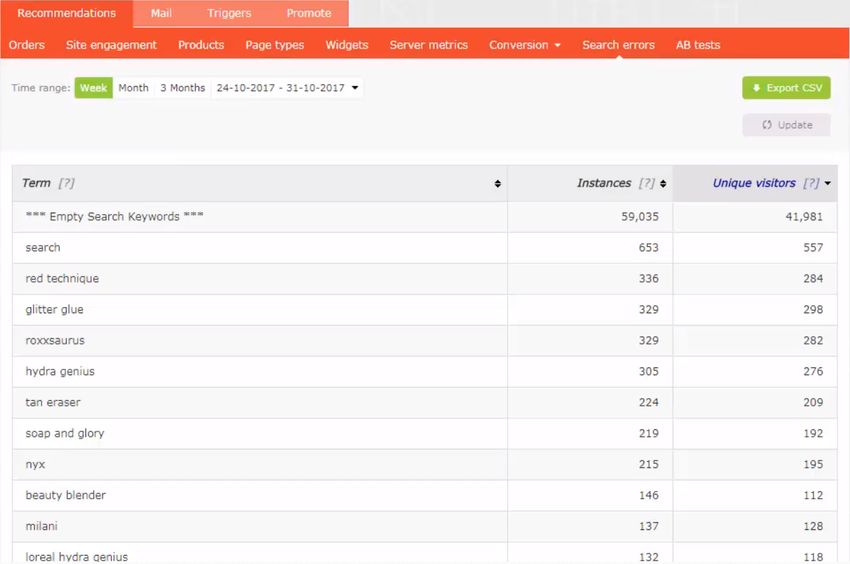
6 | Episerver Perform User Guide 2019-07-26

      Accessing the Recommendations interface

      The Recommendations interface is available in the Episerver for the Personalization Portal.

        1. Access the Episerver for the Personalization Portal at the URL provided to you when your user
           account was created. This will be one of the following URLs:

           https://smartmanager.peerius.com/admin

           https://smartmanager.peerius.episerver.net/admin

        2. Log in to the Episerver for the Personalization Portal with your provided credentials. If you do
           not have your login details, contact developersupport@episerver.com.

        3. Select the Recommendations tab in the navigation bar. In the Recommendations interface, you
           can create new merchandising campaigns, and view or edit the campaigns that you have

                                                © Episerver 2019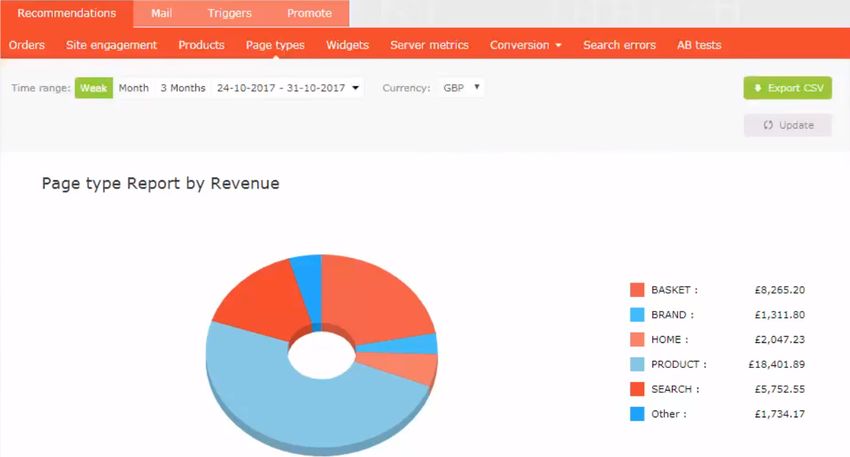
Accessing the Recommendations interface | 7

  already set up.

4. Click Create a new campaign to start setting up a new campaign. See Setting up a Mail cam-
   paign (in the Mail user guide) or Setting up a merchandising campaign.
5. To edit an existing campaign, click the campaign name or Edit   next to it.

                                      © Episerver 2019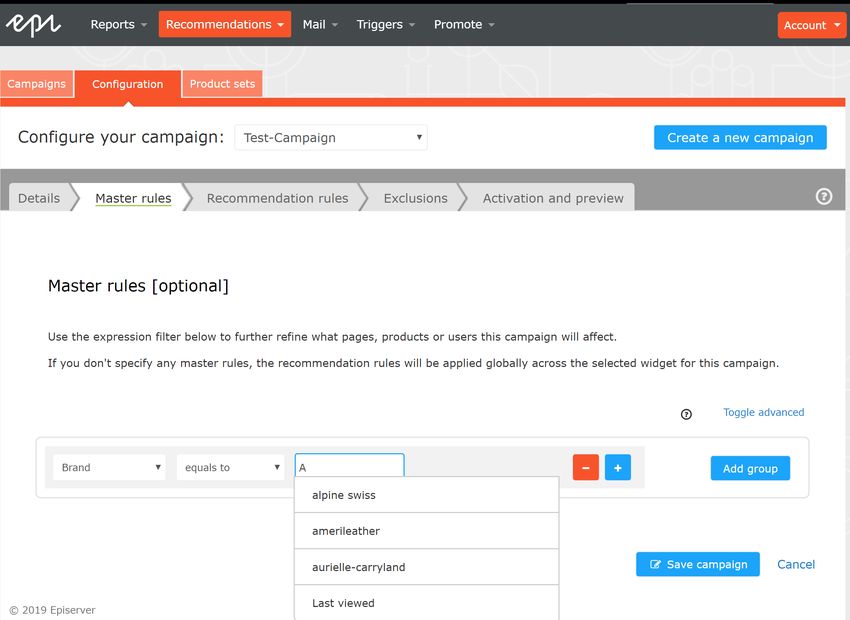
8 | Episerver Perform User Guide 2019-07-26

       Setting up a merchandising campaign

      To create a new merchandising campaign, click Create a new campaign from the Recom-
      mendations overview screen, or select the Recommendations > New campaign tab. The campaign
      editing screen appears. The set-up process involves the following steps:
        1. Configuring main campaign details
        2. Defining master rules
        3. Defining product recommendation rules
        4. Applying exclusions
        5. Setting up activation and preview

       Configuring main campaign details
      In the Details tab, configure the main details of the merchandising campaign: name, location and
      position of the widget to which the merchandising campaign is applied.

        1. Enter a name for the campaign you are creating, such as Product Page Promotion or Brand
           Rule.

        2. Select the widget location; this is the page type where the target widget of the Merchandising
           campaign is located.

                                                   © Episerver 2019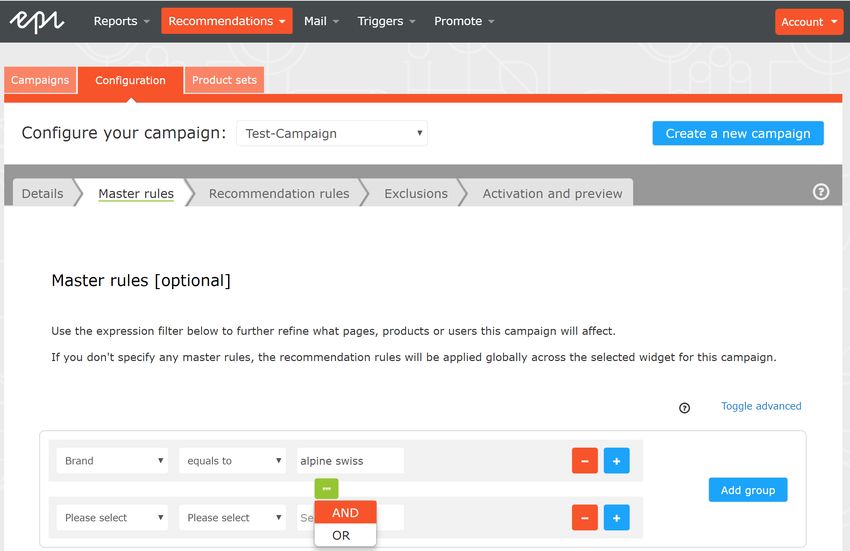
Setting up a merchandising campaign | 9

3. Select the widget you want this campaign to be applied to. The widget position drop-down lists
   available widgets on the selected destination page.

Defining master rules

  Setting up Master rules is optional.

                                         © Episerver 2019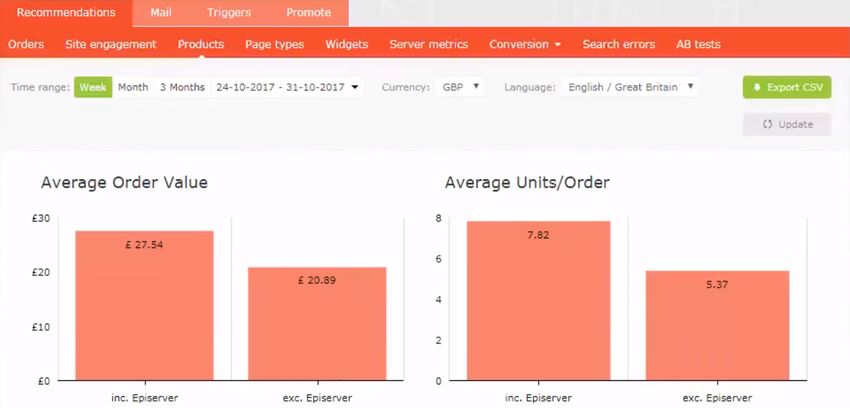
10 | Episerver Perform User Guide 2019-07-26

      Master rules let you refine the merchandising campaign effects to pages, products, or visitors. If
      you do not specify any master rules, the merchandising rules are applied globally across the selec-
      ted widget for a campaign. If you apply a Master rule, it must be satisfied to apply product recom-
      mendation rules.

      Examples of Master rules frequently used:

                        Use case                             Master rule            Recommendation rule

                                                       Brand equals to and         Brand equals to and
        Recommend only products from the same
                                                       type the brand name in      type the brand name in
        brand as the current product being viewed.
                                                       the Search field.           the Search field.

        Recommend a specific product SKU when          Ref Codes equals to         Ref Codes equals to
        a specific product is viewed (i.e. override    and type the product        and type the product
        with a hand-picked product).                   SKU.                        SKU.

        Only recommend products above a spe-           Sale Price greater than     Sale Price greater than
        cific price when a user is viewing a product   or equals and type in the   or equals and type in the
        above a certain price.                         price (such as 25).         price (such as 25).

        Do not recommend discounted products
                                                       Discount equals to          Discount equals to
        when a user is viewing a full priced
                                                       False.                      False.
        product.

        1. To add a Master rule, select the product attribute for your products from the drop-down menu.
           The attributes are based on the product feed, plus a few attributes that Episerver creates by
           default. If you do not see the attribute that you want, add it to your product feed.
        2. Select the condition you want in your rule. For attributes that have a text value, such as Color
           or Brand, choose between equals to or NOT equals to. For attributes with a numeric value, such
           as Sale price or Unit price, you also can use comparison operators like greater than or less
           than.
        3. In the text field, enter the value of the attribute to be evaluated. For most attributes, a drop-
           down list shows values when you click in the text field. You also can start typing in the box to
           filter the results. To select a value, click on it. Numeric values (such as prices) do not have a
           pre-populated list; enter the value manually.

                                                 © Episerver 2019
Setting up a merchandising campaign | 11
You can add multiple rules by clicking the Add group or + . When using multiple
rules you can choose how you want them to interact by setting the AND or OR oper-
ator.
© Episerver 201912 | Episerver Perform User Guide 2019-07-26
To remove a rule, click minus - next to it.
Defining product recommendation rules
Create and configure the rules to be applied to the product recommendations shown in your widget.
You can apply a rule to positions in the widget. You also can create different rules for each position,
or leave a position blank to show the default output of the Episerver algorithms.
© Episerver 2019Setting up a merchandising campaign | 13
l Click Merchandising rule to add another recommendation rule.
l Click Hand-pick rule to create a rule that creates a specific override to the recommendation rule
when a specific product is viewed. For example, the rules in the previous image specify
"product set equals accessories for summer."
l Use the drop-down fields to add the required criteria for the product recommendations in the
same way as you would for a Master rule .
l You can add more than one criterion in the same rule by using + , and the AND and OR oper-
ators.
l After you finish setting up your rule, drag and drop the rule number to the required position in the
widget, where you want it applied. The following image shows rule 1 applied to product position
© Episerver 201914 | Episerver Perform User Guide 2019-07-26
1 and 2, and rule 2 applied to product position 3 and 4. You can apply the same rule to more
than one product position. If you want the same rule to apply to all products in a widget, click
Apply to all.
l You can add more than one rule to the same merchandising campaign, if want to apply different
rules to different positions in the same widget. For example, you can apply rules for the first
product to have a sale price of 25.00 or more, the second product between 15.00 and 24.99, and
the third product under 15.00. To add another rule, click + .
© Episerver 2019Setting up a merchandising campaign | 15
l Click the currency code to select another currency code from the resulting menu.
© Episerver 201916 | Episerver Perform User Guide 2019-07-26
l Click Toggle Advanced if you want to manually enter the coding.
Applying exclusions
Exclusions are optional.
This feature lets you specify products that you do not want to show in the widget specified in the
merchandising campaign (in the Details tab). For example, you set up a product recommendation
rule to show products from a specific brand – BRAND1 – but there are some products from BRAND1
that you actually do not want to show.
In the search field you can type a product SKU/refCode or title to find the product you want to
exclude from recommendations. Click on the products in the results to add them to the exclusions
list, and click Finished after you have added your exclusions.
© Episerver 2019Setting up a merchandising campaign | 17
Activating and previewing
In the Activation and Preview tab, specify a start and end date for your merchandising campaign,
select days of the week to run the campaign, and preview the campaign using a product or cat-
egory.
© Episerver 201918 | Episerver Perform User Guide 2019-07-26
When a campaign is ready, click Save campaign and return to the Campaigns tab. New campaigns
are inactive by default, so find your campaign and click Play to activate it. You can pause/de-
activate a campaign in the same way. Changes are applied immediately to your site.
© Episerver 2019Setting up a merchandising campaign | 19 © Episerver 2019
20 | Episerver Perform User Guide 2019-07-26

                   Product recommendation reports

      This topic shows analytic reporting for Episerver Personalization. Analytic reports let you see the
      success of your campaigns, and which Personalization efforts work or do not work.

      The reporting functionality in Episerver Personalization covers a variety of useful information.

      Perform users and administrators can track and graphically monitor the following items:

         l   Total orders, revenue, and products sold
         l   Order, revenue and products sold through recommendations
         l   Average order value and units per order uplifts with product recommendations
         l   Best Performing pages
         l   Best Performing Widgets

      Attribution Model
      The Episerver Perform Attribution model is the industry standard. If a visitor visits your site and
      clicks on a Perform recommendation, and then returns to the site within 30 days and buys the
      product they clicked and converted on, then full attribution for the conversion is given to Perform.

      Example
      If a visitor engages with a product recommendation, returns to the site and purchases the item, plus
      other items they were not recommended, Episerver Perform is only attributed the revenue gen-
      erated from the recommended item and that they engaged with (clicked on) - not the entire basket
      value.

      For example: A visitor is recommended a T-shirt for $5.50 while browsing the site. The visitor clicks
      on the recommended T-shirt, however they leave the site without purchasing. The visitor returns
      later that day and purchases 2 of the T-shirts they were recommended and engaged with. They also
      purchase a jumper for $14 that they were not recommended. The order total is $25 and the total rev-
      enue attributed to Perform would be $11 (which is 2 T-shirts at $5.50 each). If the visitor buys mul-
      tiple units of the same item that was recommended to them and they clicked on, this collective sum
      is attributed to Perform. Equally, if it was just one item, the sole value of that one item is attributed
      to product recommendations.

                                                 © Episerver 2019
Product recommendation reports | 21
Perform can produce a graph that plots attribution against time. This shows when most people con-
vert after being shown a product recommendation. The metrics used are CPC (Click to purchase
conversion) against time. On average, 85% of conversions occur within 24 hours.
Orders tab
The Orders tab shows orders from online channels tracked by Episerver Personalization.
From the Reports tab, select Recommendations , then click on the Orders tab.
© Episerver 201922 | Episerver Perform User Guide 2019-07-26
l Time range. At the top of the page you can choose the time range for the reports. Week is the
default selection, which shows information from the past 7 days. You can also choose Month, 3
Months or a custom time range. When you change the time range, click Update to refresh the
results.
l Currency . Select the currency you would like to report on.
l Export CSV . You can export any of the reports you are viewing to a CSV file by clicking Export
CSV .
l Total orders . Shows the total number of transactions tracked on the site as two units of meas-
urement.
o Episerver Recommendations . The number of orders in which an Episerver product recom-
mendation was purchased.
o Average percentage from Episerver recommendations . The percentage of orders in which
an Episerver product recommendation was purchased.
l Total revenue.
o From Episerver recommendations . Shows the revenue generated from products bought
through product recommendations, which is measured by totalling the unit value of
© Episerver 2019Product recommendation reports | 23
products clicked and purchased via recommendations.
o Average % from Episerver recommendations . Shows the percentage of total revenue from
Episerver product recommendations.
l Products sold. Shows the total number of units sold on the site.
o From Episerver recommendations . Shows the revenue generated from products bought
through product recommendations.
o Average % from Episerver recommendations . Shows the average percentage of products
sold from Episerver product recommendations.
l Average order value. Shows the average value of orders that contained an Episerver product
recommendation compared to those that did not over the period.
l Average units/order. Shows the average number of units purchased in orders that contained an
Episerver product recommendation compared to those that did not.
l Recommendation revenue from Episerver. Shows a graphical view of the total revenue from
product recommendations (left-hand axis), and % of product recommendation revenue (right-
hand axis), with the time period on the base line, to monitor the peaks and troughs in behavior.
l Orders data table. Shows revenue and products shown in a table. You can organize orders, rev-
enue, and products sold by the following columns.
© Episerver 201924 | Episerver Perform User Guide 2019-07-26
o date
o total number of tracked transactions, revenue or units sold for that date
o total number of orders, revenue, or units sold, that contain or were sold through an
Episerver product recommendation
o the percentage of orders or products sold that contain an Episerver product recom-
mendation
Site engagement tab
The Site Engagement tab shows page impressions, clicks, and click-through rates (CTRs) for
product recommendations across your site.
© Episerver 2019Product recommendation reports | 25
l Total impressions . Shows the total number of page impressions where product recom-
mendations were served.
l Total clicks . Shows the total number of clicks that have occurred on product recommendations.
l Click through rate. Shows a percentage and is worked out on the sum of clicks divided by the
sum of impressions.
l Click to purchase conversion. Shows a percentage, and calculated on the sum of purchased
recommended products divided by sum of clicks.
l User recommendation conversion. Shows the number of unique visitors who purchased a
product recommendation, compared to the number of unique visitors who viewed a product
recommendation, again shown as a percentage.
l Impressions versus click through rates . Shows a graphical representation of this information.
The bars show the daily total number of page impressions with product recommendations, and
the line shows the daily click through rate for product recommendations.
© Episerver 201926 | Episerver Perform User Guide 2019-07-26
l Site Engagement data table. You can organize the data by the following columns.
o Date
o Total number of impressions
o Total number of clicks
o Percentage of product recommendations that were clicked
o Percentage of purchased product recommendations after having been clicked on
o Percentage of unique visitors who purchased from product recommendations versus
unique visitors who saw product recommendations
Products tab
The Products tab shows the best-selling products on the site based on the revenue generated from
product recommendations.
© Episerver 2019Product recommendation reports | 27
l Average order value. Shows the average order value of orders that contained an Episerver
product recommendation compared to those that did not over the specified period.
l Average units/order. Shows the average number of units purchased in orders that contained an
Episerver product recommendation, compared to those that did not, again over the specified
period.
l Revenue from Episerver. Shows revenue generated from Episerver product recommendations
on a daily basis through the time period, providing a visual to see trends in behavior.
l Best-selling products data table. The table in the portal shows the top 10 products. However,
you can export a full list by clicking Export CSV . You can organize the data by the following
columns.
© Episerver 201928 | Episerver Perform User Guide 2019-07-26
o Product code used to identify the product
o Title of the product
o Total number of units sold on the site
o Number of units purchased through product recommendations
o Total revenue of the product on the site
o Total revenue of the product through product recommendations
Page Types tab
The Page Types tab shows page types on the site where product recommendations are served, and
how much product recommendations revenue is generated from each page.
© Episerver 2019Product recommendation reports | 29
l Page type report by revenue. A pie chart shows which page types are generating the most
product recommendations revenue.
l Page Type data table. You can organize the data by the following columns.
© Episerver 201930 | Episerver Perform User Guide 2019-07-26
o Page type names where product recommendations are present
o Number of impressions for that page type
o Number of clicks on product recommendations for that page type
o Click-through rate (CTR) for product recommendations, which is shown as a percentage,
calculated by sum of clicks divided by sum of impressions
o Items Bought shows the number of items purchased through product recommendations on
that page type
o Click to Purchase (CTP) rate for product recommendations shows a percentage, cal-
culated by sum of purchased recommended products divided by sum of clicks
o Revenue generated from product recommendations on each page type.
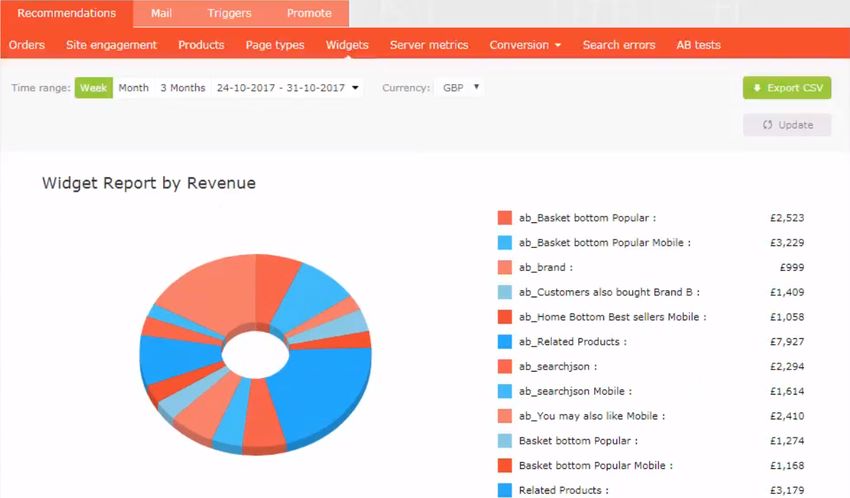
Widgets tab
The widgets reporting page is similar to the Page type report, but with finer detail for individual wid-
gets, because some pages may have more than one widget.
l Widget report by revenue. The pie chart presented to visitors shows which widgets are gen-
erating the most revenue.
l Widget data table. Shows similar information as Page Types, except based at the widget level.
Click on a widget name to see the individual position performance details within a widget. You
© Episerver 2019Product recommendation reports | 31
can organize the data by the following columns.
o Widget
o Impressions
o Position
o Clicks
o CTR
o Items bought
o CTP
o Revenue
Server Metrics tab
The Server Metrics tab shows two graphs:
© Episerver 201932 | Episerver Perform User Guide 2019-07-26
l Number of product recommendations served per day
l Average time it takes to generate product recommendations and return them to a site (that is
after a tracking request is sent)
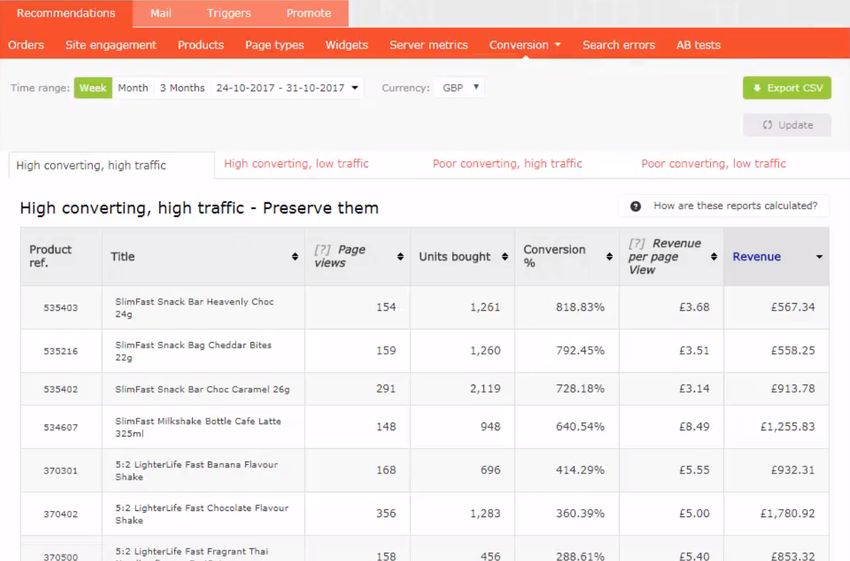
Conversion tab
The Conversion tab shows the ranking of products based on their overall conversion and page
views on a site. It does not focus on product recommendations but can provide easily accessible,
actionable insights based on your whole site and all visitors and all orders.
© Episerver 2019Product recommendation reports | 33
Conversion definitions
l High converting. Any product that is in top 10 of the highest 10% of conversions
l Low converting. Any product that is in the lowest 10 of the lowest 10% of conversions.
Traffic definitions
l High traffic . Any product that is in the top 30% of page views.
l Low traffic . Any product that is in the lower 40% of page views, and with the very lowest 10%
excluded.
The following list and image shows the various combination views of conversion data.
l High converting, high traffic . The best 10 best converting products on the site from the top 30%
of products with most page views.
l High converting, low traffic . The best 10 best converting products on the site from the 40% of
products with the least page views, excluding the 10% of products with the lowest number of
page views.
© Episerver 201934 | Episerver Perform User Guide 2019-07-26
l Low converting, high traffic . The worst 10 converting products on the site from the top 30% of
products with most page views.
l Low converting, low traffic . The worst 10 converting products on the site from the 40% of
products with the least page views, excluding the 10% of products with the lowest number of
page views is displayed.
Rank and trend view
The ConversionRank and trend view lets you generate a Top 5 report of products, categories or
brands sold on your site, based on a combination of criteria – best or worst performing by page
views, revenue or conversion. The generated report shows data on the total page views, units
bought, conversion, revenue per page view and total revenue from all sales on your whole site.
© Episerver 2019Product recommendation reports | 35
Search errors tab
The Search Errors tab shows the terms used in a site search that returned no results.
© Episerver 201936 | Episerver Perform User Guide 2019-07-26
You can sort by the following criteria:
l The term that was searched
l The number of times a term was searched
l The number of unique visitors who searched for a term
AB tests tab
The AB tests tab shows the results from the latest Perform A/B test on a site, and past tests.
© Episerver 2019Product recommendation reports | 37
You can do the following in the AB tests view.
l Filter the results to specific dates by selecting the date range from the range bar.
l Set the control group.
A/B testing supports up to 5 groups so you can view A-to-E testing.
l Select a specific currency that you want to examine.
l In the table you can view and compare key metrics on the site between all test groups, such
as:
o Visitor sessions
o Site revenue
o Conversion rate
o Average order value through average selling price and units per order
o Recommendation engagement and revenue
© Episerver 201938 | Episerver Perform User Guide 2019-07-26
Daily charts
The Daily Charts view shows graphs for revenue generated, average conversion rates, average
order value, average selling price, through to average number of units sold and number of sessions
per day on the site.
© Episerver 2019Product recommendation reports | 39 © Episerver 2019
40 | Episerver Perform User Guide 2019-07-26

      Uplift charts
      The Uplift charts view shows graphs displaying the revenue, conversion and average order uplift
      value for a chosen test group vs the control group for the selected date range (which is cumulative)
      and over the past 7 days

                                               © Episerver 2019
Product recommendation reports | 41 © Episerver 2019
42 | Episerver Perform User Guide 2019-07-26

      History tab
      The History tab shows a list of product recommendation A/B tests conducted on the site.

                                               © Episerver 2019
Episerver Digital Experience Cloud
The Episerver Digital Experience Cloud™ unifies digital content, commerce and marketing
in one platform, including omnichannel solutions for intelligent campaigns. The platform
uses artificial intelligence and behavioral analytics to deliver personalized experiences
everywhere. With our secure, reliable platform you can quickly increase engagement, rev-
enue and productivity, while getting the fastest time to value.
About Episerver
At Episerver, we believe digital transformation is a journey. We have been guiding customers for
more than 20 years in providing standout digital experiences. Today our network of 880 partners, in
30 countries, supports 8,000 customers and over 30,000 websites. Founded in 1994, Episerver has
offices in the US, UK, Sweden, Australia, Germany, Denmark, Finland, Norway, Poland, the Neth-
erlands, Spain, South Africa, Singapore, Vietnam and the UAE.
For more information, visit episerver.com.
www.episerver.comYou can also read