Click to edit Master title style - Introduction: World Population - the United Nations

Page created by Peter Roberts
 
CONTINUE READING
Click to edit Master title style - Introduction: World Population - the United Nations
Introduction: World Population
Prospects 2021 Upgrade - Towards a
 more
   Clickopen andMaster
         to edit reproducible  WPP
                       title style
United Nations Expert Group Meeting
                              Click on
                                    toMethods for thesubtitle
                                       edit Master    World Population
                                                              style Prospects 2021 and Beyond

                                Session 1: Monday 6 April 2020
Click to edit Master title style - Introduction: World Population - the United Nations
Roadmap toward a more open and reproducible WPP
  • Evolution of previous and current revisions for WPP estimates:
     o Reconstruct internally coherent time series of population and demographic
       components since 1950
     o 5x5 cohort-component data model + post-facto 1x1 interpolations for selected
       outputs
        Click to edit Master title style
     o Incorporate the demographic impact of the HIV/AIDS epidemic
     o More systematic compilation of empirical data since 1950 into internal SQL
       database (DemoData)  Click to edit Master subtitle style
     o Greater interactive internal validation of WPP estimates with country data
     o More systematic documentation of data used/considered and generation of
       metadata (country “short notes”)
     o Use of probabilistic projection methods for fertility and mortality components
       in addition to deterministic projection scenarios

        Population Division                                                         2
Click to edit Master title style - Introduction: World Population - the United Nations
Roadmap toward a more open and reproducible WPP
  • Challenges and pending issues/requests for WPP estimates:
     o More transparent and open access to all underlying country empirical data – not just
       the metadata documentation of the data sources and estimation methods used
       -> SQL database + front-ends (DemoData and DataPortal)
     o Greater documentation and explanations of the various methods used to derive
       demographic estimates for each demographic components and the reconciliation with
        Click to edit Master title style
       population estimates -> WPP method protocol
     o More replicable set of criteria/decisions used to derive estimates that can be more
       easily communicated and potentially replicated, or updated as new data become
                             Click to edit Master subtitle style
       available
     o Better capacity to use annual time series (upon data availability and reliability)
     o Better capacity to use single age data (upon availability and reliability)
     o More efficient capacity to update and revise country estimates as new data become
       available and with greater resilience to staff turnover and staff shortage

        Population Division                                                              3
Click to edit Master title style - Introduction: World Population - the United Nations
Guidelines for Accurate and Transparent
Health Estimates Reporting (GATHER)
Item # Checklist item (completed in blue text with hyperlinks, pending in red)                                                                                                            Status
Objectives and funding
    1 Define the indicator(s), populations (including age, sex, and geographic entities), and time period(s) for which estimates were made.                                                 ✓
    2 List the funding sources for the work.
Data Inputs
  For all data inputs from multiple sources that are synthesized as part of the study:
    3 Describe how the data were identified and how the data were accessed.                                                                                                                ✓
    4 Specify the inclusion and exclusion criteria. Identify all ad-hoc exclusions.                                                                                                       2021
    5 Provide information on all included data sources and their main characteristics. For each data source used, report reference information or contact name/institution,                ✓
          population represented, data collection method, year(s) of data collection, sex and age range, diagnostic criteria or measurement method, and sample size, as relevant.

              Click to edit Master title style
    6 Identify and describe any categories of input data that have potentially important biases (e.g., based on characteristics listed in item 5).
  For data inputs that contribute to the analysis but were not synthesized as part of the study:
    7 Describe and give sources for any other data inputs.
  For all data inputs:
    8 Provide all data inputs in a file format from which data can be efficiently extracted (e.g., a spreadsheet rather than a PDF), including all relevant meta-data listed in item 5.
                                                                                                                                                                                          2021

                                                                                                                                                                                            ✓

                                                                                                                                                                                          2021
          For any data inputs that cannot be shared because of ethical or legal reasons, such as third-party ownership, provide a contact name or the name of the institution that
          retains the right to the data.                   Click to edit Master subtitle style
Data analysis
    9 Provide a conceptual overview of the data analysis method. A diagram may be helpful.                                                                                                 ✓
   10 Provide a detailed description of all steps of the analysis, including mathematical formulae. This description should cover, as relevant, data cleaning, data pre-processing,       2021
          data adjustments and weighting of data sources, and mathematical or statistical model(s).
   11 Describe how candidate models were evaluated and how the final model(s) were selected.                                                                                              2021
   12 Provide the results of an evaluation of model performance, if done, as well as the results of any relevant sensitivity analysis.                                                    2021
   13 Describe methods for calculating uncertainty of the estimates. State which sources of uncertainty were, and were not, accounted for in the uncertainty analysis.
   14 State how analytic or statistical source code used to generate estimates can be accessed.                                                                                           2021
Results and Discussion
   15 Provide published estimates in a file format from which data can be efficiently extracted.                                                                                            ✓
   16 Report a quantitative measure of the uncertainty of the estimates (e.g. uncertainty intervals).
   17 Interpret results in light of existing evidence. If updating a previous set of estimates, describe the reasons for changes in estimates.                                              ✓
   18 Discuss limitations of the estimates. Include a discussion of any modelling assumptions or data limitations that affect interpretation of the estimates.

              Population Division                                                                                                                                                                  4
Click to edit Master title style - Introduction: World Population - the United Nations
Roadmap toward a more open and reproducible WPP
  • Long term goals for WPP 2025 and beyond:
     o More open access to both methods, underlying data and analytical steps
     o More collaborative with potential greater country engagement/interactions
  • Short term goals for WPP 2021 (planned release May/June 2021)
        Click to edit Master title style
     o Upgrade production system into 1x1
     o Streamline/harmonize steps used to prepare country data and WPP estimates
     o Provide access to both  WPP
                           Click    estimates
                                 to edit Masterand underlying
                                                subtitle style empirical data for key
       demographic indicators -> Data Portal + Demo Data + Data Archive
     o More GATHER compliant
  • Constraints and limitations
     o Limited time between upgrade of methods, IT infrastructure and data system
     o Fixed/limited resources (staff, skills, computing, budget, etc.)

        Population Division                                                         5
Click to edit Master title style - Introduction: World Population - the United Nations
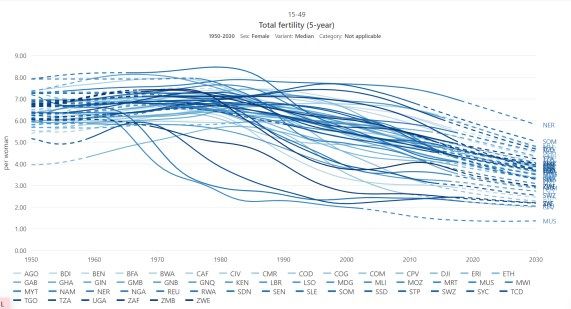
DataCatalog, DataArchive and DemoData
• DataCatalog: comprehensive inventory for each country of
  primary data sources (censuses, demographic surveys, etc.)
  providing data on demographic processes (fertility, mortality,
  population structure and dynamics, marital status and family
  planning) for all countries and areas, as of March 2020, more
  than 6750 entries
      Click to edit Master title style
• DataArchive: a virtual repository of documents, tabular
  datasets and reports (potentially) for each data source, as of
                            Click tofiles
  March 2020, more than 27,000       edit Master subtitle style
• DemoData: SQL database to store in a structured and
  standardized way empirical data and demographic
  estimates (with meta-information) on population, fertility,
  mortality and migration data from as many sources as
  possible

      Population Division                                          6
Click to edit Master title style - Introduction: World Population - the United Nations
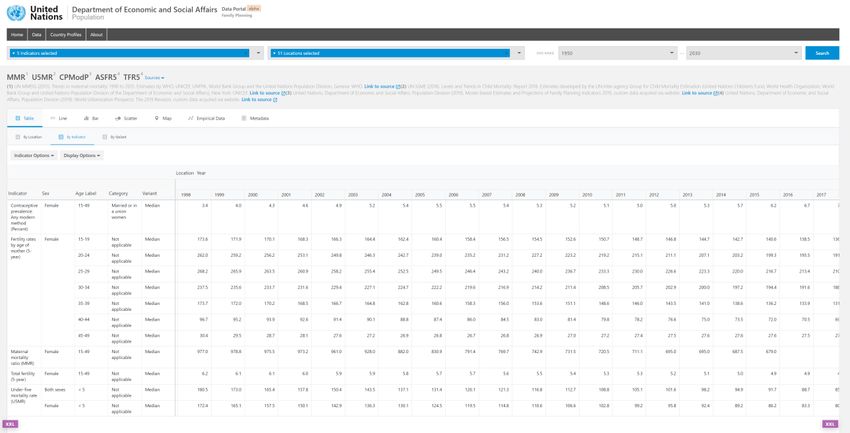
Data Portal: dissemination of
estimates/projections and empirical data

   Click to edit Master title style
                         Click to edit Master subtitle style

   Population Division                                         7
Click to edit Master title style - Introduction: World Population - the United Nations
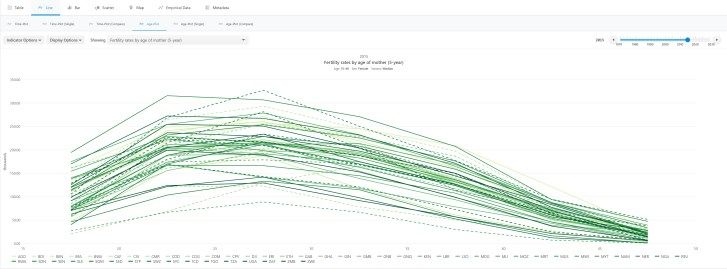
Country data -> provisional WPP estimates -> final
… by demographic component for WPP2021
                                                                       3.                             4. Interpolation /
 1.                                  2.
                                                                       SQL query thru                 extrapolation /
 Assess/evaluate                     Add new data and fill-
                                                                       public/open API                smoothing /
 and compute                         in missing data in
                                                                       and initial                    B3-type of robust
 additional                          DemoData SQL DB:
                                                                                                      curve fitting with
 estimates as  Click to edit Master title style
 direct/indirect

 appropriate for
                                     empirical data from
                                     different data
                                     processes/sources and
                                                                       selection/filtering
                                                                       of series included
                                                                       in the analysis
                                                                                                      hierarchical model
                                                                                                      and/or covariates
 specific data                       estimation methods
                                               Click to edit   Master subtitle style
 sources                             (direct/indirect, etc.)

8.                 7.                                   6.
Final set of       Use provisional WPP                  Review of provisional time series and if      5.
time series        estimates for population             necessary update inclusion/exclusion          Provisional initial
of counts          reconciliation and update            criteria for selected series + update time-   set of time series
or rates           time-dependent                       dependent adjustment factors for              of counts or rates
                   adjustment factors for               territorial coverage, completeness, shocks
                   reconciliation as applicable
               Population Division                                                                                      8
Click to edit Master title style - Introduction: World Population - the United Nations
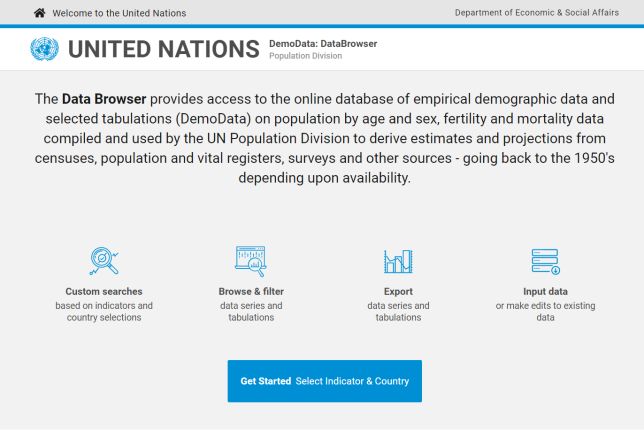
WPP estimation process for each country/area
                                                     Censuses, surveys               Census population
                          Start
                                                     vital registers                 by age and sex (t0)

                                          1
                                                Estimate fertility, mortality,
                                                (migration) for period (t0-1)

   Click to edit Master title style
           4
            Re-estimate fertility, mortality,
            (migration) for period (t0-1)
                                                                             2
                                                                                 Run cohort-component
                                                                                 projection for period (t0-1)
                                                                                                                Adjust census
                                                                                                                population
                                                                                                                if necessary

                                       Click to edit Master subtitle style
                           No match       3
                                                Compare projection result
                                                with census population
                                                by age and sex in (t1)
                           Match

                   Proceed to next        Estimate net-migration                  Census population
                   period (t1-2)          for period (t0-1)                       by age and sex (t1)

   Population Division                                                                                                          9
Click to edit Master title style - Introduction: World Population - the United Nations
WPP2021                              DataArchive                                              EAGLE
Workflow                             A file repository that contains the PDFs,
                                     Excel files, and other file types that
                                     contain the raw data (in unstructured                            Plots                               Tables                                                       OUTPUTS (data focused)
                                     format or as published or analyzed) from                         A section of Eagle where            A section of Eagle
                                     countries on population size and age                             estimates from DemoData             containing tabulated
                                     structure, as well as fertility, mortality
                                     and migration
                                                                                                      are displayed next to
                                                                                                      estimates from the INPUTS
                                                                                                                                          outputs of the Engine.                                       Aggregates: SQL and R
                                                                                                      and outputs of the Engine.
                             Relevant tables with metadata
                          from the DataArchive are loaded
                                                                                                                                                                                                        CountryProfiles                             Revision
                           into DemoData using interactive
                                       data entry processes                                                                              Engine                                                         A public display of WPP
                                                                                                                                                                                                        estimates/projections in tabular
                                                                                                                                                                                                                                                    Comparison
                                                                                                   ShortNotes                            Estimates: 1x1 cohort-component
                                                                                                                                         population estimation framework
                                                                                                                                                                                                        form with
                                                                                                                                                                                                        accompanying visualizations –
                                                                                                                                                                                                                                                    A public comparison of major
                                                                                                                                                                                                                                                    differences by country, and for
                                                                                                   A web front-end to a SQL              + set of parameters (including sets of                                                                     each demographic component
                                                                                                                                                                                                        part of DataPortal
                                    DemoData                                                       database (linked to DemoData)
                                                                                                   where analysts indicate for
                                                                                                                                         time series adjustment factors by
                                                                                                                                         demographic components)
                                                                                                                                                                                                                                                    (part of DataPortal)
                                    A SQL database with an open API with a                         each demographic component
                                    web front-end that holds data on total
                                    population, population by age and sex,
                                                                                                   which empirical data and
                                                                                                   estimation/ adjustment
                                                                                                                                         Projections: Bayesian projection of
                                                                                                                                         demographic rates and application
                                                                                                                                                                                                        DataPortal                                  DataChecking
                                    births by sex and by age of mother,                            methods have been                     to cohort-component                                            An interactive data query/browser           A set of tools in Excel with SQL
                                    deaths by age and sex, TFR and ASFR, life                      used/considered/excluded in           + set of parameters by country                                 and visualization (+ public API) for        queries used to detect errors
                                    table quantities, and migration                                producing estimates for WPP.          + start year for each components                               WPP results + empirical data                or inconsistencies in the
                                    flows. These data are accumulated from                                                                                                                              (included/excluded) for key                 estimates prior to publication
                                    various sources including the DataArchive                                                                                                                           indicators                                  + R bulk comparison plots with
                                    and data compilations like IGME                                                                                                                                                                                 empirical data
                                    estimates, DYB, etc.

 INPUTS               Total counts: From registers and admin. sources for births, deaths, and total pop (census and official estimates) and in selected age groups (infants based on immunizations, primary and secondary educ. stats, national ID and voter registrations)
 1x1 time series of age-                                             Annual                1x1 time series of mortality (life tables)                                                                1x1 sparse                                1x1 Migration
                                                                     time series                                                                                                                                                               Residual from censuses or
 specific fertility rates                                                                  By sex and for single years of age from 0 to 110+
                                                                                                                                                                                                     time series of                            estimates from population
 TFR and ASFRs by single year of age of mother from 10-49            of sex ratio                                                                                                                                                              registers
                                                                     at birth                 VR                              B3 model                          Model life                           population                                Smoothed age patterns
                                                                                                                                                                                                                                               + Model patterns
                                                                                              For good VR country-            For non VR country-years:
                                                                     Read/computed
                                                                     from DemoData            years: 1x1 life tables (as      Smooth time series of q1,         tables                               censuses                                  Informed by refugee flows,
   VR                           B3 model                             using                    published complete or           q5, and 35q15, eventually         SVD comp with output of B3           By sex and for single years of
                                                                                                                                                                                                                                               migrant flows

   For good VR country-
   years: TFR and ASFR
                                For non VR country-years:
                                Smooth time series of TFR
                                                                     inclusion/exclusion
                                                                     criteria from
                                                                                              graduated from abridged)
                                                                                              extended to 110+. These
                                                                                                                              old-age mortality. Input
                                                                                                                              data are from DemoData,
                                                                                                                                                                models of mortality as inputs (as
                                                                                                                                                                well as UNAIDS time series of
                                                                                                                                                                                                     age from 0 to 110+. Read from
                                                                                                                                                                                                     DemoData and adjusted (for
                                                                                                                                                                                                                                               estimated from
                                                                                              are read from DemoData          using inclusion/exclusion                                                                                        stocks, levels and trends in
   from VR, read from           and ASFR. Input data are             ShortNotes. Then                                                                           HIV prevalence and ART               underenumeration, age
                                                                                              using inclusion/exclusion       criteria from ShortNotes                                                                                         foreign work permits, population
   DemoData using               from DemoData, using                 B3 model for                                                                               coverage for AIDS countries)         heaping, etc.) according to
                                                                                              criteria from ShortNotes.                                                                                                                        registers, etc.
   inclusion/exclusion          inclusion/exclusion                  smooth time series.                                                                                                             WPP methods protocol
   criteria from                criteria from ShortNotes                                      Smoothed over time/age,
   ShortNotes                   + extrapolations                                              adjusted for consistency
                                                                                              by sex, as needed.
                                                                                              + Extrapolations as
                                                                                              necessary to 1950.
An open suite of R packages and functions
• New 1x1 cohort-component population projection computational engine
  designed to work with a standard set of 1x1 inputs and outputs
    o R implementation – for deterministic projections/simulations
    o C implementation – for probabilistic projections/simulations
• [TBD: B3-type of robust time trend modelling for TFR/ASFR, and adult mortality]
• DDSQLTools: set of functions to query DemoData SQL database with API

        Click to edit Master title style
• DemoTools: set of functions to evaluate, transform and adjust counts or rates
• DDM and FertEstR: set of functions to evaluate and adjust mortality and fertility data
• Ungroup and MortalityLaws: mortality graduation and extension at older ages
                                 Click to edit Master subtitle style
• SVDcomp: new expanded set of model life tables (including HIV and ART)
• Calibrated Splines: graduation of fertility age patterns
• [TBD: additional packages/functions to operationalize WPP method protocol]
• popReconstruct: probabilistic demographic estimation and population reconstruction
• BayesTFR, BayesLife/BayesLifeHIV, MortCast, BayesPop: probabilistic projections

        Population Division                                                                11
Time table
• Feb-August 2020: upgrade of existing IT/data system
• 6-8 April 2020: EGM about WPP2021 and beyond

• Sept.-Dec. 2020: update of country data and WPP estimates using new
     Click to edit Master title style
  1x1 approach
• Jan. 2021: QA data checking and error detections
                       Click to edit Master subtitle style
• Feb. 2021: probabilistic projections
• March 2021: computation of all derived outputs
• April-May 2021: preparation of reports + Data Portal & media launch
• June 2021: public launch

     Population Division                                            12
Roadmap toward a more open and reproducible WPP

  Strategy = Five year plan:
    Click to edit Master title style
      3 tiers of countries  Click to edit Master subtitle style

          into 3 steps…
      Population Division                                         13
Roadmap toward a more open and reproducible WPP
  • Following the UN Statistics Division (UNSD) classification for the
    reliability of population estimates and vital statistics officially reported
    by national statistical authorities and used since the 1950s for the
    Demographic Yearbook (DYB)
      "Reliability of data: Reliable mid‐year population estimates are those that are based on a complete census

       Click     to    edit     Master          title     style
      (or a sample survey) and have been adjusted by a continuous population register or on the basis of the
      calculated balance of births, deaths and migration” (DYB 2017, p. 51)

  • Two key dimensions for the most recent population estimates:
                            Click to edit Master
     o Nature of the base measurement       of thesubtitle style(register, census, etc.) and
                                                   population
       Time elapsed since the last measurement
     o Method and quality of time adjustment by which the base figure was brought
       up to date (registers, vital registration (VR) + migrations or not, availability of
       multiple censuses with intercensal period ≤ 10-15 years, etc.)
     Note: both census in last 10 year and VR coverage (100% birth registration, and
     80% death registration) are used for SDG indicator 17.19.2
        Population Division                                                                                   14
Roadmap toward a more open and reproducible WPP
  Based on these UNSD DYB criteria for the reliability of official population
  estimates for the period 1950-2020, countries/areas can be grouped
  into 3 tiers:
  • Tier 1: countries/areas (n
Roadmap toward a more open and reproducible WPP
      WPP                   Tier 1: Countries with
                             population registers
                                                       Tier 2: Countries with
                                                          regular censuses
                                                                                      Tier 3: Countries with
                                                                                       no regular censuses
                             or regular censuses
    revision                     and VR ≥ 99%
                                                            and VR ≥ 60%              and/or no VR or < 60%

                                                      Deterministic estimates         Deterministic estimates

     Click
     2021                  to edit Master title style
                            Probabilistic estimates
                                                        and reconciliation
                                                      informed by statistical
                                                      modeling of time trends
                                                                                        and reconciliation
                                                                                      informed by statistical
                                                                                      modeling of time trends
                                Click to edit Master subtitle style
                                                  Probabilistic estimates
                                                                                      Deterministic estimates
                                                                                        and reconciliation
     2023                   Probabilistic estimates          (conditional on
                                                      staff/resources availability)
                                                                                      informed by statistical
                                                                                      modeling of time trends

                                                       Probabilistic estimates         Probabilistic estimates
     2025                   Probabilistic estimates          (conditional on
                                                      staff/resources availability)
                                                                                             (conditional on
                                                                                      staff/resources availability)

     Population Division                                                                                              16
You can also read