Comment on "Insignificant effect of climate change on winter haze pollution in Beijing" by Shen et al. (2018) - Atmospheric Chemistry and Physics
←
→
Page content transcription
If your browser does not render page correctly, please read the page content below
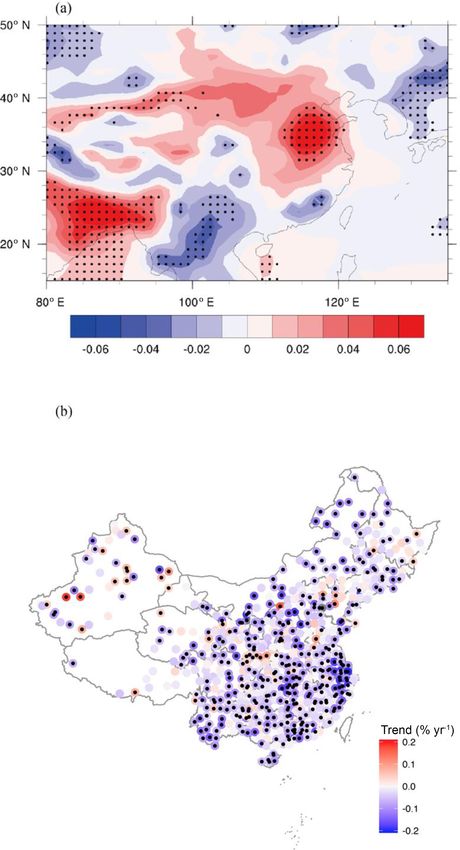
Atmos. Chem. Phys., 19, 8563–8568, 2019
https://doi.org/10.5194/acp-19-8563-2019
© Author(s) 2019. This work is distributed under
the Creative Commons Attribution 4.0 License.

Comment on “Insignificant effect of climate change on winter haze
pollution in Beijing” by Shen et al. (2018)
Run Liu1 , Lu Mao2 , Shaw Chen Liu1 , Yuanhang Zhang2 , Hong Liao3 , Huopo Chen4 , and Yuhang Wang5
1 Institute for Environmental and Climate Research, Jinan University, Guangzhou, 510632, China
2 State Key Joint Laboratory of Environmental Simulation and Pollution Control, College of Environmental Sciences and
Engineering, Peking University, Beijing, 100871, China
3 School of Environmental Science and Engineering, Nanjing University of Information Science and Technology,

Nanjing, 210044, China
4 Institute of Atmospheric Physics, Chinese Academy of Sciences, Beijing, 100029, China
5 School of Earth and Atmospheric Sciences, Georgia Institute of Technology, Atlanta, GA 30332, USA

Correspondence: Shaw Chen Liu (shawliu@jnu.edu.cn)

Received: 26 February 2019 – Discussion started: 4 March 2019
Revised: 17 June 2019 – Accepted: 19 June 2019 – Published: 5 July 2019

   The recent paper by Shen et al. (2018; referred to hereafter   Coupled Model Intercomparison Project Phase 5 (CMIP5)
as SHEN) made a sweeping statement on the winter haze             climate models for the 21st century (2080–2099 vs. 2000–
pollution in Beijing by claiming an “Insignificant effect of      2019). Here we evaluate the accuracies and uncertainties of
climate change on winter haze in Beijing”. We argue that the      the projected changes in RH of CMIP5 climate models by
paper contains three serious flaws. Any one of the three flaws    comparing changes in RH from historical simulations (1960–
can nullify the claim of SHEN.                                    2017) of these climate models to observed values. Figure 1a
   SHEN made a sweeping statement on the winter haze pol-         shows the values of linear trends of annual average RH in
lution in Beijing by claiming an “Insignificant effect of cli-    Beijing–Tianjin–Hebei (BTH) calculated for 1960–2017 his-
mate change on winter haze in Beijing”. While failing to ac-      torical simulations by an ensemble of 17 CMIP5 climate
knowledge the large differences in the dataset used, analy-       models (Table 1). A few models show significant positive
sis methodology, winter month selected, geographic region         trends, but the average trend is only about 0.3 % per decade.
chosen, and period and timescale of study from the others,        This small trend is consistent with the projected insignificant
SHEN attempted to invalidate a number of previous stud-           trends in 21st century (2080–2099 vs. 2000–2019) of RH in
ies, including Wang et al. (2015), Cai et al. (2017), Zou et      the RCP8.5 scenarios from an ensemble of 32 CMIP5 climate
al. (2017), and Li et al. (2018), which have suggested that       models as shown in Fig. 5c of SHEN. In contrast, the small
climate change will worsen haze pollution in Beijing. In this     positive trend is in stark disagreement with the average trend
context, our recent study (Mao et al., 2018) also suggested       of about −0.5 % per decade observed at 25 meteorological
that global warming and other climate changes such as the         stations in BTH between 1960 and 2017 (Fig. 1b).
El Niño–Southern Oscillation (ENSO) and Pacific Decadal              The disagreement is further illustrated in Fig. 2a and b,
Oscillation (PDO) contributed significantly to the trend as       where the spatial distribution of trends of annual average RH
well as interannual variabilities in winter haze days in east-    in China calculated for 1960–2017 historical simulations by
ern China.                                                        an ensemble of 17 CMIP5 climate models is compared to ob-
   We have found three critical flaws in SHEN. First, SHEN        served trends. The model trends are positive in the north and
did not conduct any evaluation of the accuracies or uncer-        negative in southern China, while observed trends are uni-
tainties of the projected changes in surface relative humid-      formly negative and greater in value. These disagreements
ity (RH) and meridional wind velocity at 850 hPa (V850)           raise serious doubt on the validity of projected changes in
in the RCP8.5 scenarios calculated by an ensemble of 32           RH in Beijing for the RCP8.5 scenarios by an ensemble of 32

Published by Copernicus Publications on behalf of the European Geosciences Union.
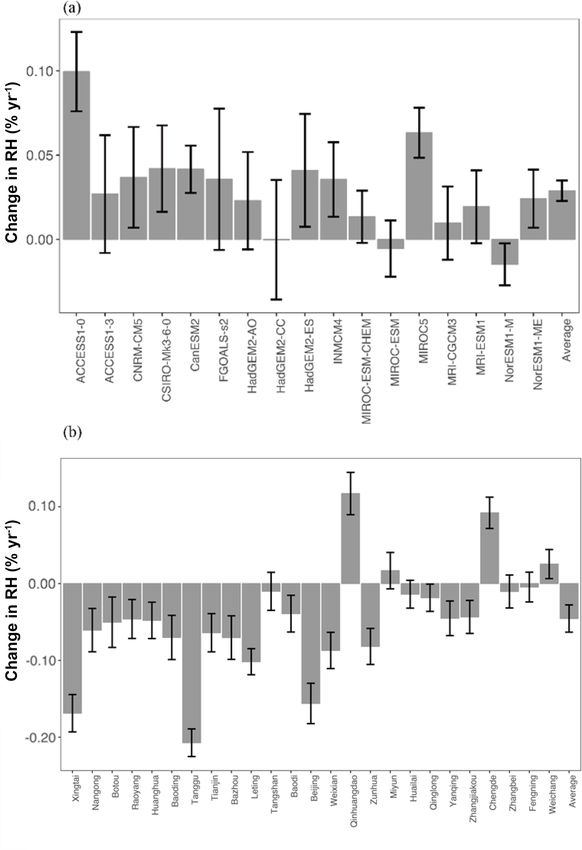
8564                                                                                R. Liu et al.: Comment on Shen et al. (2018)

Figure 1. (a) Linear trends of annual average RH (in % yr−1 ) in Beijing–Tianjin–Hebei (BTH), calculated for 1960–2017 historical simu-
lations by an ensemble of 17 CMIP5 climate models; (b) same as (a) except derived from 25 China Meteorological Administration (CMA)
meteorological stations in BTH region.

Atmos. Chem. Phys., 19, 8563–8568, 2019                                                 www.atmos-chem-phys.net/19/8563/2019/
R. Liu et al.: Comment on Shen et al. (2018)                                                                                      8565

Figure 2. (a) Spatial distribution of linear trends of annual average RH (in % yr−1 ) in China calculated for 1960–2017 historical simu-
lations by an ensemble of 17 CMIP5 climate models; (b) same as (a) except derived from China Meteorological Administration (CMA)
meteorological stations. Small black dots denote those trends significant at 95 % confidence level.

www.atmos-chem-phys.net/19/8563/2019/                                                   Atmos. Chem. Phys., 19, 8563–8568, 2019
8566 R. Liu et al.: Comment on Shen et al. (2018)
Table 1. Abbreviation and name of 17 CMIP5 models used in this study.
Abbreviation Expanded model name
ACCESS1-0 Commonwealth Scientific and Industrial Research Organisation Australian Community,
Climate and Earth System, version 1.0
ACCESS1-3 Commonwealth Scientific and Industrial Research Organisation, Australian Community,
Climate and Earth System, version 1.3
CNRM-CM5 Centre National de Researches Météorologiques Coupled Global Climate Model, version 5
CSIRO-Mk3-6-0 Commonwealth Scientific and Industrial Research Organisation Mark, version 3.6.0
CanESM2 The second-generation Canadian Earth System Model
FGOALS-S2 The Flexible Global Ocean-Atmosphere-Land System model, spectral version 2
HadGEM2-AO Atmosphere and Ocean (non-Earth System version) configuration of HadGEM2
HadGEM2-CC Hadley Global Environment Model 2 – Carbon Cycle
HadGEM2-ES Hadley Global Environment Model 2 – Earth System
INMCM4 Institute of Numerical Mathematics Coupled Model, version 4.0
MIROC-ESM-CHEM An atmospheric-chemistry-coupled version of MIROC-ESM
MIROC-ESM Model for Interdisciplinary Research on Climate Earth System Model
MIROC5 Model for Interdisciplinary Research on Climate, version 5
MRI-CGCM3 Meteorological Research Institute Coupled Atmosphere–Ocean General Circulation Model, version 3
MRI-ESM1 Meteorological Research Institute – Earth System Model, version 1
NorESM1-M Norwegian Earth System Model, version 1, intermediate resolution
NorESM1-ME Norwegian Climate Centre Earth System Model ME
CMIP5 climate models. This result is not surprising because Third, a more fundamental question is that a parameter
it is well known that climate models have large uncertainties such as PC1 should not be considered to be a sole, exclu-
and biases in local and regional projections of trends of mete- sive, or sufficient proxy of PM2.5 just because PC1 has a
orological parameters. In fact, the evaluation of climate mod- good correlation with PM2.5 . Even a perfect correlation co-
els during the Intergovernmental Panel on Climate Change efficient (1.0) does not imply any causal relationship, let
(IPCC) Fifth Assessment Report (AR5) assessed median- alone an exclusive or sufficient relationship. In other words,
and-above model performance only for the projected global PC1, V850, or RH should not be used to exclude other prox-
average temperature trends (Flato et al., 2013). ies such as those suggested by Wang et al. (2015), Cai et
Second, Fig. 1d of SHEN showed time series of monthly al. (2017), Zou et al. (2017), and Li et al. (2018). The ex-
average PM2.5 and three meteorological parameters, i.e., RH, clusiveness (or sufficient condition) of an index can only be
V850, and PC1. The correlations among PM2.5 , RH, V850, established if a mechanistic model that uses the index as a
and PC1 are very good as reported in SHEN. However, sole proxy can successfully reproduce the concentrations and
most of the good correlations are contributed by the large trend of PM2.5 quantitatively. SHEN did not develop such a
monthly variations. Will the good correlations hold true for model. For example, the variation in severe haze is associ-
yearly variations, and more importantly, will they hold for the ated with the daily variation in weather condition, as shown
timescale of climate change, which is the timescale of con- in Cai et al. (2017), instead of the monthly PC1 given by
cern for SHEN? In addition, will the ratios between PM2.5 SHEN. By using the same data as in SHEN, the correla-
and the three meteorological parameters of longer timescales tion coefficient of PC1 with PM2.5 on a daily basis is 0.68
remain the same as those derived from monthly data? SHEN (Fig. 4b), which is significantly lower than the monthly value
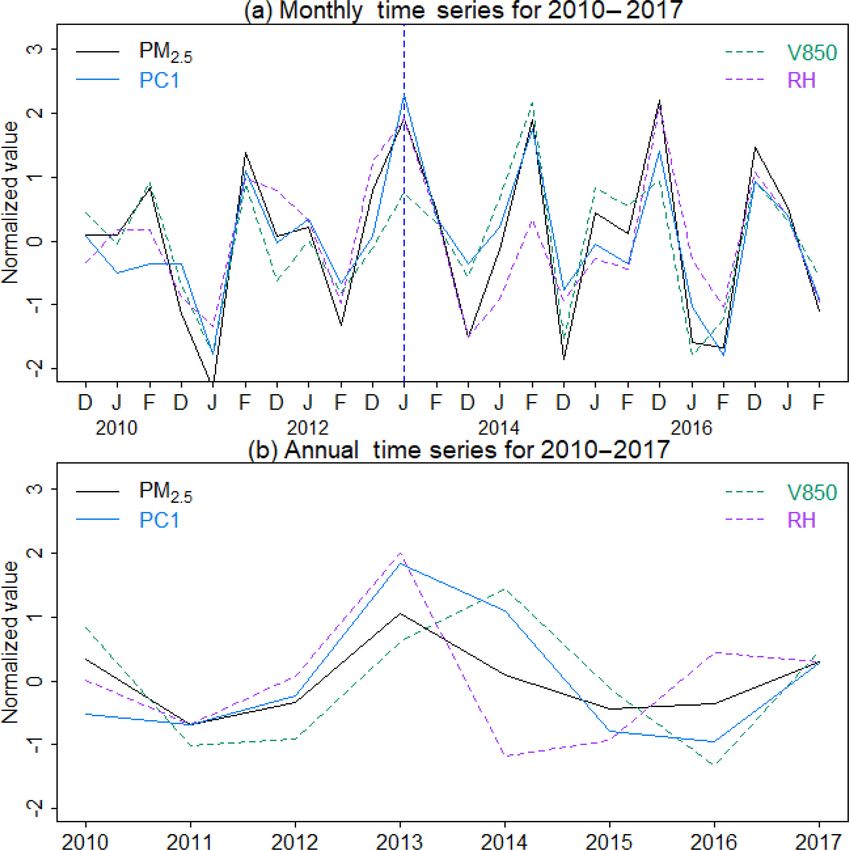
did not address these questions. Here we reproduce Fig. 1d of of 0.90 in Fig. 4a, demonstrating that different correlation
SHEN in Fig. 3a. Correlation coefficients of PM2.5 with PC1, coefficients are found at different timescales again. Further-
V850, and RH derived from Fig. 3a are 0.90, 0.81, and 0.79 more, the correlation coefficient of PC1 with PM2.5 for se-
respectively, consistent with SHEN. In comparison, Fig. 3b vere haze days (days with daily mean PM2.5 concentration
shows yearly average values of PM2.5 , PC1, V850, and RH; ≥ 150 µg m−3 , as defined in Cai et al., 2017) is a small value
their corresponding correlation coefficients are 0.80, 0.66, of 0.34 (Fig. 4c). Therefore, it is inappropriate to use the
and 0.46 respectively. These yearly values are significantly monthly PC1 to predict future severe winter haze pollution
smaller than the monthly values, casting serious doubt on in Beijing as in SHEN. Compared to the large uncertain-
the applicability of results of monthly correlation to longer ties in regional RH from the climate models in SHEN, the
timescales. A further issue is that SHEN did not document haze weather index (HWI) in Cai et al. (2017) is defined by
which parameters were used in the principal component anal- anomalies in large-scale circulation with a three-dimensional
ysis and how PC1 was derived. dynamical concept, which can be captured by climate models
Atmos. Chem. Phys., 19, 8563–8568, 2019 www.atmos-chem-phys.net/19/8563/2019/R. Liu et al.: Comment on Shen et al. (2018) 8567 Figure 3. (a) Monthly mean time series for 2010–2017 of normalized PC1, PM2.5 , V850, and RH. The normalization is relative to the 2010–2017 means; (b) same as (a) except for yearly means. Figure 4. Correlations between PC1 (defined by V850 and RH in SHEN; horizontal axis) with observed wintertime PM2.5 concentrations in Beijing (µg m−3 ; vertical axis) for (a) monthly PM2.5 concentrations and PC1, (b) daily PM2.5 concentrations and PC1, and (c) daily PM2.5 concentrations and PC1 for severe haze days (daily mean PM2.5 ≥ 150 µg m−3 ). In each panel, N is the number of samples in the studied time period of 2010–2017 as in SHEN, and R is the correlation coefficient. www.atmos-chem-phys.net/19/8563/2019/ Atmos. Chem. Phys., 19, 8563–8568, 2019
8568                                                                                    R. Liu et al.: Comment on Shen et al. (2018)

for the past and future (see Cai et al., 2017, for the justifica-       References
tion).
                                                                        Cai, W., Li, K., Liao, H., Wang, H., and Wu, L.: Weather
                                                                           conditions conducive to Beijing severe haze more frequent
Data availability. The CMIP5 model results provided by World               under climate change, Nat. Clim. Change, 7, 257–262,
Climate Research Programme (http://cmip-pcmdi.llnl.gov/cmip5/,             https://doi.org/10.1038/nclimate3249, 2017.
last access: 31 January 2019, Taylor et al., 2012) are available. The   Flato, G., Marotzke, J., Abiodun, B., Braconnot, P., Chou, S. C.,
data of this paper are available upon request to Shaw Chen Liu             Collins, W., Cox, P., Driouech, F., Emori, S., Eyring, V., Forest,
(shawliu@jnu.edu.cn).                                                      C., Gleckler, P., Guilyardi, E., Jakob, C., Kattsov, V., Reason, C.,
                                                                           and Rummukainen, M.: Evaluation of Climate Models, in: Cli-
                                                                           mate Change 2013: The Physical Science Basis. Contribution of
                                                                           Working Group I to the Fifth Assessment Report of the Inter-
Author contributions. RL, LM, and SL performed most the analy-
                                                                           governmental Panel on Climate Change, edited by: Stocker, T.
sis. RL, SL, and HL prepared the paper, with contributions from all
                                                                           F., Qin, D., Plattner, G.-K., Tignor, M., Allen, S. K., Boschung,
co-authors.
                                                                           J., Nauels, A., Xia, Y., Bex, V., and Midgley, P. M., Cambridge
                                                                           University Press, Cambridge, UK, New York, NY, USA, 2013.
                                                                        Li, K., Liao, H., Cai, W., and Yang, Y.: Attribution of anthropogenic
Competing interests. The authors declare that they have no conflict        influence on atmospheric patterns conducive to recent most se-
of interest.                                                               vere haze over eastern China, Geophys. Res. Lett., 45, 2072–
                                                                           2081, https://doi.org/10.1002/2017GL076570, 2018.
                                                                        Mao, L., Liu, R., Liao, W., Wang, X., Shao, M., Liu, S., and Zhang,
Financial support. This research has been supported by the Na-             Y.: An observation-based perspective of winter haze days in four
tional Natural Science Foundation of China (grant no. 91644222)            major polluted regions of China, Natl. Sci. Rev., 6, 515–523,
and the Environmental Public Welfare Industry in China (grant no.          https://doi.org/10.1093/nsr/nwy118, 2018.
201509001).                                                             Shen, L., Jacob, D. J., Mickley, L. J., Wang, Y., and Zhang,
                                                                           Q.: Insignificant effect of climate change on winter haze pol-
                                                                           lution in Beijing, Atmos. Chem. Phys., 18, 17489–17496,
Review statement. This paper was edited by Bryan N. Duncan and             https://doi.org/10.5194/acp-18-17489-2018, 2018.
reviewed by one anonymous referee.                                      Taylor, K., Stouffer, R., and Meehl, G.: An overview of CMIP5
                                                                           and the experiment design, B. Am. Meteorol. Soc., 93, 485–498,
                                                                           https://doi.org/10.1175/BAMS-D-11-00094.1, 2012.
                                                                        Wang, H., Chen, H., and Liu, J.: Arctic sea ice decline intensified
                                                                           haze pollution in eastern China, Atmos. Ocean. Sci. Lett., 8, 1–9,
                                                                           https://doi.org/10.3878/AOSL20140081.
                                                                        Zou, Y., Wang, Y., Zhang, Y., and Koo, J. H.: Arctic sea ice, Eurasia
                                                                           snow, and extreme winter haze in China, Sci. Adv., 3, e1602751,
                                                                           https://doi.org/10.1126/sciadv.1602751, 2017.

Atmos. Chem. Phys., 19, 8563–8568, 2019                                                    www.atmos-chem-phys.net/19/8563/2019/
You can also read


