Estimating uncertainty in radiation oncology dose prediction with dropout and bootstrap in U-Net models
←
→
Page content transcription
If your browser does not render page correctly, please read the page content below
ESANN 2021 proceedings, European Symposium on Artificial Neural Networks, Computational Intelligence
and Machine Learning. Online event, 6-8 October 2021, i6doc.com publ., ISBN 978287587082-7.
Available from http://www.i6doc.com/en/.

                     Estimating uncertainty
              in radiation oncology dose prediction
          with dropout and bootstrap in U-Net models
                       Alyssa Vanginderdeuren1 , Margerie Huet-Dastarac2 ,
                       Ana Maria Barragan-Montero2 , and John A. Lee1,2 ∗

                                  1- UCLouvain.be - ICTEAM
                       Place du Levant 3, 1348 Louvain-la-Neuve - Belgium
                               2- UCLouvain.be - IREC/MIRO
                     Avenue Hippocrate 55 B1.54.07, 1200 Brussels - Belgium

            Abstract.       Deep learning models, such as U-Net, can be used to ef-
            ficiently predict the optimal dose distribution in radiotherapy treatment
            planning. In this work, we want to supplement the prediction model with
            a measurement of its uncertainty at each voxel. For this purpose, a full
            Bayesian approach would, however, be too costly. Instead, we compare,
            based on their correlation with the actual error, three simpler methods,
            namely, the dropout, the bootstrap and a modification of the U-Net. These
            methods can be easily adapted to other architectures. 200 patients with
            head and neck cancer were used in this work.

      1    Introduction
      To fight cancer with radiotherapy, a treatment plan must be devised such that
      it reaches the best tradeoff between disease control and adverse effects. The
      contours of the organs at risk (OAR) and the planning target volume (PTV)
      are drawn on a CT scan of the patient. Based on this information, the medical
      staff optimises the dose distribution to irradiate the PTV at the prescribed dose
      while respecting the dose constraints on the surrounding organs. However, this
      step is time consuming and involves many manual operations, which may lead
      to suboptimal and delayed treatments, compromising the patient outcome.
          A major advance in treatment planning is the use of deep convolutional neu-
      ral networks to predict the optimal dose distribution automatically and quickly.
      Recent literature shows good results with a U-Net architecture on different can-
      cer locations [1, 2, 3]. These models predict the optimal 3D dose distribution
      from the patient’s anatomy (OAR and PTV masks, as well as CT scan) in just a
      few seconds. However, in order to have a safe clinical implementation, physicians
      must know how certain the model is about the prediction. Adding a measure
      of uncertainty makes the prediction more interpretable and increases confidence
      in the prediction when the uncertainty is low. Areas of high uncertainty can be
      corrected manually by a specialist.
          In this work, we first compare the prediction made with the U-Net by ap-
      plying different dropouts and the bootstrap method. We then propose several
         ∗ M. H.-D. and A.M. B.-M. are funded by the Walloon region (PROTHERWAL/CHARP,

      grant 7289). J.A. L. is a Senior Research Associate with the F.R.S.-FNRS.

                                                 511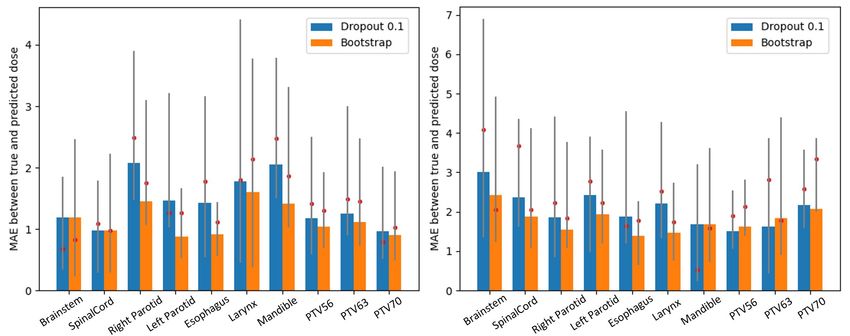
ESANN 2021 proceedings, European Symposium on Artificial Neural Networks, Computational Intelligence
and Machine Learning. Online event, 6-8 October 2021, i6doc.com publ., ISBN 978287587082-7.
Available from http://www.i6doc.com/en/.

      methods to build a voxel-wise uncertainty map, indicating the degree of un-
      certainty in the model. The dropout and bootstrap methods are based on the
      voxel-wise standard deviation calculated on several dose estimates for the same
      patient. Finally, we modified the existing U-Net to predict the error of a trained
      model instead of the dose distribution itself. The methods require little or no
      architecture change and can be easily adapted to other models.
          In the remainder of this paper, Section 2 presents our data and prediction
      model. Section 3 describes the implementation of the different abovementioned
      methods of uncertainty estimation. Next, Section 4 reports the results and
      discusses them. Section 5 concludes this work and sketches some perspectives.

      2    Patient data and dose prediction model
      A database of 200 patients (144 for training, 36 for validation, and for 20 testing)
      with head and neck cancer was used for this work.
          A 3D U-Net architeture with dense connections [1][5] was used as dose pre-
      diction model, including 10 input channels for the anatomy of the patient1 and
      one output channel for the predicted dose distribution. The number of start-
      ing filters was 16 and learning rate was 3 × 10⁻⁴ . More information about the
      architecture can be found in [1].

      3    Methods of uncertainty estimation
      As full Bayesian modelling would be costly, we consider and compare three sim-
      pler approaches, namely, Monte Carlo dropout, bootstrap, and a second similar
      U-Net, with a different output, which predicts the uncertainty of the first U-Net.
          Monte Carlo dropout is frequently used during neural network training
      to avoid overfitting and keep the model fairly general. In addition, by activating
      dropout during testing, we can obtain an approximation of the full Bayesian
      process and induce variation in the prediction of the dose distribution, which can
      later serve to compute the uncertainty [6]. We therefore trained 5 models with
      dropout rates ranging from 0.1 to 0.5. We then evaluated T = 100 times the dose
      distribution for each model and each of the 20 test patients, the predictions being
      all different due to the dropout activation during testing. For each voxel, we can
      compute the standard deviation on the T predictions, which gives us an estimate
      of the uncertainty. In fact, a large standard deviation means that the model
      predicts different values for the same input and can be considered     PT uncertain.
      The formulas that have been proposed in [7] are E(y ∗ ) ≈ T1 t=1 ŷ ∗ (x, Wt ),
      where x is the network input, Wt is the set of weights kept by dropout in testing
      and yˆ∗ is the model prediction. The set Wt is drawn following a Bernouilli
      distribution on the whole set ofq network weights. Eventually, uncertainty U (y ∗ )
                                            PT
      is approximated with U (y ∗ ) ≈ ( T1 t=1 ŷ ∗ (x, Wt )2 ) − E(y ∗ )2 .
         1 target volume, CT scan, map indicating pixels where the dose can be non zero and each

      organ at risk (brainstem, spinal cord, right and left parotids, esophagus, larynx and mandible)

                                                  512
ESANN 2021 proceedings, European Symposium on Artificial Neural Networks, Computational Intelligence
and Machine Learning. Online event, 6-8 October 2021, i6doc.com publ., ISBN 978287587082-7.
Available from http://www.i6doc.com/en/.
Bootstrap relies on the same principle as MC dropout, except that the
T evaluations for each patient are obtained differently. For this method, we
trained T = 20 models with a dropout rate of 0.1 to avoid overfitting. For each
model, the training set consists of 115 patients randomly selected among the 144
available. As soon as the 20 models were trained, we evaluated them on the 20
test patients. Variation in the predictions is no longer due to dropout but to the
different models and actually to their different training sets. The same formulas
as for MC dropout hold, with Wt the set of weights of one model and T = 20.
A secondary, slightly modified U-Net can also help predict uncertainty
in a two-step fashion, by learning it from past examples.
First, a regular model with a dropout rate of 0.1 was trained (modelpred )
on the 144 test and 36 validation patients. The dose distribution of all 200
patients was evaluated with this model T = 50 times, allowing us to compute
the standard deviation and the mean absolute error the model commits when
predicting the dose, i.e., the difference between the ground truth and the mean
of the 50 predictions, for each patient.
Next, a U-Net with additional inputs and a modified output definition is
trained to predict the error committed by modelpred . The dose distribution pre-
diction and the standard deviation were added to the existing inputs (patient
anatomical information). On the output side, the dose prediction was replaced
by the actual error made by the modelpred . A new model (modelerror ) was trained
with the modified U-Net on the basis of the 144 training and 36 validation pa-
tients for whom the dose and standard deviation were previously calculated and
was finally tested on the 20 test patients. The prediction of the error by the
modelerror is considered as a measure of the uncertainty of the modelpred .
Eventually, dividing the uncertainty and error by the dose distribution in
each voxel allows analysing the percentage of uncertainty and error relatively
to the delivered dose in that voxel. This magnifies low uncertainties in OARs,
for instance, where the dose is low but where small unexpected increments may
cause serious side effects. A similar, approximate normalization is to divide the
uncertainty and error by a predicted dose distribution as in practice the actual
true dose would not be available yet.
4 Results and discussion
In this section, the performance of the different methods is compared, starting
with the accuracy of the dropout and bootstrap methods in predicting the dose
distribution. Then, the correlations obtained between the uncertainty maps
and the actual errors are presented. Clinical dose assessment typically involves
statistics, like means, medians, and percentiles of the dose distribution in some
organs and volumes of interest, e.g., Dmax or D95 in PTV and Dmean in OARs.
Figure 1 and Table 1 show the error made by the bootstrap method and the
MC dropout on Dmean and Dmax for different OARs and PTVs. For OARs, the
513ESANN 2021 proceedings, European Symposium on Artificial Neural Networks, Computational Intelligence
and Machine Learning. Online event, 6-8 October 2021, i6doc.com publ., ISBN 978287587082-7.
Available from http://www.i6doc.com/en/.
mean absolute error (MAE) on Dmean is up to 0.63Gy2 smaller with the boot-
strap and 0.5Gy lower for D2 (Brainstem). Regarding the PTV, the bootstrap
is up to 0.18Gy better than the dropout (D95 ). Dmax is however better with the
dropout for PTV56 and PTV63 (0.12 and 0.2Gy smaller), the bootstrap makes
an error of 2.28% (PTV56) and 2.46% (PTV63) on the actual Dmax value.
Fig. 1: On the left: Mean Absolute Error on Dmean [Gy]. On the right : Mean
Absolute Error on Dmax [Gy]. The bars represent the mean on test patients, red
point indicates the median and the grey line connects quantiles 0.25 and 0.75.
PTV/OAR Dropout=0.1 Dropout=0.2 Dropout=0.3 Dropout=0.4 Dropout=0.5 Bootstrap
Dmean Brainstem 1.19 ± 1.64 1.14 ± 1.2 1.28 ± 1.58 1.32 ± 1.41 1.21 ± 1.45 1.19 ± 1.39
SpinalCord 0.98 ± 0.92 1.13 ± 0.91 1.24 ± 1.04 1.13 ± 0.99 1.19 ± 1.2 0.98 ± 0.98
Right Parotid 2.07 ± 1.5 2.08 ± 1.26 1.88 ± 1.17 1.35 ± 1.01 2.13 ± 1.41 1.46 ± 0.93
Left Parotid 1.46 ± 1.21 1.81 ± 1.17 1.51 ± 1.16 1.22 ± 0.77 1.26 ± 0.89 0.88 ± 0.64
Esophagus 1.42 ± 1.16 1.44 ± 0.83 0.93 ± 0.66 1.05 ± 0.82 0.89 ± 0.84 0.92 ± 0.8
Larynx 1.78 ± 1.67 2.04 ± 1.9 1.67 ± 1.09 1.84 ± 1.98 2.98 ± 2.4 1.6 ± 1.36
Mandible 2.05 ± 1.37 1.92 ± 1.38 1.61 ± 0.97 1.43 ± 0.91 2.31 ± 1.95 1.42 ± 0.79
D95 PTV56 1.45 ± 1.25 1.52 ± 1.39 1.1 ± 1.06 1.54 ± 0.99 1.7 ± 1.2 1.39 ± 1.05
PTV63 1.73 ± 1.89 1.98 ± 1.86 1.91 ± 1.56 1.69 ± 1.92 1.93 ± 1.98 1.63 ± 1.87
PTV70 1.68 ± 1.02 1.75 ± 1.46 3.03 ± 1.28 1.37 ± 1.0 2.18 ± 1.37 1.5 ± 0.93
Dmax PTV56 1.5 ± 1.05 1.73 ± 1.34 1.85 ± 1.3 1.69 ± 1.08 1.11 ± 0.94 1.62 ± 0.93
PTV63 1.63 ± 1.19 2.17 ± 1.35 2.04 ± 1.29 2.27 ± 1.19 0.96 ± 0.64 1.83 ± 1.42
PTV70 2.17 ± 1.89 2.55 ± 1.53 2.19 ± 1.01 2.69 ± 1.27 2.32 ± 2.31 2.08 ± 0.96
D2 Brainstem 2.99 ± 2.48 2.22 ± 1.87 2.52 ± 2.17 3.14 ± 2.26 2.44 ± 2.09 2.49 ± 1.86
SpinalCord 1.9 ± 1.51 1.85 ± 1.28 1.93 ± 1.19 2.01 ± 1.38 3.06 ± 2.22 1.82 ± 1.43
Legend : Best result Worst result
Table 1: Comparison of mean error [Gy] and standard deviation [Gy] of the
investigated methods for the different regions of interest.
The correlation between the uncertainties obtained and the error on the dose
prediction was evaluated on the PTV and outside the PTV (Body-PTV). It is
of maximum 0.47 (Body-PTV) and 0.1 (PTV) for the MC dropout, 0.513(Body-
PTV) and 0.017(PTV) for the bootstrap, 0.5(Body-PTV) and 0.223(PTV) for
the modified U-Net. The modified U-Net is therefore the method providing the
2 The Gray (symbol Gy) is the SI unit of absorbed dose and is defined as the absorption
of one joule of energy, in the form of ionizing radiation, per kilogram of matter, i.e. one gray
= 1 J/kg 2 [8].
514ESANN 2021 proceedings, European Symposium on Artificial Neural Networks, Computational Intelligence
and Machine Learning. Online event, 6-8 October 2021, i6doc.com publ., ISBN 978287587082-7.
Available from http://www.i6doc.com/en/.
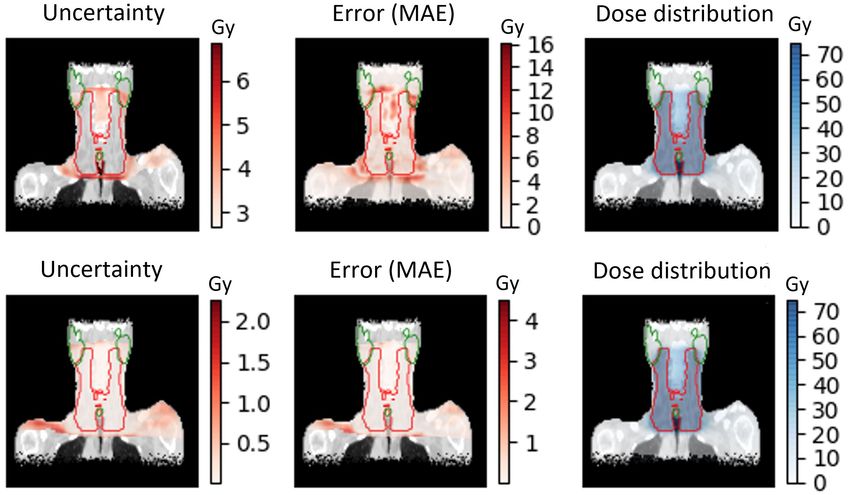
Fig. 2: Top : Comparison of the uncertainty obtained with the Modified U-
Net (left), the error on the dose distribution (middle) and the dose distribution
(right). Bottom : Comparison of the uncertainty obtained with the Modified
U-Net divided by the dose distribution (left), the error on the dose distribution
divided by the dose distribution (middle) and the dose distribution (right)
best uncertainty map in general. A comparison of the uncertainty map with the
error map is shown in Figure 2(top figure) for the modified U-Net. The selected
slice is located at the centre of the tumor delineated in red on the picture. Right
and left parotid, mandible and a part of the esophagus are represented in green.
When the uncertainty is divided by the dose distribution, the correlations are
much better on the body-PTV: 0.7 (Body-PTV) and 0.215 (PTV) maximum for
the MC dropout, 0.714 (Body-PTV) and 0.1 (PTV) for the bootstrap, 0.714
(Body-PTV) and 0.27 (PTV) for the modified U-Net, which is again the best
indicator of the uncertainty. An illustration of this operation is shown in Figure
2(bottom) for the same patient and slice as used for the top Figure 2.
Finally, when we divide the uncertainty and error by the dose prediction
rather than by the actual dose we find the following correlations: 0.55 (Body-
PTV) and 0.17 (PTV) for the MC dropout, 0.56 (Body-PTV) and 0.09 (PTV)
for the bootstrap, 0.56 (Body-PTV) and 0.274 (PTV) for the modified U-Net.
Concerning the prediction of the dose distribution, the MC dropout gives
better overall results when the dropout rate is 0.1. However, the bootstrap
method offers better accuracy for most of the measured metrics, especially on
the OARs for which the dose is lower than on the PTV. The only measured metric
for which the bootstrap gives worse results is the Dmax , but with a relatively
low error percentage. Regarding the prediction of the uncertainty measure, the
U-Net model adapted to the prediction of the error provides the most correlated
measure with the error on the PTV as well as one of the best correlations on
the Body-PTV with similar results as the bootstrap. We notice a clear increase
515ESANN 2021 proceedings, European Symposium on Artificial Neural Networks, Computational Intelligence
and Machine Learning. Online event, 6-8 October 2021, i6doc.com publ., ISBN 978287587082-7.
Available from http://www.i6doc.com/en/.
in the correlation when using dose distribution normalization. Although this
result is theoretical as the exact dose distribution is unknown in a real case, it
is encouraging and suggests the presence of an interesting relationship.
5 Conclusion and perspectives
We presented several methods that can give a relative measure of model uncer-
tainty combined with a prediction of the dose distribution. These methods have
the advantage of being cheap, unlike Bayesian modelling, as well as being easily
adaptable to other architectures and even other domains of application. These
affordable measures of uncertainty could be integrated into an active learning
algorithm for which a database with a limited number of annotations would be
available.The algorithm would identify regions of high uncertainty that would
be reported to professionals who would be asked to manually annotate the im-
ages by optimising the dose distribution over a specific area by hand. The new
annotations would subsequently extend the training data set. The areas that
require annotation by a specialist are thus optimally and economically selected,
avoiding the need to annotate the whole set of images. A similar idea of active
learning was proposed in [9] where the error committed on the prediction by the
model is predicted by an additional module and the unlabeled datasets with the
largest predicted error were presented to a specialist to be labelled by hand.
References
[1] Nguyen D, Long T, Jia X, et al. A feasibility study for predicting optimal radiation
therapy dose distributions of prostate cancer patients from patient anatomy using deep
learning. Sci Rep. 2019;9(1):1076.
[2] Barragán-Montero AM, Nguyen D, Lu W, et al. Three-dimensional dose prediction for
lung IMRT patients with deep neural networks: robust learning from heterogeneous beam
configurations. Med Phys. 2019;46(8):3679-3691.
[3] Nguyen D, Jia X, Sher D, et al. 3D radiotherapy dose prediction on head and neck cancer
patients with a hierarchically densely connected U-net deep learning architecture. Physics
in Medicine & Biology. 2019;64(6):065020.
[4] Babier A, Zhang B, Mahmood R, et al. OpenKBP: The open-access knowledge-based
planning grand challenge. arXiv [physics.med-ph]. Published online November 28, 2020.
http://arxiv.org/abs/2011.14076
[5] O. Ronneberger O, Fischer P, Brox T. U-Net: Convolutional Networks for Biomedical
Image Segmentation. In: Medical Image Computing and Computer-Assisted Intervention
- MICCAI 2015. Springer International Publishing; 2015:234-241
[6] Gal Y, Ghahramani Z. Dropout as a Bayesian Approximation: Representing Model Un-
certainty in Deep Learning. In: International Conference on Machine Learning. PMLR;
2016:1050-1059
[7] Nguyen D, Sadeghnejad Barkousaraie A, Bohara G, et al. A comparison of Monte Carlo
dropout and bootstrap aggregation on the performance and uncertainty estimation in
radiation therapy dose prediction with deep learning neural networks. Phys Med Biol.
2021;66(5):054002.
[8] Murphy A, Dr J Bell D, et al. Gray (SI unit). https://radiopaedia.org/articles/gray-si-unit
[9] Yoo D, Kweon IS. Learning Loss for Active Learning. 2019 IEEE/CVF Conference on
Computer Vision and Pattern Recognition (CVPR). Published online 2019.
516You can also read