The Application of Gravity Model in Scenario-based Forecasting for Airport Feasibility Study - Ametis Institute
←
→
Page content transcription
If your browser does not render page correctly, please read the page content below
WORKING PAPER SERIES NO. 091-2016, AMETIS INSTITUTE

 The Application of Gravity Model in Scenario-based
 Forecasting for Airport Feasibility Study

 Rolan Mauludy Dahlan Santi Novani
 Ametis Institute and School of Business and Management
 School of Business and Management Institut Teknologi Bandung
 Institut Teknologi Bandung Bandung, Indonesia
 rolan.mauludy@sbm-itb.ac.id snovani@sbm-itb.ac.id

 Abstract— Airport Industry is very dynamic. It often appears happens if the rival airport development delayed for several
many new plans from the internal and from the environment. To years? What happens if the development of the rival airport is
anticipate the various possibilities outcome that may occur in the canceled? To anticipate the various possibilities outcome that
future we need scenario-based forecasting for the number of may occur in the future we need scenario-based forecasting [4]
passengers. Here the authors use a gravity model which is for the number of passengers. Projections of the number of
implemented in the spatial landscape. To get the best results, the passengers will affect the business feasibility and future
parameters are optimized by compare the result with empirical development strategies. If the number of passengers is below the
data through numerical analysis approach. The verification threshold then the business is not feasible to be implemented.
process in the Western part of Java Island showed that this model
 The dynamic of passengers will affect the airport development
provide a good result when compared with empirical data. After
optimizing the parameters, we may create a scenario-based
 strategy, for example design capacity at early stage, timing, and
projections by determine airport capacity and growth rates at design capacity in the next stage and the integration between the
specific time. Projections of the number of passengers will affect early stage and the next stage.
the business feasibility and future development strategies. The purpose of this research is to create a scenario based
 passenger projections. This spatial approach is constructed
 Keywords— scenario-based forecasting; spatial analysis; gravity based on the gravity models that mimic gravitational interaction
model; numerical analysis; feasibility study
 as described in Isaac Newton's law of gravity. Gravity models
 I. INTRODUCTION are used in various social sciences, for example the gravity
 model of international trade [5], trip distribution [6] and gravity
 The western part of Java Island, which consists of the model of migration [7]. In this study the parameter of the gravity
province of West Java, Jakarta and Banten, is the most densely model is optimized by using numerical analysis on empirical
populated areas in Indonesia. In 2014, the area of 45,700 square data.
kilometers is inhabited by 68.15 million people or about 1,491
people per square kilometer [1]. After the Asian crisis in 1998, II. THEORETICAL FOUNDATIONS
the number of middle class grew significantly and encourages
purchasing power [2]. The combination of the huge number of A. GIS for Transportation (GIS-T)
population and increased purchasing power creates new Geographic information system (GIS) are interconnected
challenges, including in the air transportation industries. hardware, software, data, people, organizations and institutional
 arrangements for collecting, storing, analyzing and
 In this region, the number of passenger increased very communicating particular types of information about the earth.
rapidly. It rose from 11.88 million passengers per year (2001) to GIS-T is one of the most important applications of GIS [8]. GIS-
61.54 million passengers per year (2014), or an average of T application covers much of the broad scope of transportation,
13.99% per year [3]. They are only served by three airports, from infrastructure planning, public transit operation, traffic
namely Soekarno-Hatta (CGK), Husein Sastranegara (BDO) analysis and control to hazard mitigation. The format of the
and Halim Perdanakusuma (HLP). This is very difficult to fulfill spatial data storage varied, from vector data (represent features
the passenger growth. The Indonesian government has been as discrete points, lines, and polygons) to raster data (represent
tried to resolve this problem by making a lot of plans that will the landscape as a rectangular matrix of square cells) [9].
be run simultaneously. The first plan is to enlarge the existing
airport capacity. The second plan is to encourage state-owned B. Distance
enterprises and the private investors to build a new airport, such There are many concepts of distance in mathematics, for
as Kertajati (XX1) and South Karawang (XX2). examples Euclidean distance, spherical Distance, Manhattan
 This parallel development plans increase the level of
uncertainty for investors. They are faced with a number of
questions. What would happen if the rival airports are built?
What happens if the rival airport increases its capacity? What
distance, Chessboard distance, Hamming distance and so on. In Where:
this study we use spherical distance or the minimum distance
between two points on the surface of the spherical object [10]. : ( 0 , 0 ; 1 , 1 ; … ; −1
, −1 ) → ( ̅ , ̅ ) (2)
Euclidean distance or the minimum distance between two points The transformation process assumes that the two-
in Euclidean space [11] is not realistic to describe the distance dimensional polygon has a uniform density. Centroid can be
on the earth's surface. We don’t use Manhattan distance or the calculated by [16]:
total distance that connect the segments between two points in −1
space [12] because of data limitations. 1 (3)
̅ = ∑( + +1 ) ∙ ( ∙ +1 − +1 ∙ )
C. Numerical Analysis 6
=0
Numerical analysis is the branch of mathematics which is And
used to find approximations to difficult problems such as finding −1
the roots of non−linear equations, integration involving complex 1 (4)
expressions and solving differential equations for which ̅ = ∑( + +1 ) ∙ ( ∙ +1 − +1 ∙ )
6
=0
analytical solutions do not exist [13]. There are many
mathematical problem cannot be solved by analytic methods. is the area of the polygon, where:
Sometimes we have to use numerical analysis or study of
1 −1 (5)
algorithms that use numerical approximation for the problems of = ∑ ( ∙ − +1 ∙ )
mathematical analysis. The invention of the computer also 2 =0 +1
influenced the field of numerical analysis, since now longer and
more complicated calculations could be done.
D. Gravity Model
Gravity models that mimic gravitational interaction as
described in Isaac Newton's law of gravity are used in various
social sciences. This approach is used to measure the interaction
between two separate things based on economic mass and spatial
distance. The gravity model illustrates the macroscopic
relationships between places. The Economic mass increase the
interaction between the two regions, while the distance reduces
the interaction between the regions. There are many application
of gravity model in spatial problem, for example the gravity
model of international trade [5], trip distribution [6] and gravity
model of migration [7].
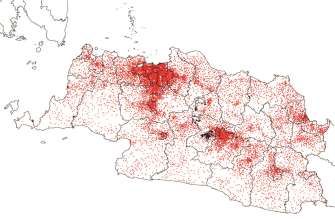
E. Related Research Fig. 1. 7,735 villages or urban communities in the western part of the island.
Tobias Grosche, Franz Rothlauf and Armin Heinzl [14] used
gravity models for the estimation of air passenger volume
between city-pairs in European countries. Their models showed
a good fit to the observed data and are statistically tested and
validated. Fengjun Jin, Fahui Wang and Yu Liu also used gravity
models for the estimation of air passenger volume between cities
in China [15]. But unfortunately these two models only explore
the interaction between cities or airports, not the relationship
between the distributions of the population to the airports.
III. METHODOLOGY
In this study we tried to examine the relationship between
the distributions of the population to the airport. About 68.15
million people in the western part of the island of Java inhabit
7,735 desa (villages) or kelurahan (urban communities).
Map of villages or urban communities ( ) are in polygons
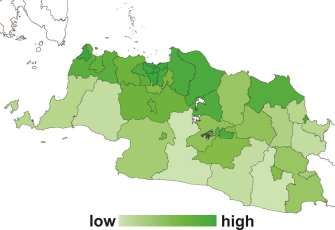
format ( ).To be analyzed further, it needs to be transformed Fig. 2. The spatial distribution of the population in the western part of the
( ) into a point or centroid ( ) or geometric center of a plane island of Java.
figure is the arithmetic mean ("average") position of all the
points in the shape. Total number of passengers ( ) at time grow at rate .
: → (1) = −1 ∙ (1 + ) (6)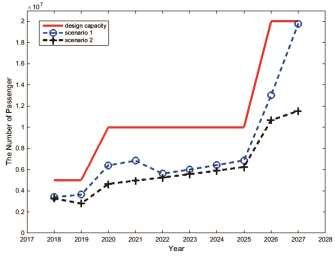
We assume the number of passengers ( ) of a villages or urban The number of passengers at airports at time ( , ) is
communities ( ) is directly proportional to population ( ) and calculated using the following pseudo algorithm:
income per capita (π), or:
 For i=1:I
 , ~ , ∙ , (7) Search i*,j* where ∗, ∗, = max( )
Where: ∗, = ∗, + ∗,
 For j=1:J
 = ∑ , (8)
 ∗, = 0
 ∀
 End
 If ∗, > ∗,
 For i=1:I
 , ∗ = 0
 End
 End
 End

 There are 2 possible outputs: if ∑∀ , ≥ then
 ∑∀ , = = ∑∀ , and if ∑∀ , < then ∑∀ , =
 , < = ∑∀ , .
 The power coefficient of spherical distance ( ) in gravity
 model is optimized by using numerical analysis [13] on
 empirical data. Figure 5 show the mean absolute percentage
 error of the power coefficient of spherical distance ( )
Fig. 3. The spatial distribution of the income per capita in the western part of compared with empirical data of passengers in 2015. The
Java Island. smallest value of mean absolute percentage error (MAPE) is
 4.75% when = 2.0.
 There are three existing airports, namely Soekarno-Hatta
(CGK), Husein Sastranegara (BDO) and Halim Perdanakusuma
(HLP). There are also two candidates of new airport, namely
Kertajati (XX1) and South Karawang (XX2).

 Fig. 5. Mean absolute percentage error of the power coefficient of spherical
Fig. 4. 3 existing airport and 2 candidates of new airport in the western part of distance (k) compared with empirical data of passengers in 2015.
the island of Java.
 IV. RESULT
 The interaction force ( ) between passengers in a villages
or urban communities ( ) and airport ( ) is calculated through After optimizing the parameters, we can predict the number
gravity models [5-7], which simply: of passengers at specific airport in certain scenarios by
 , determine airport capacity ( , ) and growth rates ( ) at specific
 (9)
 , , ~ time. In this case there are millions possible scenarios.
 ,
 We tried to implement this model in case of planninf new
Where is capacity of the airport, is spherical distance airport in Kertajati (XX1). XX1 was targeted to serve 5 million
between villages or urban communities ( ) and airport ( ) and passengers per year in 2018, 10 million in 2020 and 20 million
is power coefficient of spherical distance. in 2026.
Scenario 1: environment. The strategic plan that was created before is
 become irrelevant. We need the forecasting method that can be
 The XX1 feasibility study was made in 2013 without adapted easily in many possible scenarios. To anticipate the
information about XX2 airport. CGK's capacity will increase various possibilities outcome that may occur in the future we
40% after the operation of a third runway in 2022. HLP will be need scenario-based forecasting for the number of passengers.
expanded to reach 11.5 million passengers per year in 2020.
They assumed that BDO can be closed in 2020. The economic Scenario-based forecasting is needed to anticipate the
situation is very bright after a very explosive passenger growth dynamic airport industry situations. Gravity model can be used
from 2001 to 2012. The number of passengers is expected to to make projections of passenger based on scenarios. To get the
increase by 7% per year. This situation is called scenario 1. best results, the parameters are optimized by compare the result
 with empirical data through numerical analysis approach. In the
Scenario 2: case of the western part Java Island, the mean absolute
 In early 2016 there was new plan of XX2 airport that can percentage error (MAPE) of this model is only 4.75%, meaning
serve 20 million passengers per year and will be operational in that this model provides a relatively good estimation value.
2023. The operation plan of the third runway at CGK will be After optimizing the parameters, we can create a scenario-
accelerated into 2019. No change of plan in HLP. Because of
 based projections by determine airport capacity ( , ) and growth
public resistance BDO will not be closed. After economic
slowdown in 2012-2015, passenger growth is corrected at only rates ( ) at specific time. The result of this projection is very
6% per year. This new situation is called scenario 2. important for the government and investors to construct a new
 strategic plan.
 REFERENCES

 [1] BPS, "Laporan Bulanan Data Sosial Ekonomi," Badan Pusat Statistik,
 Jakarta, 2014.
 [2] A. Budiman, H. Chhor, R. Razdan and A. Sohoni, "The New Indonesian
 Consumer," McKinsey & Company, Jakarta, 2012.
 [3] BPS, "Statistik Transportasi Udara 2014," Badan Pusat Statistik, Jakarta,
 2015.
 [4] M. G. Nimmo , V. H. Nguyen and Y. Shin, "Using Global VAR Models
 for Scenario-Based Forecasting and Policy Analysis," in The GVAR
 Handbook: Structure and Applications of a Macro Model of the Global
 Economy for Policy Analysis, Oxford, Oxford University Press, 2013, pp.
 97-112.
 [5] S. S. Nello, The European Union: Economics, Policies and History,
 McGraw Hill Education, 2009.
 [6] D. M. Levinson and A. Kumar , "A Multi-modal Trip Distribution
 Model," Transportation Research Record, vol. 1466, p. 124–131, 1995.
 [7] J.-P. Rodrigue, C. Comtois and B. Slack, The Geography of Transport
Fig. 6. The calculation results of the number of passenger for scenario 1 and Systems, Routledge, 2009.
scenario 2 compared to its design capacity. [8] H. Miller and S. Shih-Lung, Geographic Information Systems for
 Transportation: Principles and Applications, Oxford University Press,
 This model can be used to make scenario-based projections 2001.
of passengers. Figure 6 show the calculation results of the [9] D. Peuquet and D. Marble, Introductory Readings In Geographic
 Information Systems, London: Taylor and Francis, 1990.
number of passenger for scenario 1 and scenario 2 compared to
 [10] T. Rowland, "Spherical Distance," Wolfram MathWorld, [Online].
its design capacity. Due to limited capacity of the airports in Available: http://mathworld.wolfram.com/SphericalDistance.html.
Greater Jakarta, in scenario 1, the number of passengers in XX1 [Accessed 11 September 2016].
will increase significantly after 2025 However in scenario 2 the [11] E. Deza and M. Deza, Encyclopedia of Distances, Springer, 2009.
significant increase will not appear because the development of [12] M. Barile, "Taxicab Metric," Wolfram MathWorld, [Online]. Available:
XX2. Utilization of installed capacity will be less than 60% in http://mathworld.wolfram.com/TaxicabMetric.html. [Accessed 11
2027. September 2016].
 [13] S. Karris, Numerical Analysis Using MATLAB and Excel, Orchard
 Amendment of airport planning by the government will Publications, 2007.
affect the competitive landscape of business. This method will [14] T. Grosche, F. Rothlauf and A. Heinzl, "Gravity Models for Airline
be beneficial for the government and investors to anticipate the Passenger Volume Estimation," Journal of Air Transport Management,
new plans through the revision of the old and irrelevant strategic vol. 13, no. 4, p. 175–183, 2007.
plan. [15] F. Jin, F. Wang and Y. Liu, "Geographic Patterns of Air Passenger
 Transport in China 1980–1998: Imprints of Economic Growth, Regional
 V. CONCLUSION Inequality, and Network Development," The Professional Geographer,
 vol. 56, no. 4, p. 471–487, 2004.
 Airport industry is very dynamic especially in the long term. [16] M. Worboys and M. Duckham , GIS: A Computing Perspective, Second
It often appears many new plans from the internal and from the Edition, CRC Press, 2004.
You can also read