NEUTRON NOISE SPECTRAL FEATURES OF SIMULATED MECHANICAL AND THERMAL-HYDRAULIC PERTURBATIONS IN A PWR CORE
←
→
Page content transcription
If your browser does not render page correctly, please read the page content below
EPJ Web of Conferences 247, 21001 (2021)                                                               https://doi.org/10.1051/epjconf/202124721001
PHYSOR2020

              NEUTRON NOISE SPECTRAL FEATURES OF SIMULATED
           MECHANICAL AND THERMAL-HYDRAULIC PERTURBATIONS IN A
                                PWR CORE

                     L.A Torres1, D. Chionis2, C. Montalvo1, A. Dokhane2, A. García-Berrocal1
                        1
                        Energy and Fuels Department, Universidad Politécnica de Madrid (UPM)
                                            Ríos Rosas 21, 28003 Madrid, Spain
                    2
                      Paul Scherrer Institut, Laboratory for Reactor Physics and Thermal-Hydraulics,
                                 Forschungsstrasse 111, 5232 Villigen-PSI, Switzerland

                  la.torres@alumnos.upm.es, dionysios.chionis@psi.ch, abdelhamid.dokhane@psi.ch,
                              cristina.montalvo@upm.es, agustin.garciaberrocal@upm.es

                                                                   ABSTRACT

                 KWU-PWR reactors (SIEMENS design) are commonly exhibiting high neutron noise levels
                 that can lead to costly operational issues. Recent analysis seems to indicate that, coolant flow,
                 temperature oscillations, and mechanical vibrations have a key impact on neutron noise
                 phenomena. In order to advance in understanding this phenomenon, the transient nodal code
                 SIMULATE-3K (S3K) has been already utilized to simulate scenarios with individual or
                 combined types of perturbation sources: mechanical vibrations of fuel assemblies and thermal-
                 hydraulic fluctuations at the core inlet. In this work, new simulations are performed with all
                 the perturbations applied simultaneously. The simulated neutron detectors responses are then
                 analyzed with noise analysis techniques. All the simulated spectral features of neutron noise
                 are compared to those obtained from real plant data. Results show that the simulated neutron
                 noise phenomenology behaves similarly to that obtained from real plant data by increasing the
                 fluctuation amplitude in the inlet coolant flow in the S3K calculations.

         KEYWORDS: SIMULATE-3K, noise analysis, mechanical vibrations, thermal-hydraulic fluctuations

                                                            1. INTRODUCTION

         Recently the normalized root mean square (NRMS) of neutron detectors signals have experienced an
         increase in certain German, Spanish and Swiss pre-Konvoi and Konvoi pressurized water reactors (PWRs)
         [1-4]. The physical causes behind this raise is under research by many institutions and within the framework
         of the EU project CORTEX (Core Monitoring Techniques Experimental Validation and Demonstration).
         Advanced neutron noise modeling using state of the art simulation tools are compared against real plant
         data within the CORTEX project in order to extract useful spectral features of the underlying phenomena.

         In a previous publication [5], used as a basis for the current paper, a series of simulations were performed
         with the transient 3D nodal code SIMULATE-3K (S3K). All simulations assumed only one type of the
         following perturbations: fuel bundle vibrations (synchronized vibration of a central cluster of 5x5
         assemblies following either a white noise signal or a 1.5 Hz sine wave signal), and coolant flow fluctuations
         or coolant temperature fluctuations at the core inlet. The simulated data were analyzed by means of noise
         analysis techniques and several spectral features were found similar to those of the real plant data. The main
         conclusions from this approach are the following:

  © The Authors, published by EDP Sciences. This is an open access article distributed under the terms of the Creative Commons Attribution License 4.0
  (http://creativecommons.org/licenses/by/4.0/).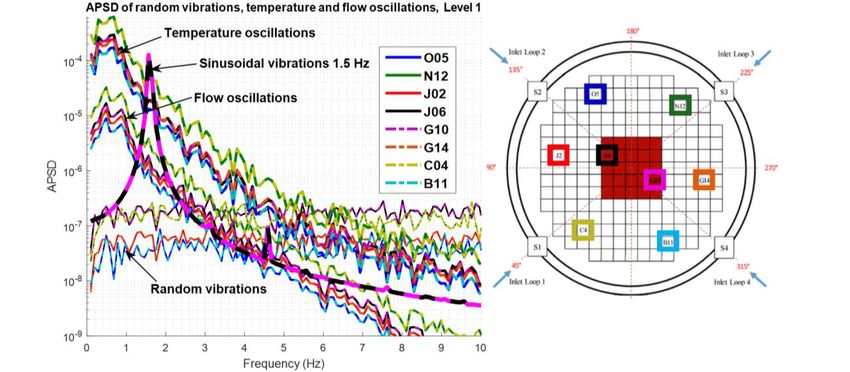
EPJ Web of Conferences 247, 21001 (2021)                                              https://doi.org/10.1051/epjconf/202124721001
PHYSOR2020

         -   In the scenarios with mechanical vibrations, detectors, located at opposite sides of the direction of the
             vibration, showed an out-of-phase relationship in the entire frequency range; i.e. a phase distribution
             dividing the reactor into two halves clearly differentiated by ±180o. In addition, the phase relationship
             is zero between detectors located at the different axial levels of the same instrumentation string.
         -   In the thermal-hydraulic scenarios, two main characteristics were observed. On the one hand, a linear
             phase difference between neutron detectors located at different axial levels and at the same azimuthal
             location (due to the transport phenomenon). On the other hand, a high amplitude of the neutron noise
             spectra below 1 Hz. It has been found also that, the temperature fluctuations are the main cause of the
             high amplitude of the spectra at low frequency.
         -   The spectral characteristics of the neutron noise cannot be explained by one single noise source but by
             a combination of all types of perturbations.

         In line with [5-7], the current paper discusses the results obtained from the analysis of several new
         simulations. The simulated scenarios are based on the combination of two and three types of perturbations,
         i.e. fuel bundle lateral vibrations, and inlet coolant flow and temperature fluctuations. The amplitude of
         these perturbations have been modified in every simulation to observe the differences in the spectral
         characteristics of neutron noise. The final goal is to resemble as much as possible the real plant noise
         phenomenology and link the spectral characteristics of neutron noise with the physical causes behind it.
         The current paper presents the most important characteristics obtained from each set of simulations. Due to
         the high number of simulated scenarios, the observed neutron noise spectral features have been organized
         properly in order to perform a meaningful assessment.

                                2. NEUTRON NOISE MODELLING IN SIMULATE-3K

         The transient nodal code S3K is used in this work for modelling various types of noise sources and assessing
         their impact on the neutron noise behavior. To this aim, the PWR core, developed in the framework of the
         OECD/NEA transient benchmark [8], is modelled using the CASMO5/SIMULATE3/S3K codes sequence.
         Three types of noise sources are studied in this work by performing transient calculations in S3K. First,
         fuel assemblies can laterally vibrate, by modifying the water gap widths between the oscillating bundles
         and their adjacent ones, as described in [9]. In addition to that, the inlet coolant temperature and flow can
         be imposed to fluctuate in each of the four coolant loops of the core. The transient evolution of the neutron
         flux is monitored using eight in-core neutron detector instrumentation tubes, which are distributed radially
         in the core, as presented in Figure 1. Each instrumentation tube contains six in-core neutron detectors,
         equally distributed in the axial direction. Consequently, the neutron noise spatial distribution, as results
         from the imposed perturbations, can be estimated and then analyzed using signal and noise analysis
         techniques, as it is discussed in the next section.

                                  3. SIGNALS AND NOISE ANALYSIS TECHNIQUES

         The main tool of noise analysis techniques is based on observing the response of the neutron detector
         sensors in the frequency domain through the Fourier transform of the autocorrelation function [10], the so-
         called auto power spectral density (APSD), defined as:


                                      APSD( f )   Cxx ( )e j 2 f  d                           (1)


         being τ the lag used when estimating the autocorrelation function of the sensor output signal Cxx(τ).
         Analogously, for two variables, we can calculate the cross power spectrum density (CPSD) through the
         Fourier transform of the cross correlation between both signals:

                                                                   2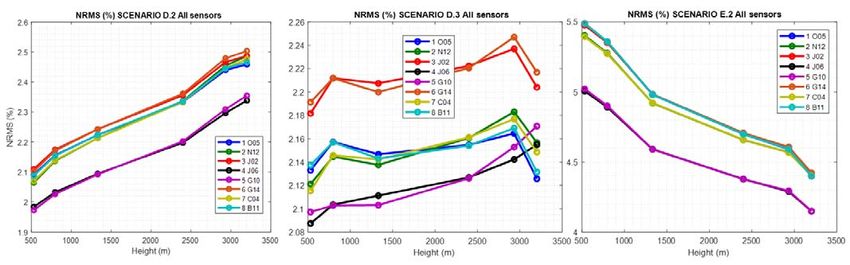
EPJ Web of Conferences 247, 21001 (2021)                                                https://doi.org/10.1051/epjconf/202124721001
PHYSOR2020


                                     CPSD( f )   Cxy ( )e j 2 f  d                             (2)


         being Cxy the cross correlation between signals x and y. These functions can be used to calculate the signals’
         pairwise coherence (COH2) and their phase difference (PHASE), defined as:

                                                                      2
                                                   CPSD( f )
                                    COH ( f )
                                           2
                                                                                                       (3)
                                                APSD1 ( f ) APSD2 ( f )

                                                          Im CPSD( f )
                                    PHASE ( f )  arctg                                                (3)
                                                          Re CPSD( f )

         The coherence function takes values between 0 and 1. A zero coherence means no correlation, whereas,
         coherence equals one means total correlation. The PHASE is defined as the phase angle difference between
         the analyzed pair of signals. An in-phase or out-of-phase relationship between the analyzed signals is given
         by a 0° or 180° phase, respectively.

                                     4. COMBINED PERTURBATIONS SCENARIOS

         The simulated scenarios analyzed in the current paper are the following:

         -   Scenario A: This case assumes the combined effect of the fluctuation of the inlet coolant flow and the
             inlet coolant temperature in all four coolant loops. The inlet coolant flow and inlet coolant temperature
             are randomly fluctuating with amplitude of ±1% and ±1 ºC, respectively.

         -   Scenarios B.1 and B.2: These two scenarios study the combined effect of the fuel assemblies vibration
             with Scenario A, i.e. the fluctuation of the inlet coolant flow and the inlet coolant temperature in all the
             coolant loops. The inlet coolant flow and inlet coolant temperature are randomly fluctuating with
             amplitude of ±1% and ±1 ºC, respectively. The vibration of the central cluster of 5x5 fuel assemblies,
             shown in Figure 1, is only in the X-direction and follows a white noise signal (random displacement)
             with a displacement amplitude of 0.5 mm and 1 mm in Scenarios B.1 and B.2, respectively.

         -   Scenarios C.1 and C.2: These cases are similar to the B scenarios, with the only difference that the
             vibrating cluster follows a sine wave signal of 1.5 Hz with displacement amplitude of either 0.5 mm
             (C.1) or 1 mm (C.2).

         The last two simulation sets, intent to perform a sensitivity analysis studying the effect of the variation of
         the amplitudes of the FA vibrations (white noise or sine wave), and the coolant flow and temperature
         fluctuations on the neutron noise behaviour. To this aim, eight scenarios are considered:

         -   Scenario D.1: ±2 %, ±1 ºC, white noise signal with a displacement amplitude of 0.5 mm.
         -   Scenario D.2: ±3 %, ±1 ºC, white noise signal with a displacement amplitude of 1 mm.
         -   Scenario D.3: ±2 %, ±1 ºC, sine wave signal of 1.5 Hz with a displacement amplitude of 0.5 mm.
         -   Scenario D.4: ±3 %, ±1 ºC, sine wave signal of 1.5 Hz with a displacement amplitude of 1 mm.

         -   Scenario E.1: ±1 %, ±2 ºC, white noise signal with a displacement amplitude of 0.5 mm.
         -   Scenario E.2: ±1 %, ±3 ºC, white noise signal with a displacement amplitude of 1 mm.
         -   Scenario E.3: ±1 %, ±2 ºC, sine wave signal of 1.5 Hz with a displacement amplitude of 0.5 mm.
         -   Scenario E.4: ±1 %, ±3 ºC, sine wave signal of 1.5 Hz with a displacement amplitude of 1 mm.

                                                                  3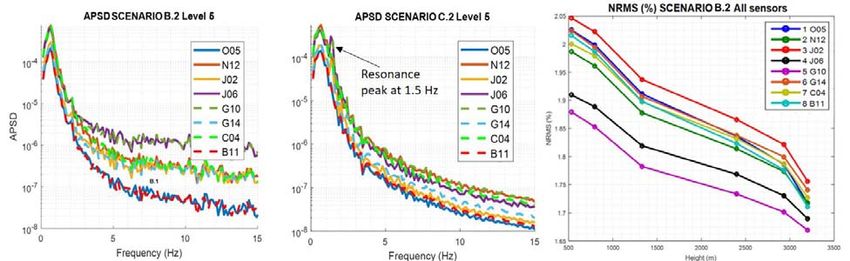
EPJ Web of Conferences 247, 21001 (2021)                                                  https://doi.org/10.1051/epjconf/202124721001
PHYSOR2020

           Figure 1: Radial layout of the sensor strings (i.e. O5, N12, J2, J6, G10, G14, C4, and B11), the four inlet
                                 coolant loops, and vibrating fuel elements (i.e. red boxes).

                                              5. RESULTS AND DISCUSSION

         5.1. Results of Scenario A

         The APSD, NRMS distribution, and the coherence and phase functions obtained for Scenario A are very
         similar to those of the scenario where only temperature fluctuations are assumed [5]. These features are;
         high values in APSDs for the frequency range below 1 Hz, and high coherence between detectors at the
         same axial location and linear phase difference with a low slope between detectors at different axial levels
         at the same instrumentation tube.

         5.2. Results of Scenarios B and C

         The in-core detectors APSDs at the axial level 5 (level 1 for bottom level; level 6 for top level) for the
         scenarios B.2 and C.2 are presented in the left and central plots in Figure 2. In addition, the axial detectors
         NRMS distribution in all radial locations for the scenario B.2 is shown in the right plot in Figure 2. It should
         be noted that, while only B.2 and C.2 APSDs results are presented here, the results obtained using the
         scenarios with vibration displacement amplitude of 0.5 mm (B.1 and C.1) have similar trends. The
         following observations can be made on the APSDs and NRMS:
         - The thermal-hydraulic perturbations cause a strong low-frequency spectrum below 1 Hz, as observed
             in B.2 and C.2 scenarios (i.e. with random and sinusoidal vibrations).
         - The neutron noise variance (The area of the APSD) has a similar trend in all the scenarios B and C, and
             it is directly related to the distance of the in-core detectors from the sources of perturbations (vibrating
             cluster and the inlet coolant loops).
         - In scenarios C (with sinusoidal vibrations), we can see a faster decrease of the APSD as the frequency
             increases. The random vibrations have a higher response amplitude at high frequencies.
         - There is a resonance peak at 1.5 Hz in scenarios C. The largest peak is obtained inside the vibrating
             cluster (see Figure 2, middle plot).
         - The NRMS distribution is very similar in both scenarios B and C, but in real plant data, the axial profile
             of NRMS is concave with a maximum in the bottom half of the core. [5].
         - The NRMS is slightly higher (i.e. 0.1-0.15 % absolute change) in case of 1 mm compared to 0.5 mm
             displacement of fuel assemblies vibration.

                                                                 4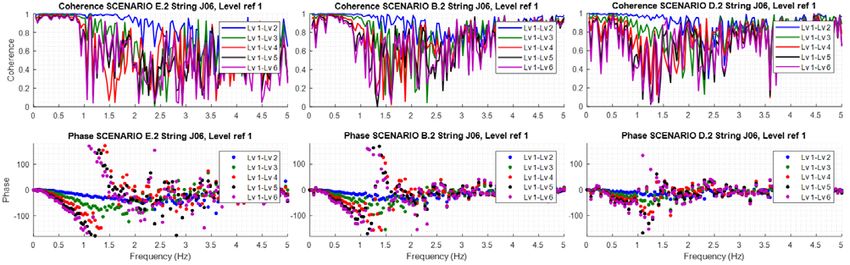
EPJ Web of Conferences 247, 21001 (2021) https://doi.org/10.1051/epjconf/202124721001
PHYSOR2020
Figure 2: Scenario B.2 (left) and Scenario C.2 (center) APSDs of the radial positions at axial level 5. NRMS
of the Scenario B.2 at all radial locations (right).
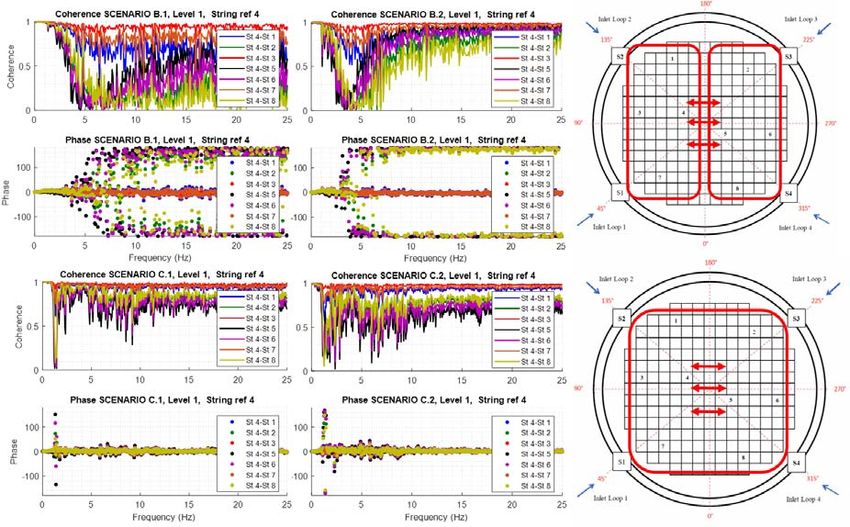
Regarding the coherence and phase functions in Scenarios C (sinusoidal vibrations), the out-of-phase relat
ionship is only observed at 1.5 Hz, see Figure 3. The rest of the frequency range shows an in phase behavi
or. Note that, for individual sinusoidal vibrations, the reactor is divided into two zones, but when the therm
al-hydraulic oscillations are added, this effect is cancelled out. Also, note that there is only an out-of-phase
relationship in Scenarios B above 5 Hz, but with a very low coherence. In addition to that, the larger the a
mplitude of the vibration is, the lower the frequency at which the out-of-phase relationship starts.
Figure 3: From left to right; Coherence and phase radial distribution. The upper figures correspond to
Scenarios B (random vibrations) The lower figures correspond to Scenarios C (sinusoidal vibrations).
In order to explain this behavior, Figure 4 shows the APSD of the in-core detectors at level 1 when
individual perturbations are assumed. We can see that below 4 Hz the thermal-hydraulic effect is much
larger than the FA random vibration effect. Therefore it is dominant and it drives the whole behavior and
this is why the combined effects lead to in-phase behavior. However, above 4-5 Hz the effect of temperature
5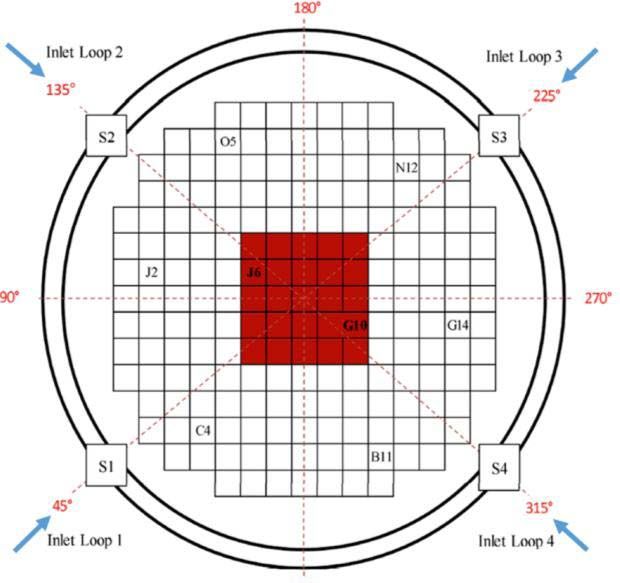
EPJ Web of Conferences 247, 21001 (2021)                                               https://doi.org/10.1051/epjconf/202124721001
PHYSOR2020

         fluctuations is equal or less than the effect of the mechanical vibrations (APSDs), thus we observe that the
         phase is shifted towards out-of-phase. When we apply a sine wave vibration of 1.5Hz, we observe the out-
         of-phase phase because the APSD amplitude due to this mechanical vibration is of the same magnitude, or
         even larger, of the temperature fluctuations.

           Figure 4: APSD of the simulated response of in-core detectors when individual perturbations are applied.

         as a regards to coherence and phase functions between detectors in a same string, Scenarios B and C behave
         similarly between each other and have similar behavior to that of the scenario with only coolant temperature
         perturbations. Nevertheless, the slope of the linear phase observed below 1 Hz is higher than that observed
         in real plant data [5].

         5.3. Results of Scenarios D and E

         Scenarios D.1 and D.2: The APSDs of Scenarios D.1 and D.2 are very similar to scenarios B.1 and B.2,
         where most of the energy of the signal is in the low frequency range (i.e. below 1 Hz).

                                                                                            ∆F ±1 %, ∆T ±3 ºC), B.2 (∆
               Figure 5: From left to right coherence and phase functions of Scenarios E.2 (∆                        ∆F ±1
                   %, ∆T ±1 ºC) and D.2 (∆F ±3 %, ∆T ±1 ºC). in all cases random vibrations with amplitude of 1 mm.

                                                               6
EPJ Web of Conferences 247, 21001 (2021) https://doi.org/10.1051/epjconf/202124721001
PHYSOR2020
Figure 5 from left to right shows how the slope of the linear phase decreases as the relative amplitude of
the flow fluctuation increases between detectors in the same string.
Scenarios E.2 (∆F = ±1 %, ∆T = ±3 ºC) and B.2 (∆F = ±1 %, ∆T = ±1 ºC) present a similar slope, but in
D.2 (∆F = ±3 %, ∆T = ±1 ºC) the slope decreases. This illustrates the higher sensitivity of the phase slope
to the coolant flow fluctuation amplitude compared to that of the coolant temperature fluctuations. By
increasing the flow fluctuation amplitude, the neutron noise axial phase relationship becomes more similar
to the one observed in real data [5]. Note that, the impact of temperature fluctuations results in a high slope,
whereas the effect of flow perturbations results in a low slope on the phase function. Therefore, the
combined effect (temperature and flow fluctuations) results in a situation where the value of the slope of
the phase function is between the two slopes obtained from the two separate cases. In D.1, the flow
fluctuation is lower than in D.2, the effect of the lower slope in the linear phase is not so evident. The radial
distribution of the coherences and phases are very similar to scenarios B.1 and B.2. See Figure 2.
Scenarios D.3 and D.4: Regarding the radial distribution of coherences and phase relationships, these
scenarios present very similar characteristics as C.1 and C.2, see Figure 3. Nevertheless, for the coherence
and phase in the same axial position, we can observe the same behavior presented in Figure 5. The slope of
the linear phase decreases as the amplitude of the flow fluctuations increases.
Scenarios E.1 and E.2: The coherence and phase functions in the same axial position show a similar
behavior as seen in B.1, with a clear linear phase slope as in the cases with only temperature fluctuations.
The radial distribution of coherence and phase functions are very similar to scenario B.1.
Scenarios E.3 and E.4: The coherence and phase functions in the same axial position show a similar
behavior as seen in C.1, with a clear linear phase slope as in the cases with only temperature fluctuations.
The radial distribution of coherence and phase functions are very similar to scenario C.1.
In general, it is observed that all the APSDs of the Scenarios D.1, D.2, E.1, and E.2 are very similar to
scenarios B.1 and B.2, and all the APSDs of the Scenarios D.3, D.4, E.3, and E.4 are very similar to
scenarios C.1 and C.2, in which the corresponding spectral peak at 1.5 Hz is evident.
5.4. NRMS Distribution
Figure 6 shows three different NRMS axial profiles. In the left and middle subfigures, we can observe that,
when the flow fluctuations are increased up to ±2 % or ±3 % (scenarios D), the profile is almost linear and
ascendant. In scenarios B, C and E the NRMS profile are similar to E.2, right subfigure, i.e. almost linear
and descendant. In the real case of the reference [5], the neutron noise distribution is concave and with a
maximum in the bottom half of the core.
Figure 6: From left to right; Axial NRMS distribution of all sensors for the scenarios D.2 (±3 %, ±1 ºC,
random vib. 1mm), D.3 (±2 %, ±1 oC, 1.5 Hz 1mm) and E.2 (±1 %, ±3 oC, random vib. 1mm).
7EPJ Web of Conferences 247, 21001 (2021) https://doi.org/10.1051/epjconf/202124721001
PHYSOR2020
6. CONCLUSIONS
The transient nodal code S3K has been used in this paper for the modelling of various noise sources applied
simultaneously in the core (i.e. fuel assemblies vibration, inlet coolant flow, and temperature fluctuations).
A total number of eleven scenarios are presented in this work. The scenarios differ in the amplitude of the
mechanical vibrations and the relative importance of flow and temperature fluctuations. The simulation
results are the neutron detectors signals which are analyzed in the frequency domain. The spectral
characteristics observed led to the following conclusions:
Mechanical vibrations cause an out-of-phase relationship between opposite detectors in both combined and
individual scenarios. This feature has been observed also in real plant data.
In the combined scenarios with both temperature and flow fluctuations, the spectral features of the
temperature scenarios are dominant, i.e. high NRMS and high slope in the linear phase between in-core
detectors at different axial levels. Nevertheless, there is one type of scenario (3 % flow perturbation, ±1 ºC,
and random mechanical vibrations) in which the liner phase slope observed is no longer as the one found
in the other scenarios. We cannot firmly state that the slope is lower than in other cases because the linear
phase is not well defined, but this case shows that the temperature phenomenon is not so predominant. The
NRMS axial profile of the scenario D3 (±2 %, ±1 ºC, 1.5 Hz 1mm) approaches a convex axial profile that
has a similar shape of the one observed when dealing with real plant data.
7. ACKNOWLEDGMENTS
The research leading to these results has received funding from the Euratom research and training program
2014-2018 under grant agreement No 754316 (Project CORTEX Core Monitoring Techniques
Experimental Validation and Demonstration).
8. REFERENCES
1. Czibók T, Kiss G, Kiss S, Krinizs K, Végh J. “Regular neutron noise diagnostics measurements at the
Hungarian Paks NPP”. Progress in Nuclear Energy, vol 43, pp. 67-74 (2003).
2. Runkel J. Noise Analysis in Pressurized Water Reactor. Ph.D. Thesis (1987).
3. Bermejo J, Montalvo C, Ortego A. “On the possible effects contributing to neutron noise variations in KWU-
PWR reactor: Modelling with S3K”. Progress in Nuclear Energy, vol 95, pp. 1-7 (2017).
4. Viebach M, Bernt N, Lange C, Hennig D, Hurtado A. “On the influence of dynamical fuel assembly
deflections on the neutron noise level”. Progress in Nuclear Energy, vol 104, pp. 32-46, (2018).
5. Torres, L. A., Chionis, D., Montalvo, C., Dokhane, A., & García-Berrocal, A. “Neutron noise analysis of
simulated mechanical and thermal-hydraulic perturbations in a PWR core”. Annals of Nuclear Energy, vol
126, pp. 242-252. (2019).
6. D. Chionis, A. Dokhane, H. Ferroukhi, G. Girardin, A. Pautz, “PWR neutron noise phenomenology: Part I
– Simulation of stochastic phenomena with SIMULATE-3K”, Proceedings of the 2018 International
Conference on the Reactor Physics (PHYSOR ’18), Cancun, Mexico (2018).
7. D. Chionis, A. Dokhane, H. Ferroukhi, G. Girardin, A. Pautz, “PWR neutron noise phenomenology: Part II
– Qualitative comparison against plant data” Proceedings of the 2018 International Conference on the
Reactor Physics (PHYSOR ’18), Cancun, Mexico (2018).
8. T. Kozlowski, T. Downar, “PWR MOX/UO2 Core Transient Benchmark”, NEA/OECD (2007).
9. D. Chionis, A. Dokhane, L. Belblidia, M. Pecchia, G. Girardin, H. Ferroukhi, A. Pautz, “SIMULATE-3K
analyses of neutron noise response to fuel assembly vibrations and thermal-hydraulics parameters
fluctuations”, Proceedings of the 2017 International Conference on Mathematics & Computational Methods
Applied to Nuclear Science & Engineering (M&C ‘17), Jeju Korea, April 16th-20th (2017).
10. Newland, D.E., An Introduction to Random Vibrations, Spectral and Wavelet Analysis. Dover Publications,
Incorporated (2012).
8You can also read