Actuarial Weather Extremes March 2021 - Catastrophe and Climate - April 2021 - SOA.org
←
→
Page content transcription
If your browser does not render page correctly, please read the page content below
Catastrophe and Climate

 Actuarial Weather Extremes
 March 2021

April 2021
2

Actuarial Weather Extremes: March 2021
Record Temperatures, Precipitation, Snow
Extreme Wind, Hail, Tornado and Flooding Events

AUTHOR                  Rob Montgomery, ASA, MAAA, FLMI
                        Patrick Wiese, ASA
                        Society of Actuaries

Caveat and Disclaimer
This study is published by the Society of Actuaries (SOA) and contains information from a variety of sources. It may or may not reflect the experience of any
individual company. The study is for informational purposes only and should not be construed as professional or financial advice. The SOA does not
recommend or endorse any particular use of the information provided in this study. The SOA makes no warranty, express or implied, or representation
whatsoever and assumes no liability in connection with the use or misuse of this study.

Copyright © 2021 by the Society of Actuaries. All rights reserved.

                                                                                                                   Copyright © 2021 Society of Actuaries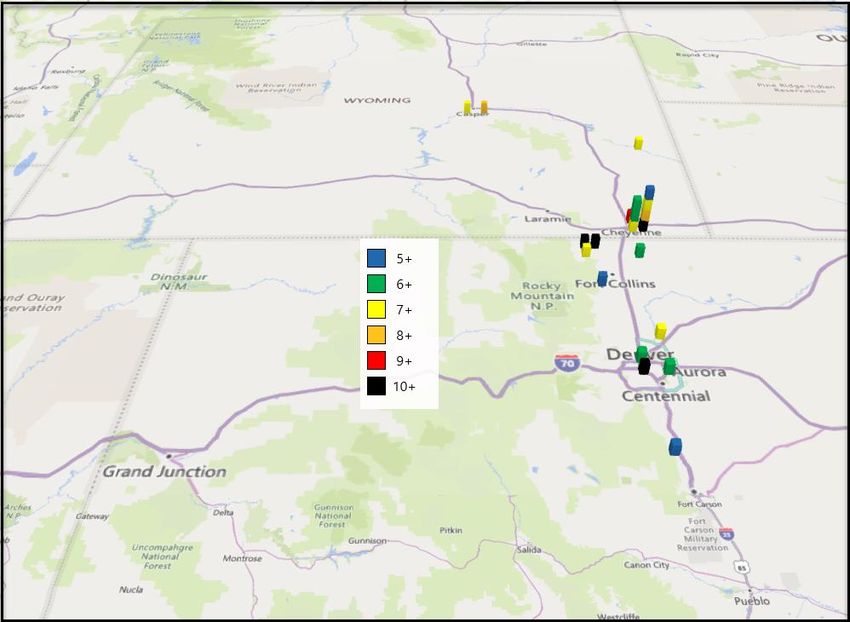
3

CONTENTS
Overview .................................................................................................................................................................. 4
Monthly and Daily Station Records for Temperature, Snow and Precipitation; Along with Associated
Flooding .................................................................................................................................................................... 5
Extreme Windstorm Events in the Northeast and Southeast U.S. ............................................................................ 10
Rough Assessment of the Losses Caused by the Recent Extreme Weather .............................................................. 12
Data ........................................................................................................................................................................ 12
Acknowledgments .................................................................................................................................................. 13
Feedback ................................................................................................................................................................ 13
About The Society of Actuaries ............................................................................................................................... 14

                                                                                                                                            Copyright © 2021 Society of Actuaries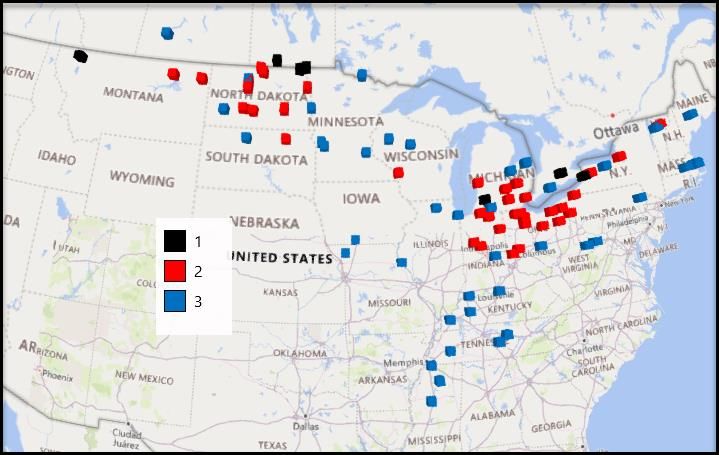
4

Actuarial Weather Extremes: March 2021
Record Temperatures, Precipitation, Snow
Extreme Wind, Hail, Tornado and Flooding Events

Overview
This report examines monthly and daily extremes from the Global Historical Climatology Network (GHCN) monthly
and daily records and associated flooding, as well as extreme wind events in the Northeast U.S. and tornado and
flooding events in the Southeast U.S. These signal the changeover from extreme winter conditions to volatile spring
storm conditions which have been found in the U.S.

Record High Temperature, Precipitation, Flooding and Snow: As illustrated in Figures 1, 2, 3 and 5, both monthly
and daily records occurred at many GHCN stations. In many cases previous records, dating back to 1960, were
exceeded by significant amounts.

Extreme Wind, Hail and Tornado Storm Events: As illustrated in Figures 4 and 6, Tennessee, Alabama and New
Jersey saw extreme flood, tornado and wind events centered around March 17, 25 and 28.

                                                                                         Copyright © 2021 Society of Actuaries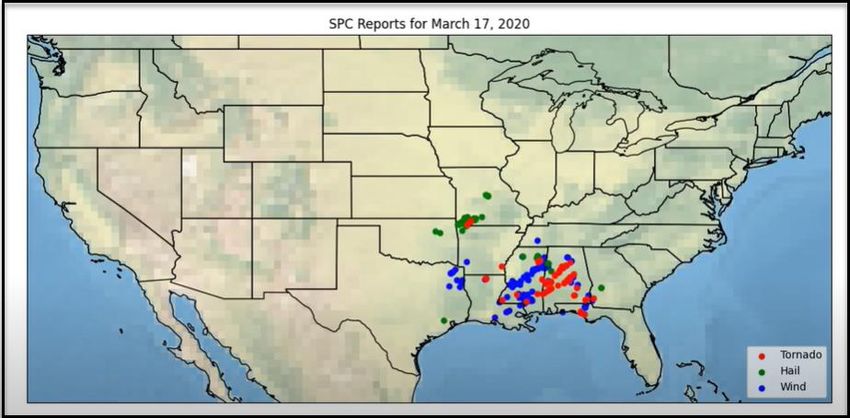
5

Monthly and Daily Station Records for Temperature, Snow and Precipitation;
Along with Associated Flooding
As shown in Figure 1, March 2021 was a record warm month for many stations on the U.S. / Canadian border area, and many
stations just south of there had second or third highest record monthly warm temperature months of March in 2021, when
compared to all March monthly averages from 1960-2021. Figure 2 shows similar monthly metrics for U.S. and Canadian stations
for precipitation. Concentrations of record precipitation were found around Nebraska and Tennessee, which were impacted by
two heavy days of precipitation. Figure 3 illustrates the extreme precipitation on March 14 in Nebraska and March 28 in
Tennessee, illustrating stations with 3-5+ inches of single day precipitation in excess of daily records in March back to 1960.
Figure 4 then associates the concurrent flooding; notably in Tennessee on March 28. Finally, Figure 5 illustrates the extreme
snowfall that occurred in the Rocky Mountain states of Colorado and Wyoming showing stations that recorded 5-10+ inches of
single day snowfall in excess of previous March daily records back to 1960.

Figure 1
GLOBAL HISTORICAL CLIMATOLOGY NETWORK (GHCN) STATIONS IN U.S. AND CANADA WITH 1ST, 2ND OR 3RD
HIGHEST DAILY HIGH TEMPERATURE (TMAX) FOR MARCH 2021 VS MARCH AVERAGES IN 1960-2021.

Source: Global Historical Climatology Network (GHCN) station data (Accessed April 5, 2021).
ftp://ftp.ncdc.noaa.gov/pub/data/ghcn/daily/ghcnd_all.tar.gz

                                                                                                  Copyright © 2021 Society of Actuaries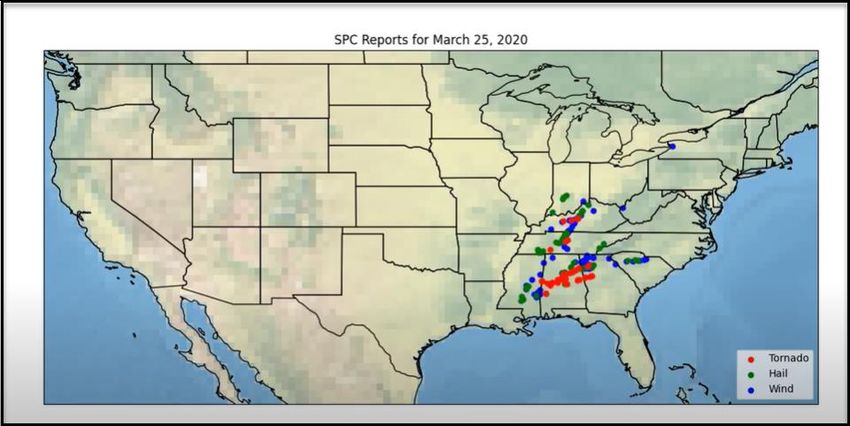
6
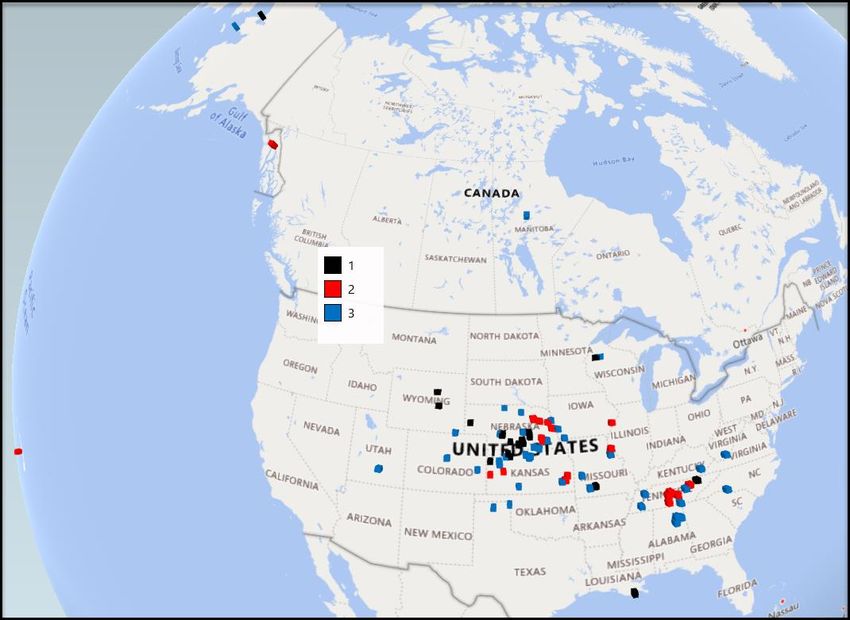
Figure 2 shows GHCN 2021 March monthly station records in black for precipitation in the US and Canada dating back to 1960,
2nd highest in red and 3rd highest in blue.
Figure 2
GHCN STATIONS IN U.S. AND CANADA WITH 1ST, 2ND OR 3RD HIGHEST DAILY PRECIPITATION (PRCP) FOR MARCH
2021 VS MARCH AVERAGES IN 1960-2021.
Source: Global Historical Climatology Network (GHCN) station data (Accessed April 5, 2021).
ftp://ftp.ncdc.noaa.gov/pub/data/ghcn/daily/ghcnd_all.tar.gz
Copyright © 2021 Society of Actuaries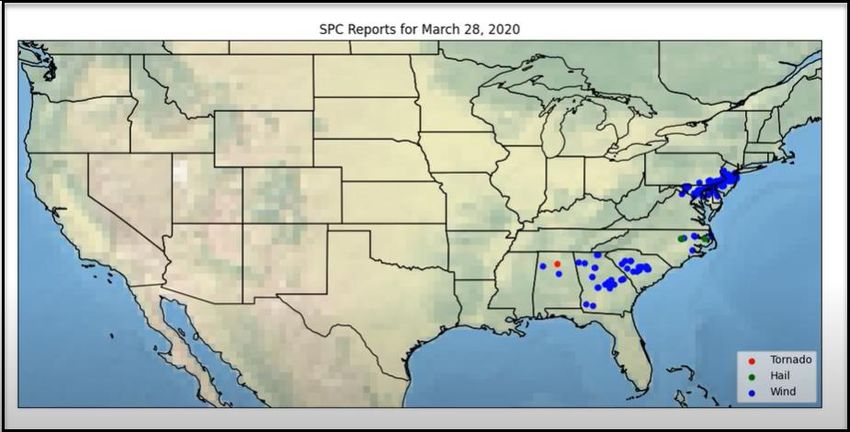
7
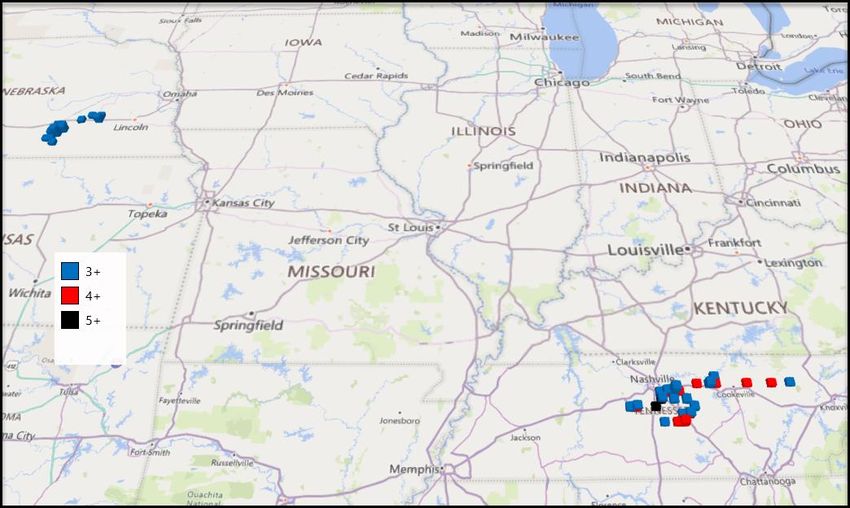
Figure 3 shows daily precipitation records that exceeded the previous daily record by at least 3 and in some cases over 5 inches
of daily rainfall. The most significant record-breaking daily rainfall was in the Nashville, TN areas, where significant flooding
ensued.
Figure 3
MARCH 14, 2021 (NEBRASKA) AND MARCH 28, 2021 (TENNESSEE) DAILY PRCP AMOUNTS 3+, 4+ AND 5+ INCHES
GREATER THAN PREVIOUS MARCH 14 AND MARCH 28 DAILY RECORDS FROM 1960 – 2021.
Source: GHCN station data (Accessed April 5, 2021). ftp://ftp.ncdc.noaa.gov/pub/data/ghcn/daily/ghcnd_all.tar.gz
Copyright © 2021 Society of Actuaries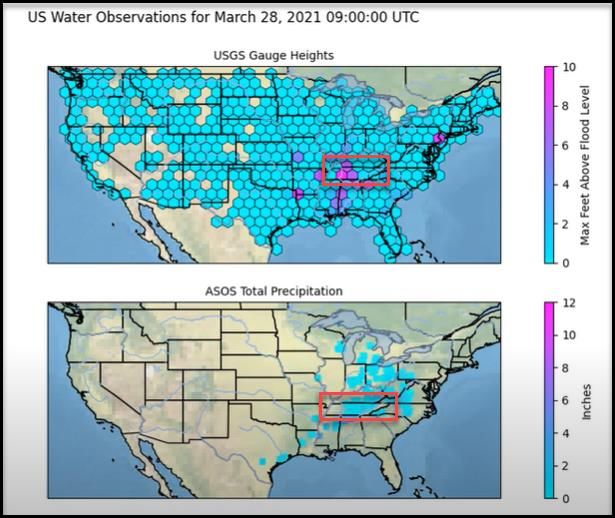
8

As shown in Figure 4, the Nashville, TN area had heavy rains and flooding on March 28. According to CNN1 and NBC News, at
least six deaths occurred, and 130 people had to be rescued from the flood. 2
Figure 4
MARCH 28, 2021 SNAPSHOT OF PRECIPITATION AND FLOODING CONDITIONS HIGHLIGHTING TENNESSEE.

Source: 1) United States Geological Survey (USGS) Gauge Heights Real-Time Values:
https://waterservices.usgs.gov/rest/IV-Test-Tool.html
         2) IA State (ASOS) Precipitation: https://mesonet.agron.iastate.edu/request/download.phtml
         Accessed on April 8, 2021.

    The animation for the maps shown in Figure 4 can be viewed by clicking on this link:

Sea, River, Buoy: https://drive.google.com/file/d/1-HS2DkLtiOTOfoQ2Nze_sF60VMNrmtdl/view?usp=sharing

Time Lapse animations created by Matthew Self, ASA using ASOS data and Python programming. Data accessed April 8, 2021.

1   CNN. March 29, 2021 Nashville flash flood: Six dead and dozens of homes and businesses destroyed - CNN
2   NBC News. March 28, 2021. At least four people dead, 130 rescued after Nashville floods (nbcnews.com)

                                                                                                             Copyright © 2021 Society of Actuaries
9
Figure 5 shows the significant mid-March 2021 snowfall that occurred in the Rocky Mountain areas primarily around Denver, CO
and Cheyenne, WY. Daily high temperatures at these stations exceeded previous daily highs back to 1960 by 5-10+ inches.
Figure 5
MARCH 14 – 16, 2021 RECORD ONE-DAY SNOWFALL AMOUNTS IN COLORADO AND WYOMING FROM 5 – 10+
INCHES IN EXCESS OF PREVIOUS MARCH 14, 15, 16 DAILY RECORD AMOUNTS FROM 1960-2021
Source: GHCN station data (Accessed April 5, 2021). ftp://ftp.ncdc.noaa.gov/pub/data/ghcn/daily/ghcnd_all.tar.gz
Copyright © 2021 Society of Actuaries10
Extreme Windstorm Events in the Northeast and Southeast U.S.
Figure 6 shows three significant dates of windstorm events during March 2021. March 17 and 25 there were many tornadoes in
the Southeast U.S., particularly in Alabama. On March 28, there were significant concentrations of wind events, particularly in
New Jersey and Alabama. According to CoreLogic, the March 25 Alabama storms caused 5 deaths and over 9,000 damaged
properties.3 On March 28, 2021 in New Jersey, 60-70 mile per hour winds knocked out power to tens of thousands and caused
significant damage to a hotel. 4
Figure 6
TORNADO, HAIL, AND WIND EVENTS MARCH 17, 25, AND 28, 2021 IN THE U.S.
3 CoreLogic. March 25, 2021. Nearly 10,000 Homes Likely Impacted by Alabama, Georgia Tornado Outbreak (corelogic.com)
4 NJ.com. March 29, 2021. Storms with 60 to 70 mph wind gusts rip across N.J. leaving trail of debris - nj.com
Copyright © 2021 Society of Actuaries11
Figure 6 (continued)
TORNADO, HAIL, AND WIND EVENTS MARCH 17, 25, AND 28, 2021 IN THE U.S.
Source: National Weather Service Storm Prediction Center. Accessed April 8, 2021.
https://www.spc.noaa.gov/climo/reports/210317_rpts.html, https://www.spc.noaa.gov/climo/reports/210325_rpts.html,
https://www.spc.noaa.gov/climo/reports/210328_rpts.html
Animation Link for Daily Tornado, Hail, Wind Events March 2021, created by Matthew Self, ASA using ASOS data and Python
programming. Data accessed April 8, 2021.
The animation can be viewed by clicking on the following link:
Daily SPC: https://drive.google.com/file/d/1ns_KSYUmkw6WN4CCnRynrdSCUdnT_5w-/view?usp=sharing
Copyright © 2021 Society of Actuaries12
Rough Assessment of the Losses Caused by the Recent Extreme Weather
Economic and insured losses are often difficult to estimate in the immediate aftermath of an extreme weather
event. With the passage of time, the extent of the losses gradually becomes clearer.
March 25, 2021 Storms Alabama
According to CoreLogic, the March 25, 2021 Alabama storms caused 5 deaths and over 9,000 damaged properties. 5
March 28, 2021 Flooding Tennessee
The Nashville, TN area had heavy rains and flooding on March 28. According to CNN6 and NBC News, at least six deaths occurred,
and 130 people had to be rescued from the flood. 7
March 28, 2021 Storms New Jersey
On March 28, 2021 in New Jersey 60-70 mile per hour winds knocked out power to tens of thousands and caused significant
damage to a motel. 8
Data
Snow, Precipitation and temperature data used in this report was obtained from the Global Historical Climatology
Network (“GHCN”) weather database, which provides daily weather observations from over 100,000 weather
stations worldwide, covering over 180 countries. The database is publicly available through the National Oceanic
and Atmospheric Administration (NOAA) via the following FTP site:
ftp://ftp.ncdc.noaa.gov/pub/data/ghcn/daily/ghcnd_all.tar.gz
Filename: ghcnd_all.tar.gz
Automated Surface Observing System (ASOS) temperature and precipitation data
The steps below show how to get the hourly temperature and precipitation at the STL Airport, as an example, from
the Iowa State University Automated Surface Observing System (ASOS):
IA State: https://mesonet.agron.iastate.edu/request/download.phtml
1) Select “Missouri ASOS” as the network and click “Switch to Network”
2) In the list of available stations, select the “[STL] ST. LOUIS” station, and click “Add Selected”
3) In the “Select From Available Data” section, choose the “Air Temperature [F]” and “1 hour Precipitation [inch]”
options.
5 CoreLogic. March 25, 2021. Nearly 10,000 Homes Likely Impacted by Alabama, Georgia Tornado Outbreak (corelogic.com)
6 CNN. March 29, 2021 Nashville flash flood: Six dead and dozens of homes and businesses destroyed - CNN
7 NBC News. March 28, 2021. At least four people dead, 130 rescued after Nashville floods (nbcnews.com)
8 NJ.com. March 29, 2021. Storms with 60 to 70 mph wind gusts rip across N.J. leaving trail of debris - nj.com
Copyright © 2021 Society of Actuaries13
4) Set the date range to 2020-October-1 and 2020-October-31 (or whatever range is desired)
5) Select “Yes” for “Include Latitude + Longitude”
6) Click “Get Data” at the bottom
These steps would give you the results from the URL below.
https://mesonet.agron.iastate.edu/cgi-
bin/request/asos.py?station=STL&data=tmpf&data=p01i&year1=2020&month1=10&day1=1&year2=2020&month2
=10&day2=31&tz=Etc%2FUTC&format=onlycomma&latlon=yes&elev=no&missing=M&trace=T&direct=no&report_t
ype=1&report_type=2
USGS Gauge Heights
Real-Time Values: https://waterservices.usgs.gov/rest/IV-Test-Tool.html
1. Select “List of Sites” in the Major Filters section and enter the Site Number(s) of interest
2. In the Date Ranges section, select “Return all values within an absolute date range” and enter the Date
Range of interest
3. For “Parameter Codes”, enter 00060 for Discharge, cubic feet per second or 00065 for Gage Height, feet.
4. At the bottom click “Generate the URL” then click “Run the Generated URL”
National Weather Service Storm Prediction Center Reports
SPC: https://www.spc.noaa.gov/climo/reports/210317_rpts.html
1. This page will show all Tornado, Wind, and Hail reports for 3/17/2021
2. Select the “210318 Reports” button at the top to move to the next day
Acknowledgments
The authors wish to thank Matthew Self, ASA for his ongoing contributions to the monthly data available for analysis
for this report.
Feedback
Copyright © 2021 Society of Actuaries14
About The Society of Actuaries
With roots dating back to 1889, the Society of Actuaries (SOA) is the world’s largest actuarial professional
organizations with more than 31,000 members. Through research and education, the SOA’s mission is to advance
actuarial knowledge and to enhance the ability of actuaries to provide expert advice and relevant solutions for
financial, business and societal challenges. The SOA’s vision is for actuaries to be the leading professionals in the
measurement and management of risk.
The SOA supports actuaries and advances knowledge through research and education. As part of its work, the SOA
seeks to inform public policy development and public understanding through research. The SOA aspires to be a
trusted source of objective, data-driven research and analysis with an actuarial perspective for its members,
industry, policymakers and the public. This distinct perspective comes from the SOA as an association of actuaries,
who have a rigorous formal education and direct experience as practitioners as they perform applied research. The
SOA also welcomes the opportunity to partner with other organizations in our work where appropriate.
The SOA has a history of working with public policymakers and regulators in developing historical experience studies
and projection techniques as well as individual reports on health care, retirement and other topics. The SOA’s
research is intended to aid the work of policymakers and regulators and follow certain core principles:
Objectivity: The SOA’s research informs and provides analysis that can be relied upon by other individuals or
organizations involved in public policy discussions. The SOA does not take advocacy positions or lobby specific policy
proposals.
Quality: The SOA aspires to the highest ethical and quality standards in all of its research and analysis. Our research
process is overseen by experienced actuaries and nonactuaries from a range of industry sectors and organizations. A
rigorous peer-review process ensures the quality and integrity of our work.
Relevance: The SOA provides timely research on public policy issues. Our research advances actuarial knowledge
while providing critical insights on key policy issues, and thereby provides value to stakeholders and decision
makers.
Quantification: The SOA leverages the diverse skill sets of actuaries to provide research and findings that are driven
by the best available data and methods. Actuaries use detailed modeling to analyze financial risk and provide
distinct insight and quantification. Further, actuarial standards require transparency and the disclosure of the
assumptions and analytic approach underlying the work.
Society of Actuaries
475 N. Martingale Road, Suite 600
Schaumburg, Illinois 60173
www.SOA.org
Copyright © 2021 Society of ActuariesYou can also read