Still legs to Energy FOMO - Oil $70 + XOM best performing Mega-cap YTD - FSInsight
←
→
Page content transcription
If your browser does not render page correctly, please read the page content below
This document is being provided publicly in the following form. Please subscribe to FSInsight.com
for more.

Members Area       First Word     Still legs to Energy FOMO --> Oil >$70 + XOM best performing M

       First Word

Still legs to Energy FOMO --> Oil >$70 + XOM
best performing Mega-cap YTD
June 9

               Tom Lee
               HEAD OF RESEARCH

Click HERE to access the FSInsight COVID-19 Daily Chartbook.

We are shifting to a 4-day a week publication schedule:

   Monday
   Tuesday
   Wednesday
   SKIP THURSDAY
   Friday

STRATEGY: Still legs to Energy FOMO –> Oil >$70 + XOM could “break to upside”
COVID-19 trends in the US continue to improve. Daily cases have fallen so much, the US
is likely on track to see sub-10,000 cases by next week. Prior to vaccinations, we would
normally brace for a surge in cases post holiday, but this is not the case for this past
Memorial Day. Daily cases have been falling steadily (there is some distortion due to
reporting lags a week ago).

– Only 1 state reported >1,000 cases Tuesday, Texas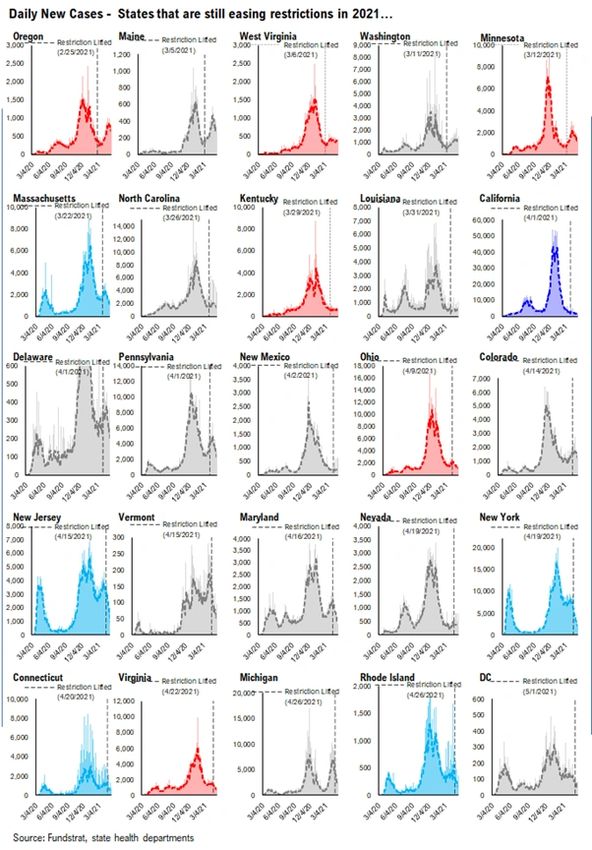
– Many more states also see higher daily cases vs 7D ago, but this is primarily due to
the under-reporting following the Memorial Day holiday
– In fact, 18 states (WV, OK, MD, IA, WY, ME, CT, NM, MS, ND, NE, HI, RI, SD, DC, DE, VT
and NH) reported less than 100 new cases Tuesday
And while US vaccinations rates have slowed, to an extent, the US is still administering
1.1 million doses daily, or a pace of 35 million Americans per month. So, penetration is
gradually increasing in the US. And higher penetration confers greater community
benefits (akin to herd immunity).

– 35 million per month is 11% increase in penetration monthly
– 51% of Americans have received at least 1 dose
– 42% have received both/full doses

So the US is still increasing the penetration of vaccinations.

STRATEGY: Energy outperformance still has legs
The Energy sector remains our favorite sector, and we believe Energy stocks trade at
an unjustified discount to oil, both spot and futures. And oil fundamentals are
unusually favorable Tuesday, given the tightening of supply and demand dynamics (we
discussed multiple times over past 6 months). One of our clients, ES in SF, also flagged
that Exxon ($XOM) looked ready for an upside breakout.

Indeed, ES is correct (thanks Eric) and $XOM does look ready for an upside breakout.
But the significance of this is important to the overall favorable stance on Energy
stocks. So I wanted to spend Tuesday talking about this.

– WTI Oil has cleared the $67.98 resistance decisively and now above $70, with $80 now
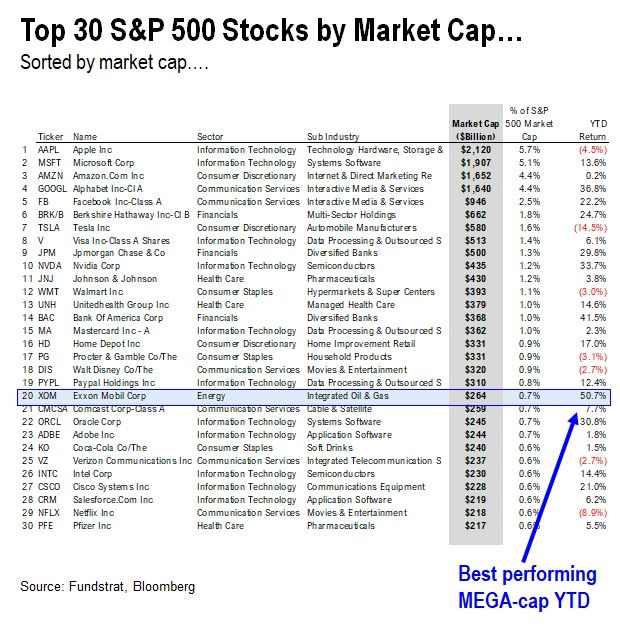
feasible
– Since YE2019, WTI is +9% while Energy stocks $XLE, $OIH are down -7% and -10%,
respectively
– $XOM is the largest Energy stock, 25% of sector market cap, thus it is key
– $XOM is the best performing large-cap stock (among top 30 stocks) in S&P 500 YTD,
+50%

So you see the FOMO? Investors cannot ignore $XOM any longer.

…WTI breaking to the upside
The breakout in crude WTI is evident looking below and we see $80 as feasible

…$XLE and $OIH still need to rise +20% just to catch up to crude
The performance gap between WTI and $XLE and $OIH is closing, but still substantial.
Given WTI levels, $XLE and $OIH have >20% upside still. And as you are aware, we see
even greater upside for $OIH than +20%, maybe +100%.

…$XOM is the key stock, thanks ES of SF
And Exxon is the key stock. It is 25% of the weight in the S&P 500 Energy sector. And at
$264 billion, is not a small stock.
…$XOM is a top 30 stock in the S&P 500, and the best performing mega-cap stock YTD.
$XOM is not a puny market cap. At $264 billion, $XOM is larger than many popular
stocks:

– $XOM market cap greater than Comcast, Oracle, Adobe, Verizon, Coca-Cola
– $XOM is the best performing Mega-cap with +51% gains YTD

So large cap managers are increasingly facing FOMO (fear of missing out) if they don’t
overweight Energy. I have not heard a single fund manager tell me they are interested
in buying $XOM. Yet, as shown below, $XOM is a monster YTD.
…$XOM looks like little resistance until $80
We see $XOM shares as having little resistance until $80, versus $56 currently. So $XOM
has plenty of upside. In fact, given the symmetry below, we think the 2018 highs of $80
are achievable. This would be consistent with $80 WTI oil.

– so $80 WTI = $80 XOM

Looking at the last 40 years, $XOM might even reach $100. The chart below is monthly
and you can see that in 2020, $XOM became the most oversold (monthly RSI) in the
40-years shown.

– if that is not a sign of capitulation, I don’t know another one
– with WTI now nearing 2018 levels, $XOM could exceed its $80 2018 highs
– capex discipline and shareholder return metrics were far stronger Tuesday

Thus, $XOM has substantial upside from here.
BOTTOM LINE: Investors need to HODL Energy as FOMO set to kick inBottom line, we
urge investors to HODL Energy stocks. We see FOMO also kicking in given the
stupendous gains of $XOM YTD. And $XOM looks to be able to surge further to $80,
maybe $100 per share.

TACTICAL:
– IWM set for a tactical 10 day rally, back to $235-$240 possibly
– IWM needs a few more days, like 5-10 days

OVERWEIGHT “Positive Surprise”
– Top 3 sectors still Energy, Materials and Financials –> $XLE $XLB $XLF

UNDERWEIGHT “Falling on a Slope of Hope”
– Cautious on Technology and recommend using strength to reduce –> $XLK $QQQ
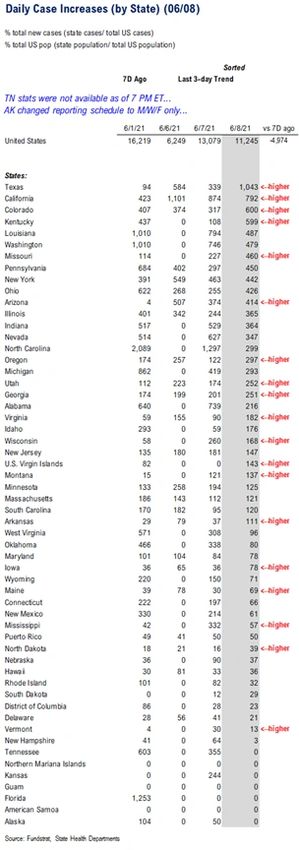
ADDENDUM: We are attaching the stock lists for our 3 portfolios:
We get several requests to give the updated list for our stock portfolios.          We are
including the links here:

– Granny Shots –>       core stocks, based on 6 thematic/tactical portfolios
– Trifecta epicenter –> based on the convergence of Quant (tireless Ken), Rauscher
(Global strategy), Technicals
– Violence in USA –> companies that are involved in some aspect of home or personal
security. We are not “recommending” these stocks, but rather, bringing these stocks to
your attention.

Granny Shots:
Full stock list here –> Click here

Trifecta Epicenter (*):
Full stock list here –> Click here

Power Epicenter Trifecta 35 (*):
Full stock list here –> Click here

Violence in USA:
Full stock list here –> Click here

(*) Please note that the stocks rated OW on this list meet the requirements of our
investment theme as of the publication date. We do not monitor this list day by day. A
stock taken off this list means it no longer meets our investment criteria, but not
necessarily that it is neutral rated or should be sold. Please consult your financial advisor
to discuss your risk tolerance and other factors that characterize your unique investment
profile.

POINT 1: Daily COVID-19 cases 11,245, -4,974 vs 7D ago…7D delta turned negative
following Monday’s spike…
_____________________________

Current Trends — COVID-19 cases:
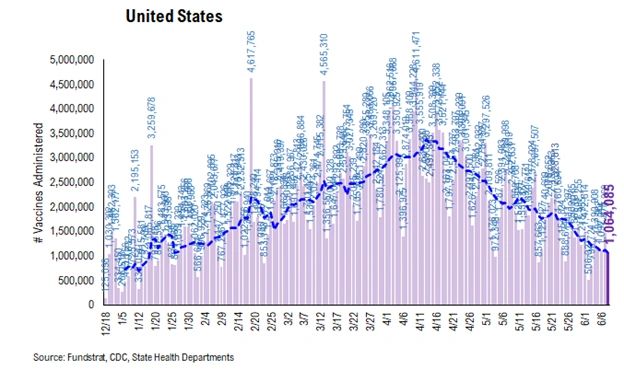
– Daily cases 11,245 vs 16,219 7D ago, down 4,974
– 7D positivity rate 1.9% vs 2.0% 7D ago
– Hospitalized patients 17,431 down -11.3% vs 7D ago
– Daily deaths 427, up 3.2% vs 7D ago
_____________________________

– The latest COVID-19 daily cases came in at 11,245, down 4,974 vs 7D ago. As we
expected, the 7D delta in daily cases has turned negative following Monday’s spike. It
will take a few more days to clear out the data distortion, but we don’t believe the
downtrend in daily cases will be reversed. In fact, as you can see from the chart below,
the daily cases have been steadily falling over the past 4 weeks. And with the
continued efforts for a higher penetration of vaccines, the steady decline in daily
cases is likely to persist.

7D delta in daily cases turned negative after Monday’s spike….
The 7D delta in daily cases has turned negative again following Monday’s spike. As we
noted Monday, the sudden jump Monday did not really warn of a trend reversal in daily
cases, but purely was a result of the under-reporting 7 days ago on Memorial Day. In
the coming days, the 7D delta could fluctuate slightly, but we still expect the steady
decline in daily cases to persist.
Current hospitalization, daily deaths and positivity rate are at all time low…
Below we show the aggregate patients who are currently hospitalized due to COVID.
After a mini-surge in March, the number of patients currently hospitalized rolls over
again. Positivity rate is also following the similar pattern. Currently, all three metrics –
current hospitalization, daily deaths and positivity rate – are at their all time lows since
the start of the pandemic.
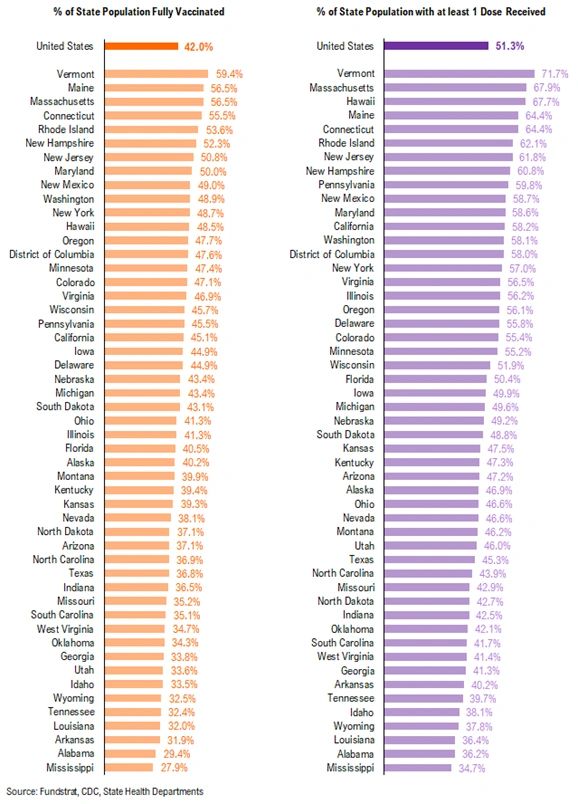
POINT 2: VACCINE: Vaccination progress has stalled – the average daily number of
dose administered fell to 1.1 million…
_____________________________

Current Trends — Vaccinations:
– avg 1.1 million this past week vs 1.2 million last week
– overall, 42.0% fully vaccinated, 51.3% 1-dose+ received
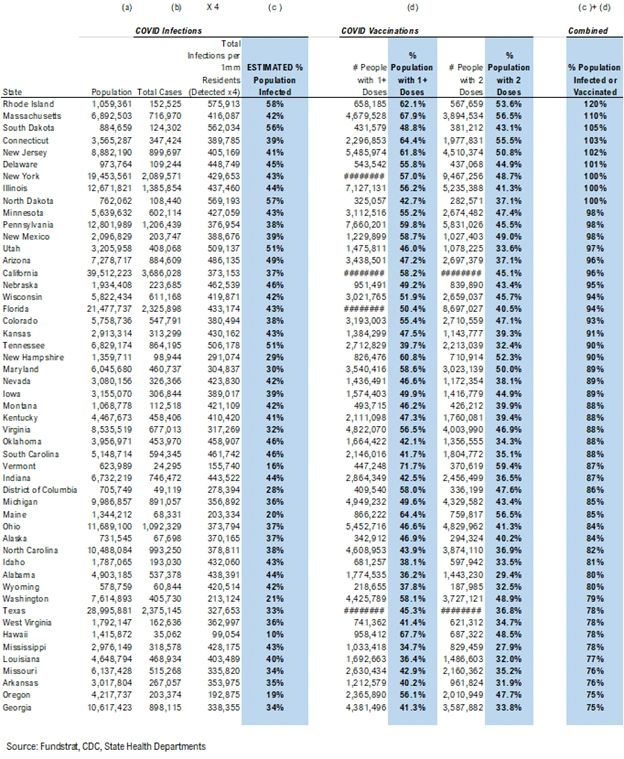
_____________________________

Vaccination frontier update –> all states now near or above 70% combined
penetration (vaccines + infections)
Below we sorted the states by the combined penetration (vaccinations + infections).
As we commented in the past, the key figure is the combined value >60%, which is
presumably near herd immunity. We have overlaid our case progress with that of Israel
several times to demonstrate what should happen to cases once immunity reaches a
certain critical level in the population. That is, the combined value of infections +
vaccinations as % population > 60%. The persistent and rapid decline in cases suggest
that the US is following a similar path to Israel (see our prior notes) while nations with
less penetration continue to struggle more.

– Currently, all states are near or above 70% combined penetration
– RI, SD, MA, ND, CT, NJ, DE, NY, IL, UT, MN, NM, NE, AZ, PA are now above 90% combined
penetration (vaccines + infections)
– So gradually, the US is getting to that threshold of presumable herd immunity. So
long as a vaccine resistant variant doesn’t spread widely, the continued retreat of
cases should continue.
Below is a diffusion chart that shows the % of US states (based on state population)
that have reached the combined penetration >60%/70%/80%/90%. As you can see, all
states have reached 60% and 70% combined vaccination + infection. 78.0% of US states
(based on state population) have seen combined infection & vaccination >80% and
51.9% of US states have seen combined infection & vaccination >90%.
There were a total of 1,064,085 doses administered on Tuesday. As we noted last week,
the vaccination progress has stalled – the average daily number of doses
administered fell to approximately 1.1 million dose. And the vaccination hesitancy
following the pause of JNJ vaccine could be one of the biggest factors. Also, according
to the data from Kaiser Family Foundation (KFF), Hispanic and Black communities have
relatively lower rates of vaccination. Therefore, if the US wants to boost vaccine
penetration further, Hispanic and Black communities should be the focus.
93.4% of the US has seen 1-dose penetration >40%…
To better illustrate the actual footprint of the US vaccination effort, we have a time
series showing the percent of the US with at least 35%/40%/45% of its residents fully
vaccinated, displayed as the orange line on the chart. Currently, 86.6% of US states
have seen 35% of their residents fully vaccinated.     However, when looking at the
percentage of the US with at least 40% of its residents fully vaccinated, this figure is
62.4%. And only 43.3% of US (by state population) have seen 45% of its residents fully
vaccinated.

– While 93.4% of US states have seen vaccine penetration >40%, 78.7% of them have
seen 1 dose penetration >45% and 54.8% of them have seen 1 dose penetration > 50%.
– 86.6% of the US has at least 35% of its residents fully vaccinated, However, only 62.4%
of US has fully vaccinated >40% and 43.3% of US has fully vaccinated >45%.
This is the state by state data below, showing information for individuals with one dose
and two doses.
The ratio of vaccinations/ daily confirmed cases is generally trending higher (red line is
7D moving avg), but this is largely due to the decline in daily cases.

– the 7D moving average is about ~70 for the past few days
– this means 70 vaccines dosed for every 1 confirmed case
In total, over 300 million vaccine doses have been administered across the country.
Specifically, 170 million Americans (51% of US population) have received at least 1 dose
of the vaccine. And 139 million Americans (42% of US population) are fully vaccinated.
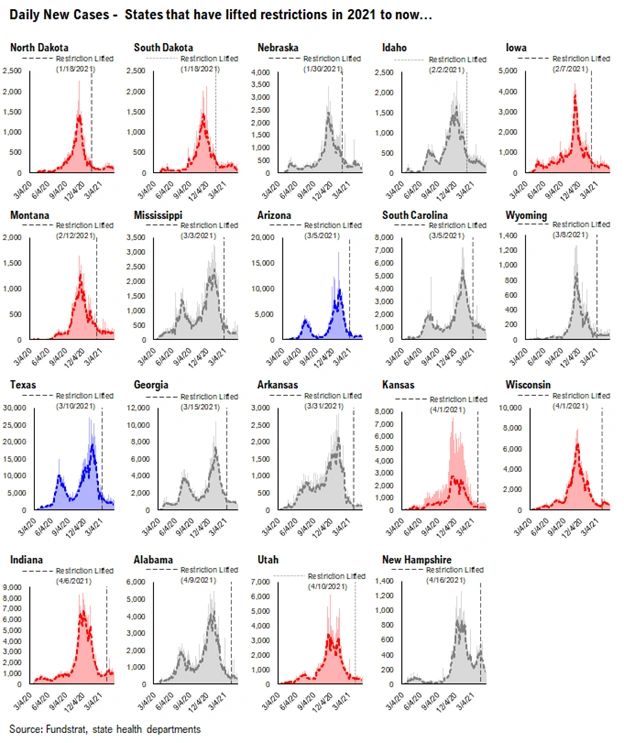
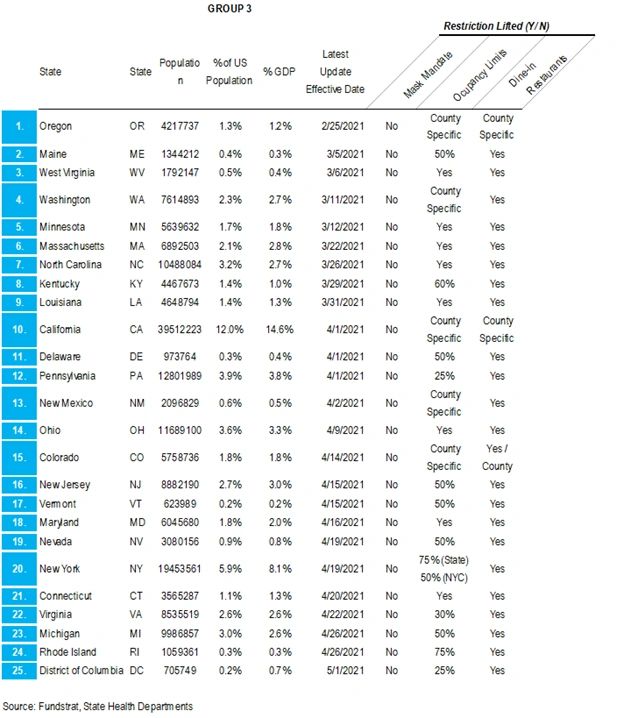
POINT 3: Tracking restrictions lifting and subsequent effects in individual states

Point #3 focuses primarily on tracking the lifting of restrictions, as states have eased
the majority of mandates. Keep in mind, easing/lifting restrictions are contingent upon
state of emergency ordinances being renewed.

– States in groups 1 and 2 represent states that let their emergency ordinances expire,
or that never had one in the first place
– Note: IL and HI are not listed. This is because restrictions lifting is determined at the
county / island level, and no statewide policy will be established to lift restrictions until
a full reopening

So there is a spectrum of approaches. Our team is listing 3 tiers of states and these
are shown below.

– states that eased all restrictions in 2020: AK, OK, MO, FL, TN
– states that have eased all restrictions in 2021 to now: ND, SD, NE, ID, IA, MT, MS, AZ,
SC, WY, TX, GA, AR, KS, WI, IN, AL, UT, NH
– states that are still easing restrictions in 2021: OR, ME, WV, WA, MN, MA, NC, KY, LA,
CA, DE, PA, NM, OH, CO, NJ, VT, MD, NV, NY, CT, VA, MI, RI, DC

GROUP 1: States that lifted restrictions in 2020…
The daily case trends in these states are impressive and it is difficult to say that lifting
restrictions has actually caused a new wave of cases because the case trends in these
states look like other states.
GROUP 2: States that have lifted restrictions in 2021 to now…
Similar to the list of states above, the daily case trends in these states are impressive
and it seems that lifting restrictions hasn’t caused an increase in cases.
GROUP 3: States that are still easing restrictions in 2021…
These states have begun to lift restrictions, but have yet to ease all restrictions. The
date of each state’s most recent restrictions lifting is indicated on each chart. The
case trends in these states have been mostly positive.

– Easing restrictions appears to have contributed to an increase in cases in several of
these states, most drastically in OR, ME, WA, and MN
Tom Lee
             HEAD OF RESEARCH

Disclosures (show)
You can also read