Tokyo Pandemic and the City - DRI TRENDLINES
←
→
Page content transcription
If your browser does not render page correctly, please read the page content below
No. 01                  August 2021

Tokyo
Pandemic and the City
DRI TRENDLINES
No. 01                      Tokyo: Pandemic and the City

                            DRI Trendlines
                            No. 1, August 2021

                            Tokyo
                            Pandemic and the City
                            As COVID-19 continues to sweep through the planet disrupting familiar patterns and gen-
                            erating new ones, cities have borne the brunt of the pandemic the most. From mobility,
                            economic activity, travel, and leisure to prices of common commodities, the novel corona-
                            virus has reshaped everyday life, commerce, and politics of urban centers – traditionally,
                            hubs of activity and catalysts of social and economic innovation. For the inaugural edition
                            of DRI Trendlines, we look at how COVID-19 has changed Tokyo. By bringing in and analyz-
                            ing multiple streams of data, we give you a one-of-a-kind profile of pandemic life in one of
                            the world’s greatest and most iconic cities.

                            Tokyo’s COVID-19 Travails                                                                 3

                            Who Went Where and Why                                                                    4

                            Power and Pandemic                                                                        6

                            Homebound Tokyo                                                                           8

CEO and Publisher
                            Viral Prices                                                                              9
James Pach

Director of Research        Authors, Data, Notes                                                                     10
Abhijnan Rej

Research Analysts
Malvika Rajeev
Rushali Saha

Editorial Advisors
Shannon Tiezzi
Catherine Putz
Sebastian Strangio

Design
Stefan Yanku
Pakpoom Fungtaweesrivilai

Published by
Diplomat Media Inc.
1701 Pennyslvania Avenue
Suite 200
Washington, D.C. 20006
United States of America

© Diplomat Media Inc.

2                           DRI Trendlines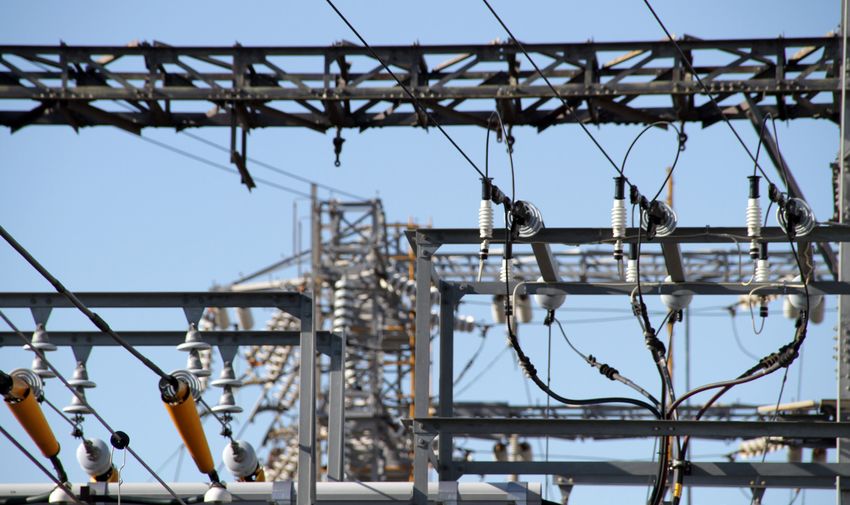
No. 01                              Tokyo: Pandemic and the City

People wearing face masks to
protect against the spread of the
coronavirus walk on a crossing in
Tokyo Monday, August 16, 2021.
Credit: AP Photo, Koji Sasahara

                                    Tokyo’s COVID-19 Travails
                                    Japan’s most densely populated prefecture has
                                    also been hit the hardest by the pandemic.

                                    On January 14 last year, Japan confirmed its first COVID-19 case. Now, the country is among
                                    the top 30 countries with the most novel coronavirus infections; Japan has the highest
                                    number of cases in East Asia. The country’s battles with COVID-19 – and the Japanese gov-
                                    ernment’s decision to go ahead with the Olympics in Tokyo prefecture, in July and August
                                    – has also led many to question the political future of Prime Minister Suga Yoshihide.1 At
                                    the time of this report going to press, Japan is amid a fourth state of emergency designed
                                    to help curb the spread of the novel coronavirus.

                                                                                                     The number of COVID-19 cases
                                                                                                     in Tokyo, with the yellow line
                                                                                                     indicating the positivity rate. 2
                                                                                                     Note: Gray shaded areas represent
                                                                                                     states of emergency imposed by
                                                                                                     the Government of Japan.
                                                                                                     Data: Tokyo Metropolitan
                                                                                                     Government, COVID-19
                                                                                                     Information Website.

                                    Within Japan, Tokyo is the most affected of all prefectures, with more than 310,000 cases. 3
                                    What is more, the rise of the Delta variant of the novel coronavirus since earlier this year
                                    has meant that the city of around 2,200 square kilometer, and with a population of around
                                    13.5 million people, now finds itself scrambling to add hospital beds for COVID-19 patients.4

3                                   DRI Trendlines
No. 01                          Tokyo: Pandemic and the City

Credit: Flickr, feministjulie

                                Who Went Where and Why
                                Mobility in Tokyo during the pandemic – and gauging
                                the success of social distancing measures.

                                Google provides a regularly updated dataset using anonymized and aggregated data that
                                shows how peoples’ movements have changed throughout the pandemic. 5 This data helps
                                us get some insights on the impact of COVID-19 pandemic on how residents of Tokyo work,
                                and the places they visit. It tells us how visitors to (or time spent in) categorized places –
                                for example, grocery stores – have changed compared to baseline days.6 These mobility
                                index changes can be helpful to understand social distancing efforts within Tokyo. Apple,
                                another popular data aggregator in Tokyo, collected similar mobility data which showed
                                equivalent trends.7

                                Workplace

                                Keeping in line with the government response of promoting work-from-home practices,
                                visits to workplaces have drastically decreased and are, as of August 2021, at 40 percent
                                less than their pre-pandemic level.

                                                                                                  Change in traffic at workplaces
                                                                                                  compared to pre-pandemic levels.
                                                                                                  Note: Gray shaded areas represent
                                                                                                  states of emergency imposed by
                                                                                                  the Government of Japan.
                                                                                                  Data: Google COVID-19 Community
                                                                                                  Mobility Report. Graphics: DRI

4                               DRI Trendlines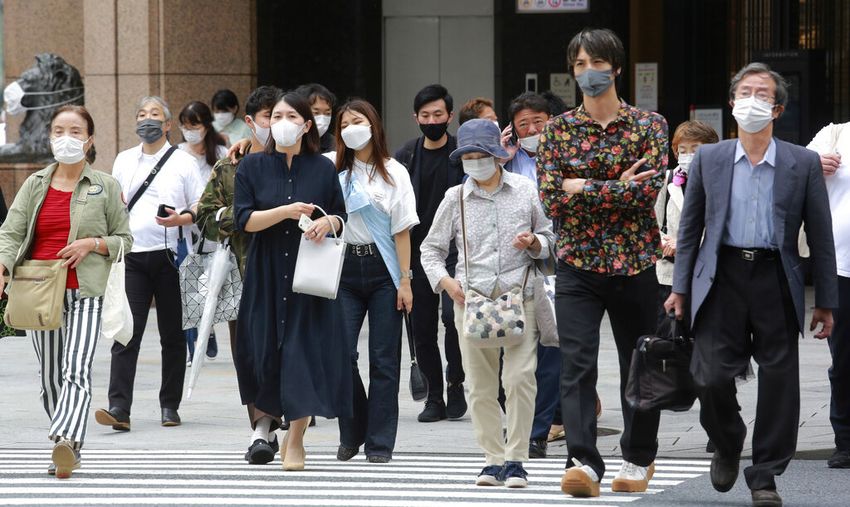
No. 01   Tokyo: Pandemic and the City

         Retail and recreation

         The number of visitors to restaurants, cafés, shopping centers, and other retail shopping
         and recreational outlets are still much below pre-pandemic figures. The beginning of 2021
         saw a slight increase in traffic at these places, but soon converged down to around 40 per-
         cent less than pre-pandemic levels.

                                                                              Change in traffic at retail and
                                                                              recreational places compared
                                                                              to pre-pandemic levels. 8 Gray
                                                                              shaded areas represent states
                                                                              of emergency imposed by the
                                                                              Government of Japan.
                                                                              Data: Google COVID-19 Community
                                                                              Mobility Report. Graphics: DRI

         Grocery and pharmacy stores

         Visits to grocery and pharmacy stores have not fallen beyond 10 percent of pre-pandemic
         levels, apart from a drastic downward spike in January 2021. Overall, the number of visitors
         to grocery and pharmacy stores has been converging back to pre-pandemic levels.

                                                                              Change in traffic at grocery and
                                                                              pharmacy stores compared to
                                                                              pre-pandemic levels.9 Note: Gray
                                                                              shaded areas represent states
                                                                              of emergency imposed by the
                                                                              Government of Japan.
                                                                              Data: Google COVID-19 Community
                                                                              Mobility Report. Graphics: DRI

         Public transit stations

         Reduced traffic at public transit stations is a strong indicator of the success of COVID-19 social
         distancing measures in Tokyo. As expected, states of emergency have seen decline in traffic at
         these hubs. Overall, the traffic at transit hubs has remained much below pre-pandemic levels.

                                                                              Change in traffic at public
                                                                              transport stations compared to
                                                                              pre-pandemic levels.10 Note: Gray
                                                                              shaded areas represent states
                                                                              of emergency imposed by the
                                                                              Government of Japan.
                                                                              Data: Google COVID-19 Community
                                                                              Mobility Report. Graphics: DRI

5        DRI Trendlines
No. 01 Tokyo: Pandemic and the City
Credit: Flickr, OiMax
Power and Pandemic
Electricity demand in Tokyo during the pandemic shows
how COVID-19 has shaped economic activities.
The COVID-19 pandemic – and associated protocols to curb it, such as lockdowns – has had
a significant negative influence on energy demand across the world. Analyzing changes in
electricity demand provide an important indicator of how economic activities are affected
by the pandemic and the subsequent government measures to control it. Hourly electricity
demand data from Tokyo Electric Power Company (TEPCO) provides us a window into how
Tokyo’s economic life has been hit by the novel coronavirus.11
Average electricity demand for
each week in 2020 as a percentage
increase/decrease from average
electricity demand for the
corresponding week in 2019. Note:
Gray shaded areas represent states
of emergency imposed by the
Government of Japan.
Data: TEPCO. Graphics: DRI
6 DRI TrendlinesNo. 01 Tokyo: Pandemic and the City
Most of the weekly demand for electricity in 2020 was lower than the corresponding week-
ly demand in 2019.
Average electricity demand for
each week in 2021 as a percentage
increase/decrease from average
electricity demand for the
corresponding week in 2019. Note:
Gray shaded areas represent states
of emergency imposed by the
Government of Japan.
Data: TEPCO. Graphics: DRI
The majority of the weeks in 2021 (till August) have shown a significant decrease in electric-
ity demand, except for a few notable upward spikes in July.
Trend component of daily
electricity demand, 2019-2021.
Note: Gray shaded areas represent
states of emergency imposed by
the Government of Japan.
Data: TEPCO. Graphics: DRI
We can visualize the trend component of daily electricity demand after removing season-
ality and random noise.12 Overall, the trend is that daily demand for electricity had been
decreasing from 2019 (even before the pandemic hit) to the middle of 2020 and has since
picked up – but is nowhere close to its 2019 levels.
7 DRI TrendlinesNo. 01 Tokyo: Pandemic and the City
Credit: Flickr, Masaru Kamikura
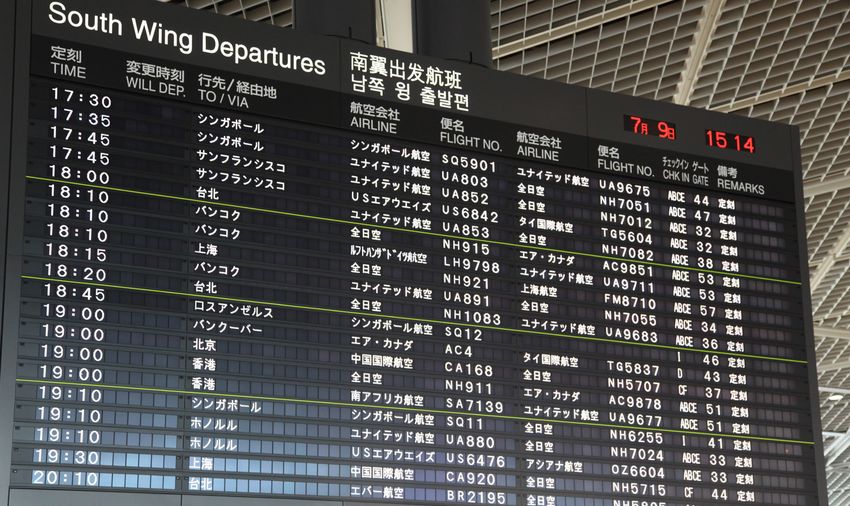
Homebound Tokyo
Air traffic patterns starkly demonstrate how hard
the COVID-19 pandemic has hit the city.
Due to several air travel restrictions and a drop in demand among travelers, aviation in-
dustries across the globe have faced major setbacks in the form of falling revenues and
employee layoffs. Unsurprisingly, the two airports in Tokyo have seen a major fall in num-
ber of takeoffs, landings, and the number of passengers flying in and out.13
Change from the corresponding
monthly figures in 2019. Note: Gray
shaded areas represent states
of emergency imposed by the
Government of Japan.
Data: Narita International Airport
Corporation and Japan Civil
Aviation Bureau. Graphics: DRI
While the number of take offs and landings at both airports is slightly but steadily increas-
ing, the number of passengers flying in or out of Narita airport in 2021 continue to be
approximately 90 percent less than the passengers flying in 2019.
8 DRI TrendlinesNo. 01 Tokyo: Pandemic and the City
Credit: Flickr, clio1789
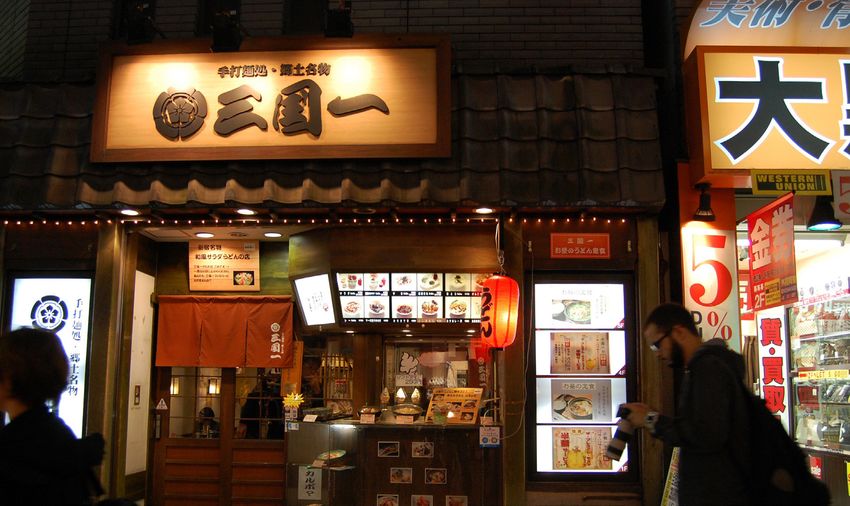
Viral Prices
How has the COVID-19 pandemic affected
prices of everyday items in Tokyo?
Demand shocks, supply chain logistics complications and other variables have contributed
to pressure on price levels of common commodities around the world. Here is how prices
of tuna, salmon, rice, udon, and beef have changed in Tokyo compared to their pre-pan-
demic levels.14
Percentage change in monthly
prices in 2020-21 compared to the
corresponding monthly prices in
2019. Note: The gray shaded area
represents state of emergency
imposed by the Government of
Japan.
Data: e-Stat, Portal Site of Official
Statistics of Japan. Graphics: DRI
Cracking open a cold one at the end of a long day is around five percent cheaper in 2021
than in 2019.
9 DRI TrendlinesNo. 01 Tokyo: Pandemic and the City
Authors
DRI Research Analyst Malvika Rajeev and Director of Research Abhijnan Rej prepared this report.
Data
• Population Census 2010, Statistics Bureau of Japan, Ministry of Internal Affairs and Communications, Japan
• COVID-19 Information Website, Tokyo Metropolitan Government
• Google COVID-19 Community Mobility Reports, Google LLC
• Past Electricity Demand Data, Tokyo Electric Power Company Holdings
• Monthly Traffic Statistics, Narita International Airport Corporation
• Tokyo International (Haneda) Airport, Japan Civil Aviation Bureau, Ministry of Land, Infrastructure and Transport
• e-Stat, Portal Site of Official Statistics of Japan
• Retail Price Survey (Trend Survey), Ministry for Internal Affairs and Communications, Japan
Notes
1 Kaname Umeno, “Japan’s ‘post-Olympics’ curse looms large for embattled Suga,” Nikkei Asia, July 31, 2021, https://
asia.nikkei.com/Politics/Inside-Japanese-politics/Japan-s-post-Olympics-curse-looms-large-for-embattled-Suga.
2 Smoothed using a seven-day rolling average. Positivity rate is defined as the number of people who were reported
positive out of the total number of people tested.
3 Tokyo Metropolitan Government, COVID-19 Information Website, accessed August 24, 2021, https://stopcovid19.
metro.tokyo.lg.jp/en/.
4 “Japan gov’t asks Tokyo hospitals to accept more COVID patients,” Kyodo News, August 23, 2021, https://english.
kyodonews.net/news/2021/08/a2f2b9b96b71-tokyo-opens-oxygen-station-for-covid-19-patients-with-mild-
symptoms.html.
5 Data used for the mobility graphs were obtained from: “Google COVID-19 Community Mobility Reports”, Google LLC,
accessed August 24, 2021, https://www.google.com/covid19/mobility/. To deal with volatility in daily changes, we
smooth each index to a seven-day rolling average.
6 Baseline value is the median value, for the corresponding day of the week, during the five-week period January 3–
February 6, 2020.
7 “Apple Mobility Reports,” Apple, accessed August 24, 2021, www.apple.com/covid19/mobility.
8 “Retail and recreational places,” as defined in the Google COVID-19 Community Mobility Reports, include “restaurants,
cafes, shopping centers, theme parks, museums, libraries, and movie theatres.”
9 “Grocery and pharmacies,” as defined in the Google COVID-19 Community Mobility Reports, include “grocery markets,
food warehouses, farmers markets, specialty food shops, drug stores, and pharmacies.”
10 “Public transport hubs,” as defined in the Google COVID-19 Community Mobility Reports, include “subway, bus, taxi
stands, seaports, car rental agency and train stations.”
11 “Past electricity demand data,” TEPCO, accessed August 24, 2021, https://www.tepco.co.jp/en/forecast/html/
download-e.html.
12 Using LOESS method of decomposition, we decomposed the daily time series data into its seasonal, trend, and
random components.
13 Data used below from: “Monthly Traffic Statistics,” Narita International Airport Corporation, accessed on: August
24, 2021, https://www.naa.jp/en/airport/traffic.html and “Tokyo International (Haneda) Airport,” Japan Civil Aviation
Bureau, Ministry of Land, Infrastructure and Transport, accessed August 24, 2021, https://www.mlit.go.jp/koku/15_
hf_000051.html.
14 Data for the graphs below from: “Retail Price Survey (Trend Survey),” Ministry for Internal Affairs and
Communications, Portal Site of Official Statistics of Japan, accessed August 24, 2021, https://www.e-stat.go.jp/.
10 DRI TrendlinesYou can also read