COVID Model Projections - BC COVID-19 Modelling Group August 18, 2021
←
→
Page content transcription
If your browser does not render page correctly, please read the page content below

August 18, 2021
                                  BC COVID-19 Modelling Group

COVID Model Projections
             August 18, 2021

    BC COVID-19 Modelling Group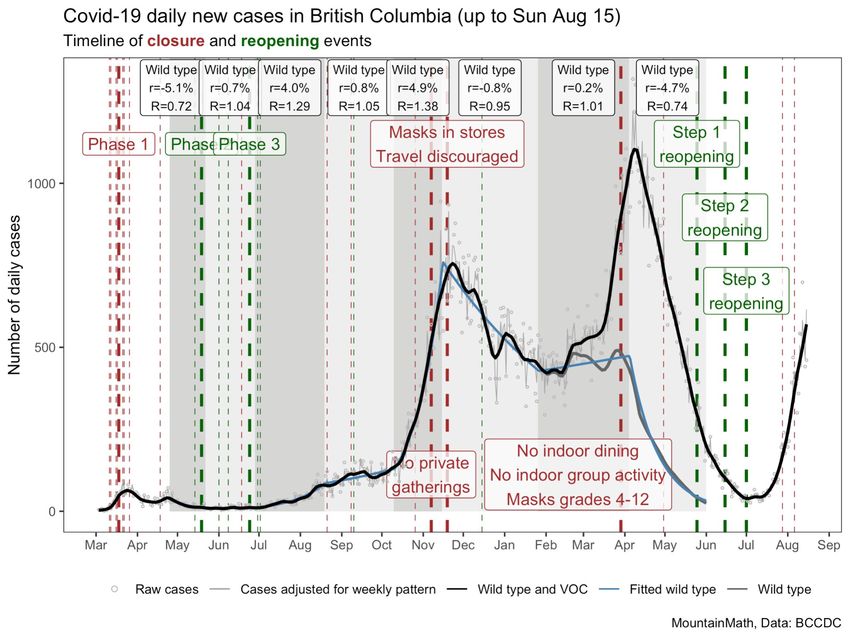
August 18, 2021
                                                                   BC COVID-19 Modelling Group

About BC COVID-19 Modelling Group
                                                    Contributors to report
                                                    Eric Cytrynbaum (UBC, co-editor)
                                                    Sarah Otto (UBC, co-editor)
                                                    Dean Karlen (UVic and TRIUMF)
                                                    Caroline Colijn (SFU)
                                                    Jens von Bergmann (MountainMath)
                                                    Rob James (evidently.ca)
                                                    James Colliander (UBC and PIMS)
                                                    Daniel McDonald (UBC)
                                                    Paul Tupper (SFU)
                                                    Daniel Coombs (UBC)
                                                    Elisha Are (SFU)
                       https://bccovid-19group.ca   Bryn Wiley (UBC)

        Independent and freely offered advice,
       using a diversity of modelling approaches.                                          2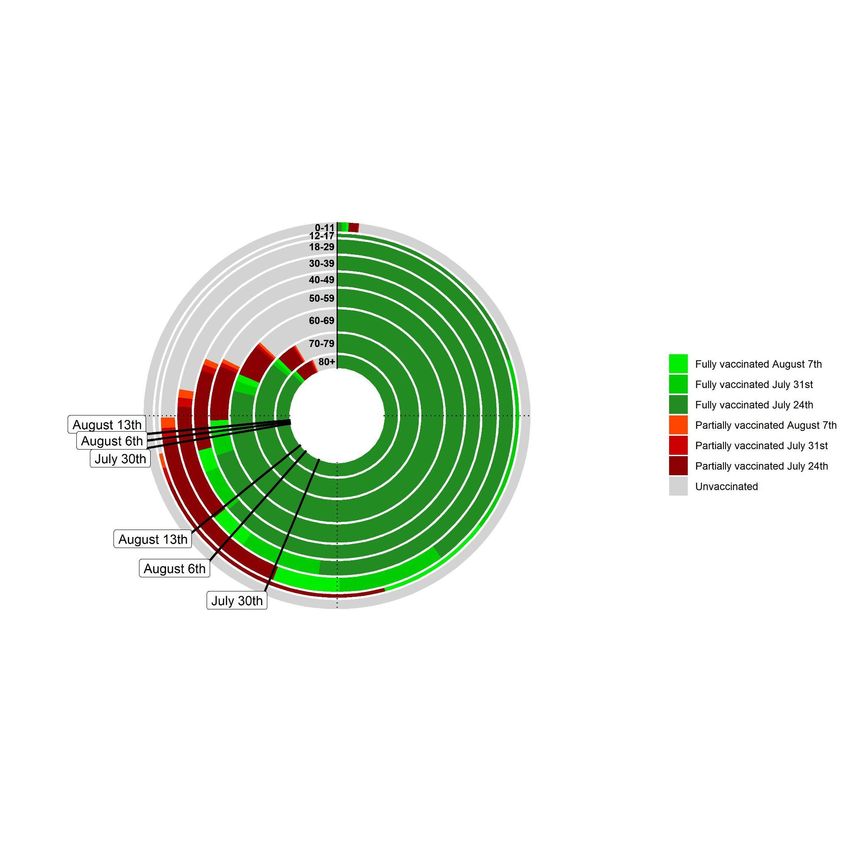
August 18, 2021
                                                                              BC COVID-19 Modelling Group

BC: The rising Delta wave
Key messages
 ●   For nearly five weeks, infections throughout BC have been growing exponentially, doubling
     about every 9 days (growing 8% each day).
 ●   The growth is observed in all Health Authorities and Health Service Delivery Areas.
       ○ Community Health Service Areas with 70% vaccination have five-fold higher case
            counts than those with 90% vaccination among those eligible.
 ●   Hospitalization and ICU occupancy will soon rapidly increase.
       ○ Hospitalization and ICU demand are not “decoupled” from case numbers.
       ○ Fraction of cases leading to hospitalization has not declined in BC in 2021.
 ●   Children will be disproportionately affected during this wave.
       ○ Children under 10 are 9% of the population, but 36% of the unvaccinated population.
 ●   It is urgent that action be taken to reduce transmission and expand vaccination coverage,
     in order to avoid overwhelming BC’s medical system.

                                                                                                      3
August 18, 2021

State of the COVID-19 Pandemic in BC                                                                                                             BC COVID-19 Modelling Group

                                                                                                                               Cases are showing strong and
                                                                                                                                      sustained growth
                                                                                                                                after Step 2 & 3 reopening.

                                                                                                                       COVID-19 is now spreading
                                                                                                                     rapidly in BC, echoing growth of
                                                                                                                          Delta in other regions.

Source (J. von Bergmann) Case data from BC COVID-19 Database (http://www.bccdc.ca/health-info/diseases-conditions/covid-19/data). Vertical lines give dates of
public health measures (major as thick lines, minor as thin lines). Grey dots are raw case counts, grey lines is cases abused for weekly pattern, black STL trend line and   4
blue fitted periods of constant exponential growth.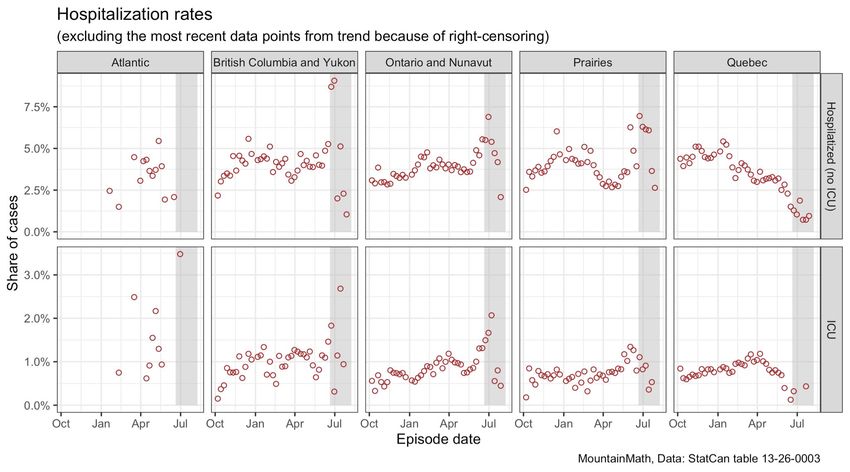
August 18, 2021

State of the COVID-19 Pandemic in BC                                                                                                     BC COVID-19 Modelling Group

                                                                                                      All Health Service Delivery Areas
                                                                                                     have exhibited similar case growth
                                                                                                       rates. Some regions, including
                                                                                                     Okanagan Health, are now showing
                                                                                                              signs of flattening.

Source (J. von Bergmann) Case data from BC COVID-19 Database (http://www.bccdc.ca/health-info/diseases-conditions/covid-19/data). Vertical lines give dates of
public health measures (major as thick lines, minor as thin lines). STL trend lines on log scale.                                                                5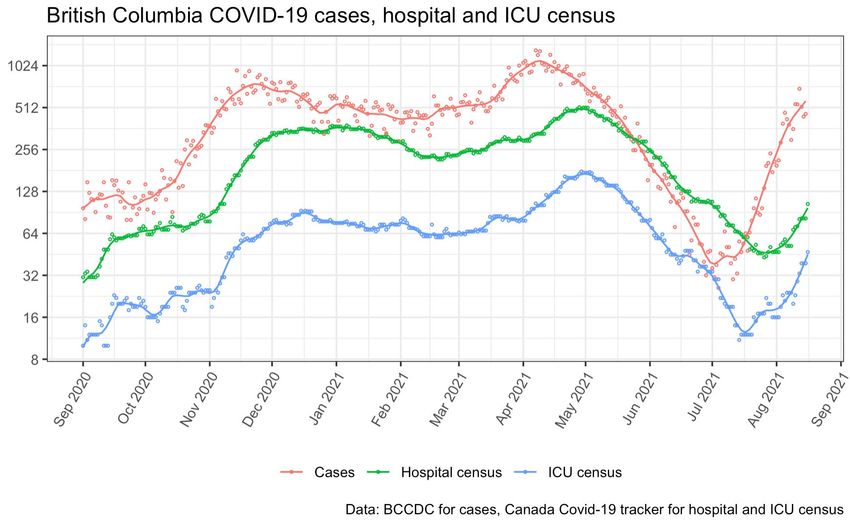
August 18, 2021
                                                                       BC COVID-19 Modelling Group

Modelling growth of delta variant infections in BC
The growth of delta infections in each Health Authority has followed the trend lines
first estimated in late July.

The rapid rate of growth (roughly 8% per day) has been steady each week since,
following the pattern that occurs when there is community transmission.

Cases will soon exceed record levels.

                                                                                               6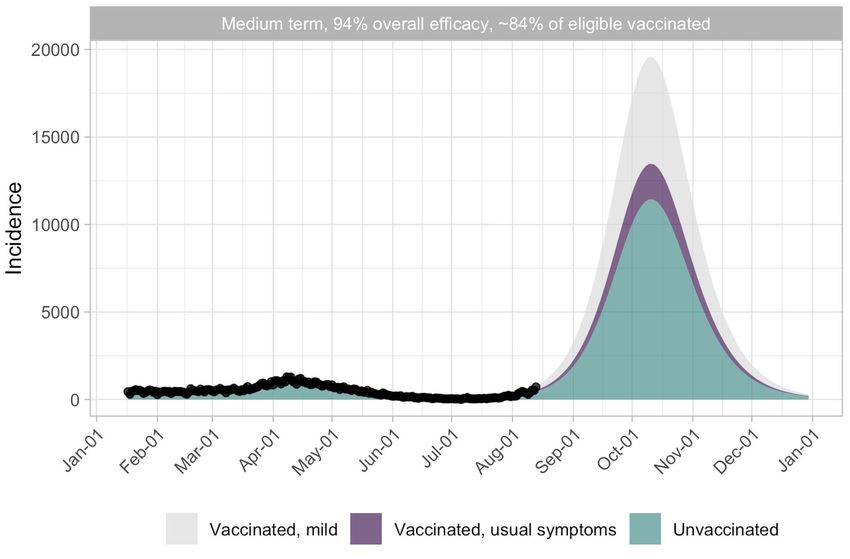
August 18, 2021
                                                                                                                                         BC COVID-19 Modelling Group

      Recent fits to case and hospital data
                                                                                                                                                    Zoom of
                                                                                                                                                    data on
                                                                                                                                                    log scale

                                                                                                                   Growing and              The infection
                                                                                                                   declining COVID          model (curves)
                                                                                                                   infection rates are      reproduces
                                                                                                                   monitored by             hospital and ICU
                                                                                                                   positive tests           occupancy data
                                                                                                                   (cases), yielding        (points).
                                                                                                                   an infection model
                                                                                                                   (green curve).           How good is the
                                                                                                                                            model at
                                                                                                                                            projecting? ...
                                                                                                                                                                 7
Source (D. Karlen). See www.pypm.ca. These models have no age structure. Fits include past vaccination schedule.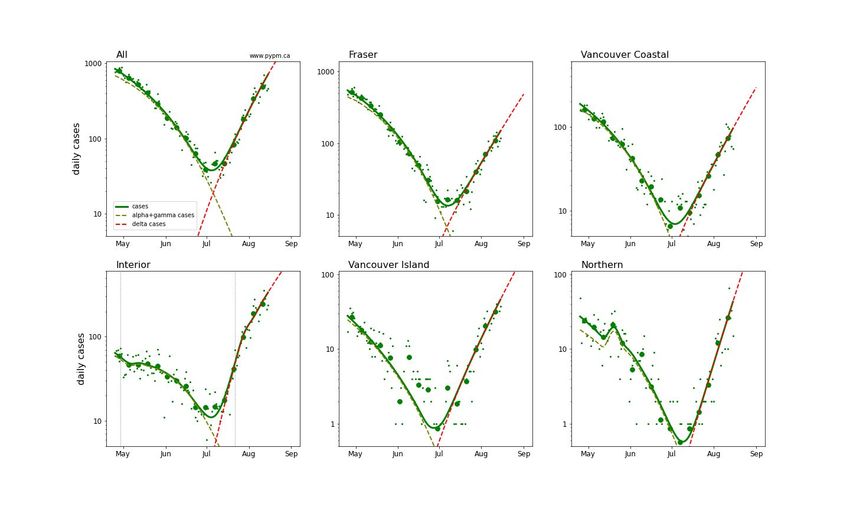
August 18, 2021
                                                                                                                              BC COVID-19 Modelling Group
  Model fits to BC data (July 28 report)

                                                                       These figures show the case history available on July 28,
                                                                       compared to fitted models:
                                                                         ●   Small dots: daily cases
                                                                         ●   Large dots: weekly average daily cases
                                                                         ●   Green curve: fitted model cases (total)
                                                                         ●   Dashed red curve: model for delta variant

                                                                       Exponential growth follows a straight line on these plots.
                                                                       Each page following includes one more data week.

                                                                                                                                                      8
Source (D. Karlen). See www.pypm.ca. These models have no age structure. Fits include past vaccination schedule.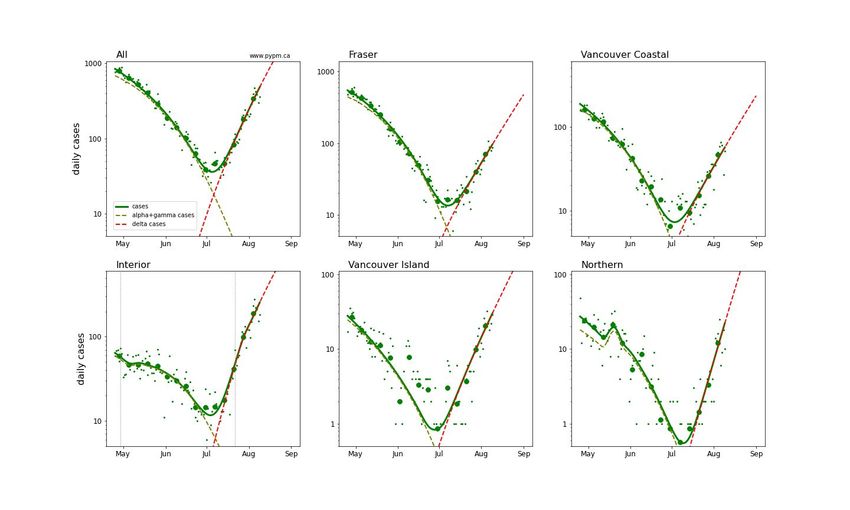
August 18, 2021
                                                                                                                   BC COVID-19 Modelling Group
  Model fits to BC data (August 3 update)

                                                                                                                                           9
Source (D. Karlen). See www.pypm.ca. These models have no age structure. Fits include past vaccination schedule.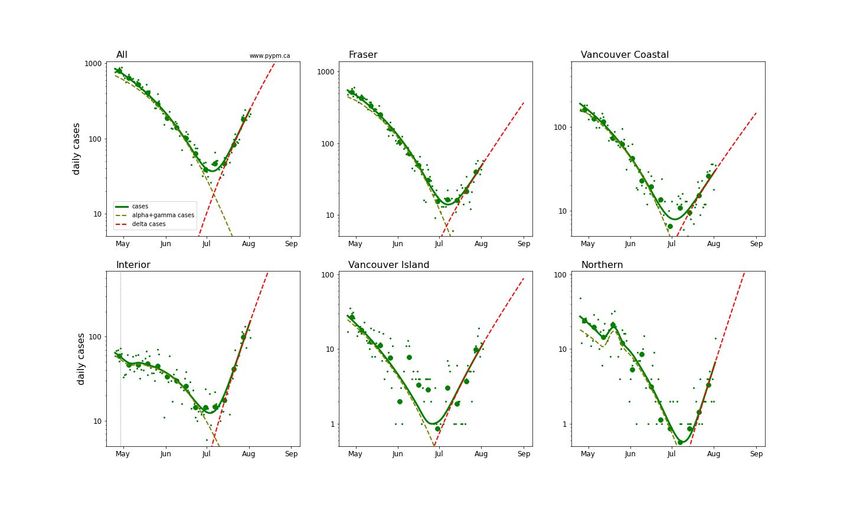
August 18, 2021
                                                                                                                   BC COVID-19 Modelling Group
  Model fits to BC data (August 10 update)

   Interior HA:
   measures
   brought in
   late July:
   small
   reduction in
   growth

                                                                                                                                         10
Source (D. Karlen). See www.pypm.ca. These models have no age structure. Fits include past vaccination schedule.
August 18, 2021
BC COVID-19 Modelling Group
Model fits to BC data (August 16)
Interior HA:
measures
brought in
late July:
small
reduction in
growth
11
Source (D. Karlen). See www.pypm.ca. These models have no age structure. Fits include past vaccination schedule.August 18, 2021
BC COVID-19 Modelling Group
Impact of continued growth on health care
Growing and
declining COVID
infection rates are
monitored by
positive tests
(cases), yielding an
infection model
(green curve).
The infection model
(curves)
reproduces hospital
and ICU occupancy
data (points).
We can therefore
estimate future
occupancy.
12
Source (D. Karlen). See www.pypm.ca. These models have no age structure. Fits include past vaccination schedule.August 18, 2021
BC COVID-19 Modelling Group
Is hospitalization ‘decoupling’ from cases?
We examine data to check whether our high rates of vaccination are causing the
fraction of cases leading to hospitalization to decline significantly (“decouple”),
which would help avert a health care crisis, despite the rapid growth in cases.
The next slides show that BC data are not consistent with this hypothesis.
13August 18, 2021
BC COVID-19 Modelling Group
Hospitalizations and ICU admissions as share of reported cases
The fraction of cases requiring
hospitalization has remained relatively
consistent throughout 2021. Other
Canadian jurisdictions are similar (see
Appendix).
We do not expect this fraction to drop with
vaccination since most cases and
hospitalizations are in unvaccinated
individuals and asymptomatic vaccinated
infections are likely not reported.
There are many possible effects that could
change the fraction, including: vaccination,
age distribution of infections, changing
severity, testing protocols, changes in
undetected infections.
Source (J. von Bergmann) StatCan Table 13-26-0003 14August 18, 2021
BC COVID-19 Modelling Group
Cases, hospitalizations and ICU occupancy over time
Despite the success of the
provincial vaccination
programme, hospitalization
and ICU occupancy are now
rising.
15August 18, 2021
BC COVID-19 Modelling Group
Longer term projections - no change scenario
The following slides show projections for the BC situation, assuming no change to
current behaviour is made in the coming months. No capacity limits are imposed.
● These are therefore not forecasts. We would expect measures would come
into force before reaching capacity limits.
Two projections were done independently using very different model approaches.
The hospital occupancy projections are very close, despite different structure and
assumptions in the models.
16August 18, 2021
BC COVID-19 Modelling Group
Longer term projection (no action taken)
If transmission
continued at
present rate, daily
cases would dwarf
the previous record
of April 2021.
Infection rates
eventually decline
due to the herd
effect.
In this scenario,
hospital and ICU
demands would
exceed available
capacity (including
surge beds).
17
Source (D. Karlen). See www.pypm.ca. These models have no age structure. Fits include past vaccination schedule. Assumes 77% of total population vaccinated.August 18, 2021
BC COVID-19 Modelling Group
Medium-term projection: 94% overall efficacy and
transmission matched to recent BC trend
Many sources of uncertainty (not
shown), including the transmission
rate, based on current growth, and
vaccine efficacy.
All scenarios that project current
transmission forward result in high
case numbers among unvaccinated
individuals.
Mild or asymptomatic vaccinated
individuals are shown (grey), but
likely would not be reported.August 18, 2021
BC COVID-19 Modelling Group
Projected census hospitalization from unvaccinated
infections
Estimated using the age
distribution of cases,
age-based risk and duration Individual and
of hospitalization. policy actions
would likely be
Optimistic: no breakthrough taken to avert the
infections shown, but some peak.
may require hospital care. No
increase in severity (from
May to Fall 2021) due to
Delta.
This is a projection, not a
prediction: it will change if
we change measures or
behaviour, or substantially
increase vaccination rates. Model: Age- and contact-structured vaccination model, BC data. See
https://www.medrxiv.org/content/10.1101/2021.02.23.21252309v1August 18, 2021
BC COVID-19 Modelling Group
COVID-19 and children
Last year, few children were exposed. Children are unlikely to get severe disease compared to
adults, but can require hospital care and can get long COVID.
Will COVID-19 in schools this year be like last year?
● With measures largely removed, community transmission will be higher
● Schools have reflected community transmission. Exposures in schools will likely be higher
with higher community transmission.
● Children under 12 are currently unvaccinated
● Transmission within schools could increase sharply without control measures in place,
and because of Delta (higher transmission rate).
● The US is seeing considerable school transmission.
The 2020-2021 school year is likely not a good model for the coming school year.August 18, 2021
BC COVID-19 Modelling Group
Model projections for 0-19 infections in BC
Children make up a much larger
portion of the unvaccinated
people than they do of the total
population.
For example children under 10
are 9% of the population, but
36% of the unvaccinated
population.
High community transmission
in the context of vaccination is
likely to lead to large numbers
of infections in children.
Model: Age- and contact-structured vaccination model, BC data. See
https://www.medrxiv.org/content/10.1101/2021.02.23.21252309v1August 18, 2021
BC COVID-19 Modelling Group
What actions are needed to avoid a crisis?
Transmission will need to be reduced to avoid exceeding health care capacity.
The next slides show model projections for two scenarios:
1. Expansion of vaccination to 90% of total population
○ Vaccination of children under 12 is not yet approved. Even with rapid rollout, vaccine immunity
grows slowly. On its own, it is insufficient to avoid a potential crisis.
2. Measures to reduce transmission brought in during expansion of vaccination
to 90% of total population
○ Keep the growth of infections under control while vaccine immunity continues to build. Delta
growth has been stopped in several EU nations.
○ Relaxation of measures can take place once vaccine immunity is sufficient to prevent growth
of delta infections
Only the second scenario, with measures that reduce contact rates and
transmission, is effective soon enough to avoid a major health care impact. 22August 18, 2021
BC COVID-19 Modelling Group
Longer term projection (expansion of vaccine coverage)
In this scenario,
first dose
vaccinations
increase by 20,000
per day starting
next week until
90% of population
is vaccinated.
Due to the delay in
gaining vaccine
immunity, the peak
hospital demand
remains
unacceptable.
23
Source (D. Karlen). See www.pypm.ca. These models have no age structure. Fits include past vaccination schedule. Assumes 90% of total population vaccinated.August 18, 2021
BC COVID-19 Modelling Group
Longer term projection (measures and vaccine expansion)
expansion) In this example,
measures enacted
next week stop the
growth of delta,
while vaccine
immunity builds.
Measures are
rescinded after six
weeks.
While demands
exceed previous
levels, they are
reduced compared
to the vaccination
only scenario.
24
Source (D. Karlen). See www.pypm.ca. These models have no age structure. Fits include past vaccination schedule. Assumes 90% of total population vaccinated.August 18, 2021
BC COVID-19 Modelling Group
Final words
Like all US states and other provinces in Canada, BC is experiencing rapid growth
due to the Delta variant in an environment with significant community transmission.
Many US states now have more than 90% of ICU beds currently in use with
demand continuing to increase. (Source: HHS). States are seeing increasing
hospitalizations in children with some children’s hospitals reaching capacity.
BC is currently on the same path, with serious consequences for health care.
By taking action to reduce transmission and expand vaccination, the impact on the
health care system can be reduced significantly.
25August 18, 2021
BC COVID-19 Modelling Group
Appendix
26August 18, 2021
BC COVID-19 Modelling Group
Closing the circle: Vaccination status by age
August 14th update includes data through August 7th, 2021
Slow progress on 1st doses:
Fraction of BC’s population with
at least one vaccine shows slow
growth, risingAugust 18, 2021
BC COVID-19 Modelling Group
Projecting vaccination status
Vaccination rates are changing globally, making it challenging
for universities, festivals, trade shows, conferences, or other
organizations who might want to quantify how at-risk their
participants are for COVID-19 infection.
We have created a browser app to estimate the numbers of
unvaccinated, partially vaccinated, and fully vaccinated people
in a group at a future date, based on data from around the
world on vaccination rates by location and age group.
While most accurate over short time frames, this app provides
event organizers a clearer picture of the susceptibility of their
participants to COVID-19.
28
Source (B. Wiley)August 18, 2021
BC COVID-19 Modelling Group
Vaccination helps
Community Health Service Areas (CHSA) with higher vaccination rates have significantly lower daily case
counts in BC. Communities that are 70% of eligible people vaccinated have five times higher rates of
COVID-19 cases than those with 90% vaccination.
Average daily case rate/100,000
Vaccines protect, even against Delta,
e.g., these studies from the UK:
● 8.3-fold lower infection ratesa
(July 30 - August 12)
● 2.6-fold lower chance of
hospitalization if infectedb
→ Vaccination double protects
Vaccination % in CHSA p = 0.0005
(at least one dose, 12+) permutation test
Source (S. Otto). BCCDC data portal’s surveillance dashboard data; see maps for regions
that would most benefit from community vaccination drives (accessed August 13, 2021). http://www.getvaccinated.gov.bc.ca 29
a
Lopez-Bernal (2021) NEJM. b Sheikh et al. (2021) LancetAugust 18, 2021
BC COVID-19 Modelling Group
Hospitalizations as share of cases in Canada
30You can also read