Technical information for the 2018 climate change (temperature) trend and condition report card - DEW Technical note 2018/47 - Enviro Data SA
←
→
Page content transcription
If your browser does not render page correctly, please read the page content below
Technical information
for the 2018 climate
change (temperature)
trend and condition
report card
DEW Technical note 2018/47

Technical Information for the
Climate Change: Temperature
Trend and Condition Report Card 2018

Department for Environment and Water

August 2018

DEW Technical note 2018/47
Department for Environment and Water
GPO Box 1047, Adelaide SA 5001
Telephone          National (08) 8463 6946
                   International +61 8 8463 6946
Fax                National (08) 8463 6999
                   International +61 8 8463 6999
Website            www.environment.sa.gov.au

Disclaimer
The Department for Environment and Water and its employees do not warrant or make any representation
regarding the use, or results of the use, of the information contained herein as regards to its correctness, accuracy,
reliability, currency or otherwise. The Department for Environment and Water and its employees expressly
disclaims all liability or responsibility to any person using the information or advice. Information contained in this
document is correct at the time of writing.

This work is licensed under the Creative Commons Attribution 4.0 International License.
To view a copy of this license, visit http://creativecommons.org/licenses/by/4.0/.

ISBN 978-1-925668-89-6

Preferred way to cite this publication
Department for Environment and Water (2018). Technical information supporting the Climate: Temperature trend
and condition report card 2018. DEW Technical note 2018/47, Government of South Australia, Department for
Environment and Water, Adelaide.

Download this document at https://data.environment.sa.gov.au

DEW Technical note 2018/47                                                                                           ii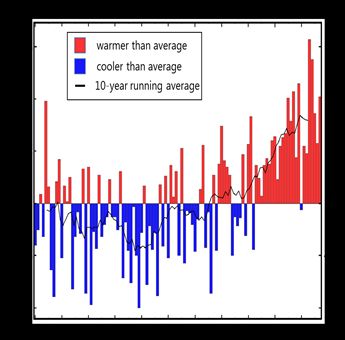
Consultation and acknowledgements
This document was prepared by Graham Green (DEW). Improvements were made to this report and associated
report card based on reviews by Darren Ray (Bureau of Meteorology), Colin Cichon, Ben Smith, Fi Taylor, Tom
Carrangis and Sandy Carruthers (all DEW).

DEW Technical note 2018/47                                                                                    iii
Contents
Consultation and acknowledgements                                                             iii

Contents                                                                                      iv

Summary                                                                                        v

1      Introduction                                                                            1
       1.1      Climate change in Australia                                                    1
       1.2      Temperature                                                                    1

2      Methods                                                                                 2
       2.1      Data sources and collection                                                    2
       2.2      Analysis of trend, condition and information reliability                       5
       2.2.1    Trend                                                                          5
       2.2.2    Condition                                                                      5
       2.2.3    Reliability                                                                    6

3      Discussion                                                                              8
       3.1      Trend                                                                          8
       3.2      Condition                                                                      8

4      References                                                                              9

List of tables

Table 2.1.      Summary of information sources and analysis                                    2
Table 2.2.      Trend definitions                                                              5
Table 2.3.      Condition definitions                                                          5
Table 2.4.      Information reliability scores for temperature                                 6
Table 2.5.      Guides for applying information currency                                       6
Table 2.6.      Guides for applying information applicability                                  6
Table 2.7.      Guides for applying spatial representation of information (sampling design)    7
Table 2.8.      Guides for applying accuracy information                                       7

DEW Technical note 2018/47                                                                          iv
Summary This document describes the indicators, data sources, analysis methods and results used to develop 2018 report card on Climate: Temperature. The reliability of data sources for their use in this context are also described. DEW Technical note 2018/47 v
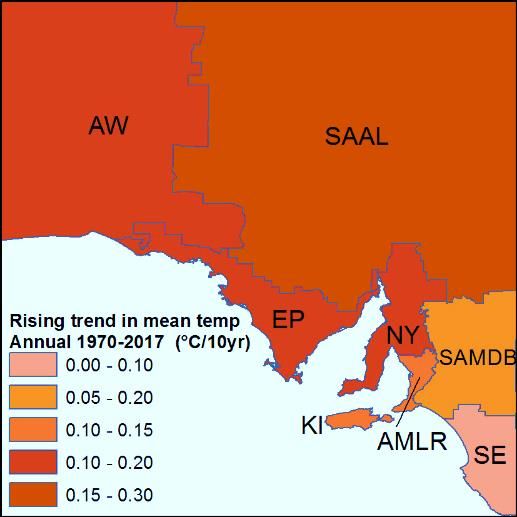
1         Introduction
1.1       Climate change in Australia

Climate affects almost every part of our lives. Communities, industries, landscapes and ecosystems all develop with
a tolerance for a range of climate variation. If the climate changes beyond that range of tolerance, then they must
either adapt, migrate, transform or decline.

According to the Australian Academy of Science, “Earth’s climate has changed over the past century. The
atmosphere and oceans have warmed, sea levels have risen, and glaciers and ice sheets have decreased in size.
The best available evidence indicates that greenhouse gas emissions from human activities are the main cause.
Continuing increases in greenhouse gases will produce further warming and other changes in Earth’s physical
environment and ecosystems.”

The Bureau of Meteorology (BoM) and other science agencies employ a range of air, land and marine sensors to
track climatic trends across Australia. BOM’s Australian Climate Observations Reference Network – Surface Air
Temperature dataset is based on a network of over 100 stations.

BoM’s biennial State of the Climate report draws on the latest monitoring, science and projection information to
describe variability and changes in Australia's climate (including temperature) and how it is likely to change in the
future.

1.2       Temperature

The Climate: Temperature report card reports on the decadal timescale trends in temperature change observed in
South Australia since 1970. The information presented is based on BoM observed trend data representing 1970 to
the present.

The report card provides textual comments on the trends in observed temperature in two figures presented in the
card. These figures show 1) a colour-coded map of the ranges of change in mean annual temperature in the eight
NRM regions of South Australia since 1970, and 2) a graph of the annual mean temperature anomaly for South
Australia from 1910 to 2017.

DEW Technical note 2018/47                                                                                              1
2            Methods
2.1          Data sources and collection

The content of the Climate: Temperature report card includes a combination of elements of textual information,
graphical figures, trend and condition ratings, and summary statements about the observed temperature trends in
South Australia. The information sources and analyses applied to derive each element of the report card content
are summarised in Table 2.1. The method of selection of the trend, condition and information reliability ratings is
described in Section 2.2.

Table 2.1.     Summary of information sources and analysis

Report Card      Content                                       Information sources / analysis
Element
Trend quote      Average annual temperatures across            The regional temperature trend map in the top figure of the report
                 South Australia have been increasing          card shows a rising trend in temperature from 1970–2017 in all of
                 since the 1970s, with the highest rates of    the state’s NRM regions. The graph in the bottom figure shows a
                 increase in the north of the state.           marked trend of increased annual mean temperature anomalies
                                                               (compared to a 1961–1990 baseline period) for South Australia.
                                                               The temperature data used to generate the top and bottom figures
                                                               are drawn from the statewide temperature datasets from the
                                                               Australian climate variability and change trend tracker BoM
                                                               website:
                                                               (http://www.bom.gov.au/climate/change/index.shtml#tabs=Tracke
                                                               r&tracker=trend-maps)
Trend text       This assessment uses Bureau of                The statement regarding the average annual temperature across
                 Meteorology (BoM) variability and             SA now being approximately 0.8 oC warmer than in the 1970s is
                 change trend maps. These are based on         derived from the difference between the SA state average annual
                 observed temperature data from BoM            temperature anomaly in the past 10 years (2008–2017) and the
                 monitoring stations across Australia.         state average annual temperature anomaly for the 30-year period
                                                               from 1960–1989. These were calculated using the temperature
                 The average annual temperature across
                                                               anomaly data underlying the lower figure in the report card. The
                 the state is now approximately 0.8
                                                               annual temperature anomalies are compared to a baseline period
                 degrees Celsius (°C) warmer than in the
                                                               from 1961–1990. These datasets were drawn from the Australian
                 1970s.
                                                               climate variability and change trend tracker BoM website:
                 The increase in annual average                (http://www.bom.gov.au/climate/change/index.shtml#tabs=Tracke
                 temperature has been variable, such that      r&tracker=trend-maps)
                 the coolest parts of the state in the South
                                                               The statements on the variations in rates of the warming between
                 East Natural Resources Management
                                                               different parts of SA are based on observation of the temperature
                 (NRM) Region have seen the lowest
                                                               trend map in the top figure of the report card.
                 increases (top figure).

                 The highest rate of increase in
                 temperature is observed in the South
                 Australian Arid Lands (SAAL) NRM
                 Region, adding up to 1.5 °C to mean
                 annual temperatures over the past 47
                 years in what was already the warmest
                 part of South Australia.

DEW Technical note 2018/47                                                                                                   2
Condition The condition is rated as fair. Overall, The condition rating was applied according to the criteria for a
quote changes in temperature across SA since ‘fair’ condition: refer 2.2.2 below. This rating was applied because
the 1970s have been manageable. the current condition of annual temperatures, having shown a
rising trend over recent decades, particularly in the warmest
regions of SA, does not consistently meet environmental,
economic and social expectations in all areas and particularly at
times of temperature extremes, such as during heat waves.
Condition text Communities and industries, particularly in the The comment on the frequency of days reaching over 40 oC in
hot and arid north east of SA, now experience Adelaide over the past ten years is based from a count of the
a higher frequency of very hot daytime and frequency of 40+ oC days in the ACORN-SAT dataset for Adelaide
night-time temperatures during summer. in 2008–2017, compared with the previous 30-year period 1977–
In Adelaide, the frequency of days reaching 2007.
over 40 oC in the past ten years has more
than doubled compared to the period 1977– The final comment in the condition text is based on an observation
2007. of the SA annual temperature anomaly graph shown in the bottom
Since 1992, South Australia has experienced figure of the report card.
only one year with a mean temperature below
the mean annual temperature of the 1961–
1990 period (bottom figure).
Quote Average annual temperatures have This comments is based simply on an observation of the SA
increased across the state in the past 40 regional temperature trends map shown in the top figure of the
years, especially in the arid north-east report card.
Top figure
The information in the two figures in this report card is drawn from
the BoM Australian variability and change trend tracker website.
The NRM region temperature trend map in the Temperature report
card has been derived from the temperature trend maps for SA on
the website.
(http://www.bom.gov.au/climate/change/index.shtml#tabs=Tracke
r&tracker=trend-maps)
The original map is a contour map of zones of decadal
temperature trends. We have grouped the ranges of temperature
change trends that this map shows within each SA NRM region,
and colour-coded each of the NRM regions according to the range
of the temperature change trends.
Bottom figure
The graph of the statewide annual mean temperature anomaly is
constructed from data drawn from the data download option at
the BoM Australian variability and change trend tracker website:
http://www.bom.gov.au/climate/change/index.shtml#tabs=Tracker
&tracker=trend-maps
The graph shows the difference (anomaly) between statewide
mean annual temperature for each year from 1910 to 2017,
compared to the mean annual statewide temperature during the
period 1961–1990.
DEW Technical note 2018/47 3Rationale Climate affects almost every part of our This is a general comment on the rationale for providing a report
lives. Communities, industries, landscapes on the trend and condition of temperature in South Australia.
and ecosystems all develop with a
tolerance for a range of climate variation.
If the climate changes beyond that range
of tolerance, then they must either adapt,
migrate, transform or decline.
Pressures According to the Australian Academy of This statement from the Australian Academy of Science was
Science, “Earth’s climate has changed selected to describe this pressure as it encapsulates a statement of
over the past century. The atmosphere the primary cause of warming, the effects on the Earth’s physical
and oceans have warmed, sea levels have environment in the past and future. The statement is drawn from
risen, and glaciers and ice sheets have Australian Academy of Science (2015)
decreased in size. The best available www.science.org.au/climatechange
evidence indicates that greenhouse gas
emissions from human activities are the
main cause. Continuing increases in
greenhouse gases will produce further
warming and other changes in Earth’s
physical environment and ecosystems.”
Management BoM and other science agencies employ Information on the Australian Climate Observations Reference
a range of air, land and marine sensors to Network – Surface Air Temperature dataset is drawn from the BoM
track climatic trends across Australia. The Long-term temperature record website (BoM, 2018b):
BOM’s Australian Climate Observations http://www.bom.gov.au/climate/change/acorn-sat/
Reference Network – Surface Air and the BoM’s ACORN-SAT synthesis paper (BoM, 2016a):
Temperature dataset is based on a http://www.bom.gov.au/climate/change/acorn-
network of over 100 stations. sat/documents/About_ACORN-SAT.pdf
The BoM’s biennial State of the Climate
report draws on the latest monitoring,
The BoM State of the Climate report is summarised in the Bureau’s
science and projection information to
State of the Climate 2016 website (BoM, 2016b):
describe variability and changes in
http://www.bom.gov.au/state-of-the-climate/
Australia's climate (including
temperature) and how it is likely to
change in the future.
DEW Technical note 2018/47 42.2 Analysis of trend, condition and information reliability
2.2.1 Trend
The trend rating for temperature was determined to be ‘getting worse’. The statewide rise in average annual
temperatures over the recent decades is assessed to be a trend that is ‘getting worse’ due to the increased risk of
extreme heat conditions, threats to water security and potential impacts to agriculture and ecosystems that may
result from a warmer climate.
Table 2.2. Trend definitions
Trend Trend definition
Getting better Over a scale relevant to tracking change in the indicator it is improving in status with good confidence
Stable Over a scale relevant to tracking change in the indicator it is neither improving or declining in status
Getting worse Over a scale relevant to tracking change in the indicator it is declining in status with good confidence
Unknown Data are not available, or are not available at relevant temporal scales, to determine any trend in the
status of this resource
Not applicable This indicator of the natural resource does not lend itself to being classified into one of the above
trend classes
2.2.2 Condition
The condition rating for temperature was determined to be ‘fair’ because, while temperatures have risen
throughout SA, the changes in annual temperatures in most of SA have been manageable.
Table 2.3. Condition definitions
Condition Condition definition Thresholds
Very good The natural resource is in a state that meets all environmental, economic and social expectations,
based on this indicator. Thus, desirable function can be expected for all processes/services
expected of this resource, now and into the future, even during times of stress (e.g. prolonged
drought)
Good The natural resource is in a state that meets most environmental, economic and social
expectations, based on this indicator. Thus, desirable function can be expected for only some
processes/services expected of this resource, now and into the future, even during times of stress
(e.g. prolonged drought)
Fair The natural resource is in a state that does not meet some environmental, economic and social
expectations, based on this indicator. Thus, desirable function cannot be expected from many
processes/services expected of this resource, now and into the future, particularly during times of
stress (e.g. prolonged drought)
Poor-Very The natural resource is in a state that does not meet most environmental, economic and social
poor expectations, based on this indicator. Thus, desirable function cannot be expected from most
processes/services expected of this resource, now and into the future, particularly during times of
stress (e.g. prolonged drought)
Unknown Data are not available to determine the state of this natural resource, based on this indicator
Not This indicator of the natural resource does not lend itself to being classified into one of the above
applicable condition classes
DEW Technical note 2018/47 52.2.3 Reliability
Information is scored for reliability based on the average of subjective scores (1 [worst] to 5 [best]) given for
information currency, applicability, level of spatial representation and accuracy. Definitions guiding the application
of these scores are provided in Table 2.5 for currency, Table 2.6 for applicability and Table 2.7 for spatial
representation.
The overall reliability rating for this report card is ‘very good’. This is the rating ascribed to an overall score of 4
(rounded from 4.25) out of a maximum of score of 5, based on the average of the ratings ascribed to applicability,
currency and spatial representation and accuracy of the information (Error! Reference source not found.
Table 2.4. Information reliability scores for temperature
Indicator Applicability Currency Spatial Accuracy Reliability
Temperature data 5 5 3 4 4.25
2.2.3.1 Information currency score
The information has a currency score of 5 as measured temperature data up to 2017 has been used.
Table 2.5. Guides for applying information currency
Currency score Criteria
1 Most recent information >10 years old
2 Most recent information up to 10 years old
3 Most recent information up to 7 years old
4 Most recent information up to 5 years old
5 Most recent information up to 3 years old
2.2.3.2 Information applicability score
The information has an applicability rating score of 5 because the data is based on measurements which are direct
indicators of temperature and these measurements are location-specific, being from rain measurement stations
distributed across SA.
Table 2.6. Guides for applying information applicability
Applicability score Criteria
1 Data are based on expert opinion of the measure
2 All data based on indirect indicators of the measure
3 Most data based on indirect indicators of the measure
4 Most data based on direct indicators of the measure
5 All data based on direct indicators of the measure
DEW Technical note 2018/47 62.2.3.3 Information spatial representation score
A spatial representation score of 3 has been assigned because the data is from temperature monitoring stations
that are distributed throughout the area of the state, however, each one is representative of temperature over a
limited area within the vicinity of the monitoring station. Hence, the whole extent of the state is represented by
the monitoring network, however the measurements do not fully represent the spatial variation of temperature
within the state.
Table 2.7. Guides for applying spatial representation of information (sampling design)
Spatial
score Criteria
1 From an area that represents less than 5% the spatial distribution of the asset within the
region/state or spatial representation unknown
2 From an area that represents less than 25% the spatial distribution of the asset within the
region/state
3 From an area that represents less than half the spatial distribution of the asset within the
region/state
4 From across the whole region/state (or whole distribution of asset within the region/state) using a
sampling design that is not stratified
5 From across the whole region/state (or whole distribution of asset within the region/state) using a
stratified sampling design
2.2.3.3 Information accuracy score
The observed changes in average annual temperature are based on direct measurements of daily temperatures at
calibrated monitoring stations distributed across South Australia. However, the coverage of these monitoring
stations is variable across the state, with the more remote areas having a sparse distribution of stations. As a
result, the accuracy of the data, for the purpose of the report card, has been ascribed a score of 4 (Table
2.8)Error! Reference source not found..
Table 2.8. Guides for applying accuracy information
Reliability Criteria
1 Better than could be expected by chance
2 > 60% better than could be expected by chance
3 > 70 % better than could be expected by chance
4 > 80 % better than could be expected by chance
5 > 90 % better than could be expected by chance
DEW Technical note 2018/47 73 Discussion 3.1 Trend The trend rating for temperature was determined to be ‘Getting Worse’ as the average annual temperature is rising over the whole of South Australia. The rate of temperature rise is greatest in the northern regions of the state, which already experience a hot climate. 3.2 Condition The condition rating assigned is ‘Fair’ because, while annual average temperature has risen over the whole of South Australia over recent decades, the changes in average temperatures experienced to date have been manageable. DEW Technical note 2018/47 8
4        References
Australian Academy of Science (2015). “The science of climate change: Questions and answers”, Australian
Academy of Science, Canberra, 2015 www.science.org.au/climatechange

Bureau of Meteorology (2016a). Long-term temperature record
Australian Climate Observations Reference Network – Surface Air Temperature (ACORN-SAT) synthesis paper:
http://www.bom.gov.au/climate/change/acorn-sat/documents/About_ACORN-SAT.pdf

Bureau of Meteorology (2016b). State of the Climate 2016 website:
http://www.bom.gov.au/state-of-the-climate/

Bureau of Meteorology (2018a). Australian climate variability & change - Trend maps website:
http://www.bom.gov.au/cgi-bin/climate/change/trendmaps.cgi

Bureau of Meteorology (2018b). Long-term temperature record: Australian Climate Observations Reference
Network – Surface Air Temperature (ACORN-SAT) website:
http://www.bom.gov.au/climate/change/acorn-sat/

DEWNR (2017). Trend and Condition Report Cards for South Australia’s Environment and Natural Resources.
Report. Department of Environment, Water and Natural Resources, Government of South Australia. Available at:
https://data.environment.sa.gov.au/NRM-Report-Cards/Documents/Trend_Condition_Report_Cards_2017.pdf

Government of South Australia (2012a). Natural Resource Management State and Condition Reporting Framework
SA. Report. Adelaide. Available at:
https://www.waterconnect.sa.gov.au/Content/Publications/DEWNR/91913%20NRM%20Reporting%20Framework
%202012%20Final%20Draft%20v7.pdf

DEW Technical note 2018/47                                                                                     9
You can also read