Perspectives on US Inbound Travel - tourismeconomics.com - AHLA
←
→
Page content transcription
If your browser does not render page correctly, please read the page content below
Perspectives on US Inbound Travel

                                         tourismeconomics.com
                                    info@tourismeconomics.com
                                                  610.995.9600

June 2018
Overview
Growth in overseas visitors to the US has traditionally been measured based on arrival forms completed by inbound
passengers (I-94) and reported by the National Travel and Tourism Office (NTTO). While this I-94 data has long served
as an important indicator of the valuable inbound US travel market, Tourism Economics has concluded that recent I-94
data are underrepresenting overseas travel to the US.

⚫   On April 9, 2018, NTTO announced the suspension of reporting on overseas arrivals, acknowledging irregularities in
    the data. At least two issues seem to be the culprits. First, the raw data collected by Department of Homeland
    Security (DHS) include untenably large (triple-digit) increases in overseas visitors tagged as not spending any nights
    in the US. These records are not counted as “visitors” as the I-94 definition requires an overnight stay. Second, the
    raw data include a significant number of visitors traveling on visas who were incorrectly categorized as US residents.
    By definition, residents are not counted as visitors, resulting in yet another source of international arrivals
    underreporting.

⚫   Tourism Economics conducted an extensive analysis of alternative government and private sector datasets and
    compared these to the official I-94 data measuring overseas travel to the US. This analysis shows that I-94 data not
    only overstated growth in 2014 and 2015 with the move to electronic processing of DHS records, as has been
    previously documented, but that continued disparities in the data have persisted through 2016 and 2017.

⚫   This report presents an analysis of various secondary data sources to establish a more reliable view of overseas
    arrivals performance over the past three years as well in 2018.

2
Summary of Tourism Economics estimates
⚫   The adjacent table presents our estimates of international      US International Inbound Estimates, % change
                                                                                                           2017               2018
    travel to the US in 2017 and through the first four months of                                       Full year          Jan-April
    2018. We estimate total international visitor arrivals          Total                                    1.6%             3.9%

    (overseas plus Canada and Mexico) to the US increased           Overseas                                 3.6%              3.2%
                                                                    North America
    1.6% in 2017, and 3.9% year-to-date April 2018.                          Canada                          4.9%              5.0%
                                                                             Mexico                         -5.7%              8.0%
⚫   Before it was suspended, official estimates of overseas         Latin America*                          7.0%               4.5%
                                                                              Brazil                        5.0%              20.0%
    (total international excluding Canada and Mexico) visitation              Argentina                     8.4%               5.1%
    to the US based on I-94 data showed a contraction of 6.3%                 Colombia                      3.5%               8.6%
    (Jan.-Sep. 2017). In contrast, we estimate overseas             Europe                                  2.6%               3.7%
                                                                                UK                          0.0%               2.2%
    visitation to the US increased 3.6% in 2017. This is                        France                      3.9%               7.6%
    corroborated by a combination of immigration and origin-                    Germany                     4.5%             -10.3%

    destination datasets, with four separate sources showing        Asia Pacific                            4.1%               1.9%
                                                                               Australia                    0.1%               6.1%
    growth of between 3.4% and 6.0%.                                           China                        6.0%               8.9%
                                                                               India                        4.2%               5.7%
                                                                               Japan                       -1.0%              -3.7%
⚫   Tourism Economics will continue to track these data sources                S Korea                     13.1%               2.6%
    on a monthly basis to present recent trends in international    Middle East                             -6.2%              0.1%
    inbound. These are subject to revision as input data are                  Israel                         5.4%              9.7%
                                                                    Africa                                  -3.3%             -9.8%
    revised and additional data become available.
                                                                    * Latin America = South America, Central America and Caribbean
                                                                     Source: Tourism Economics

3
Monthly data show undercounting began in early 2016
⚫   The volatility of I-94 data is evident in comparison to three     US Overseas Inbound Indicators
    alternative measures of overseas arrivals. The                    year-over-year % change
    accompanying graph shows monthly year-over-year                  25%
    changes.                                                                                                    OAG
                                                                     20%                                        APIS
⚫   The Advanced Passenger Information System (APIS)                                                           I-94
    maintained by the Department of Homeland Security (DHS)          15%

    measures non-citizen inbound travel. APIS citizenship data
                                                                     10%
    is only a proxy for visits as it includes non-US citizens who
    are also US residents and thus not “visitors” as well as other    5%
    non-visitor visa types.
                                                                      0%
⚫   Nevertheless, the overlap with I-94 is more than 80% so we             Jan-14   Jul-14   Jan-15   Jul-15   Jan-16   Jul-16   Jan-17   Jul-17

    generally have found APIS to provide a reasonable proxy.         -5%
    Both OAG and SABRE are private sector measures of air
                                                                     -10%
    passengers traveling to the US (excluding returning
    residents) and are based on GDS booking data. All three
                                                                     -15%
    alternative sources track closely together.

⚫   Historically, we also observe APIS and OAG trends to track
    closely together on a monthly basis as shown to the right.
    Data from I-94 emerges as the outlier, especially over the
    past year.

4
Historical annual correlations
⚫   The adjacent chart illustrates the volatility of I-94             US Overseas Inbound Indicators, % Change
    data on an annual basis by comparing it to three                           I-94      APIS    OAG       SABRE
                                                              10.0%
    alternative measures of overseas arrivals.
                                                              8.0%
⚫   Beginning in 2013 and continuing into 2014, we see
    I-94 outpacing the other measures due to                  6.0%

    documented changes to methods and definitions in          4.0%
    the I-94 program.
                                                              2.0%
⚫   After the one-year anniversary of these changes, we
                                                              0.0%
    expected the growth measured by I-94 to converge                    2013          2014       2015       2016       2017 YTD
    to the underlying growth in inbound travel. Instead, I-   -2.0%
    94 data has reversed course and began under-
                                                              -4.0%
    representing growth in 2016 and 2017.
                                                              -6.0%
⚫   Alternate sources correlate within +/- 2% while I-94         I-94 and APIS        I-94 outpaces APIS   I-94 growth lags APIS
    is consistently the outlier.                                 track closely        due to changes in    due to various potential
                                                                                      I-94 program         processing issues

5
Establishing an alternative view of 2017
⚫   To confirm our view of 2017, we analyzed an
                                                                    US Overseas Inbound Indicators, % Change
    additional dataset from DiiO that tracks travel on an
    origin-destination basis and allows for analysis of     8.0%
    non-resident travel to the US.                                                                                 6.0%
                                                            6.0%                   5.5%
                                                                                                        4.4%
⚫   These data corroborate the growth story told by         4.0%                            3.4%
    APIS, SABRE, and OAG. DiiO aviation data
                                                            2.0%
    indicates 6% growth in overseas travel to the US in
    2017, while SABRE indicates 4.4%, and APIS              0.0%
                                                                                          2017 YTD
    indicates 5.5% growth.
                                                            -2.0%
                                                                                                     I-94 (Jan-Sept)
⚫   This leaves I-94 as the only source showing a           -4.0%                                    APIS (Full-year)
                                                                                                     OAG (Full-year)
    contraction in 2017.
                                                            -6.0%                                    SABRE (Jan-July)
                                                                          -6.3%
                                                                                                     DiiO (Full-year)
                                                            -8.0%

                                                            APIS: non-citizen air arrivals at US borders
                                                            OAG: Overseas origin air passengers arriving in US
                                                            SABRE: Overseas origin air passengers arriving in US
                                                            DiiO: Overseas origin air passengers arriving in US

6
A comparative view of US inbound performance in 2017
The below chart compares our full-year 2017 estimates for overseas travel to the US with published I-94 statistics. We estimate that
overseas travel to the US increased 3.9% in 2017. We estimate Asia led growth with a 4.1% expansion, Latin America and Oceania both
expanded modestly, while losses from the Middle East and Africa were not as severe as I-94 indicates.
International visits to the US by region
NTTO Jan-Sep 2017 % change and TE full year 2017 estimates
10%
5% 3.9% 4.1%
1.6% 2.6%
0.4% 0.1%
0%
-5% -2% -2% -2%
-4% -3.2%
-6% -6.2%
-10%
NTTO TE
-15%
-14%
-20%
-25%
-30% -28%
-35% -32%
Total Overseas Mideast Africa LATAM Europe Oceania Asia
Source: NTTO, Tourism Economics
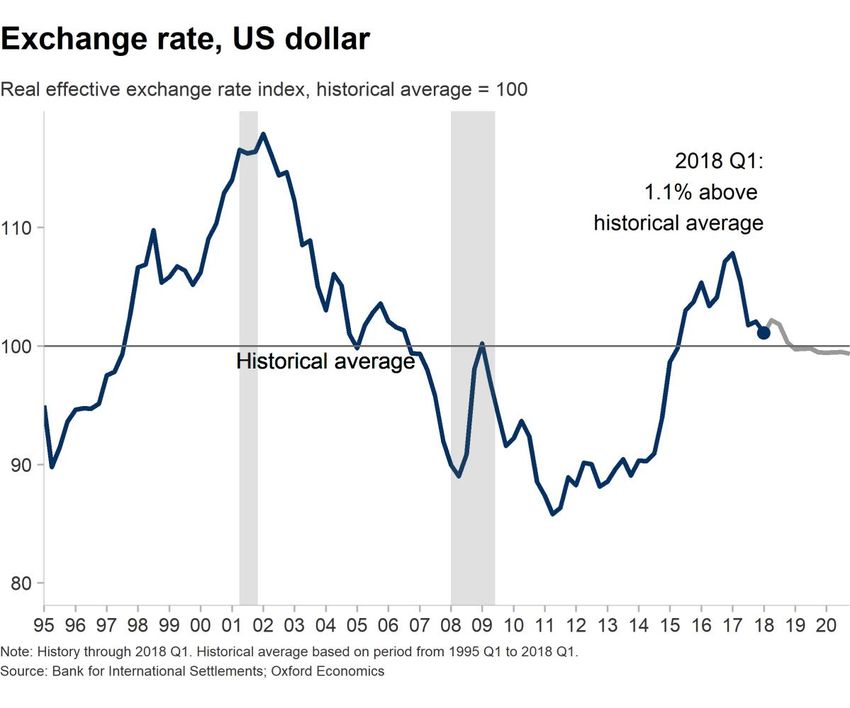
7The dollar eased, supporting growth
While the dollar remains strong relative to the 2011 to 2014 period, it has weakened somewhat over the past year and now sits merely
1.1% above its historic average against US trading partners. As a result, the US is more price attractive in 2018 to travelers from all major
origin markets than it was two years ago.
Exchange rate shifts, 2018 / 2016
$US per local
Japan 0%
Mexico 3%
Canada 3%
Australia 4%
India 4%
United Kingdom 5%
Brazil 5%
China 6%
Colombia 7%
South Korea 9%
Chile 10%
European Union 14%
Russia 16%
0% 5% 10% 15% 20%
Source: Oxford Economics
8Momentum is carrying over into 2018
⚫ The most recent APIS data paints a Non-citizen arrivals to the US by port of departure
picture of continuing market strength for January-April 2018, YTD % change
most world regions.
Germany -10%
Africa -10%
⚫ Asia is growing modestly, with strength Japan -4%
from China outweighing weakness from Middle East 0%
Asia 2%
Japan, while South Korea is slowing. United Kingdom 2%
S Korea 3%
⚫ In Europe, strength from France and Overseas 3%
the UK is compensating for a drop in Europe 4%
Total 4%
German arrivals. Canada 5%
Australia 6%
⚫ Brazil is now surging after a large France 8%
Mexico 8%
decline in 2016 and modest growth in China 9%
2017. Brazil
-15% -10% -5% 0% 5% 10% 15% 20%
⚫ Canada continues to rebound from Source: APIS, Banco de Mexico, Statistics Canada
three years of declines (2014-2016).
Mexico appears to have reversed
course from last year and is performing
well.
9OAG flight data confirm general trends
⚫ OAG data is based on originating airport International air arrivals to the US
while APIS is based on port of departure. Jan-Mar 2018, YTD % change
In APIS, a visitor from India who connects Germany
in London would be counted as an arrival Japan OAG (by origin airport)
South Korea
from the UK. However, OAG is based on a Australia APIS (by port of departure)
Hong Kong
limited GDS-based sample so its trends Overseas
Canada
are not always indicative of the market. Argentina
United Kingdom
India
⚫ However, a comparison of the two sources Sweden
France
through March (OAG is not yet available China
Netherlands
for April) shows similar trends. Overseas Mexico
Israel
arrivals increased 4.9% per APIS and Colombia
7.4% per OAG, year-to-date through Ireland
Brazil
March. Italy
Spain
⚫ Weakness from Germany and Japan is -15% -10% -5% 0% 5% 10% 15% 20% 25% 30% 35%
Source: APIS, OAG
evident in both sources, as is a slowing of
growth from Korea.
⚫ However, the two sources tell a contrasting story for China. OAG indicates no
⚫ Strength from the UK, India, Mexico, growth while APIS shows +9%. New direct flights could explain some of the
Brazil, and Spain is also clear from both disparity but additional analysis will be required to confirm performance of the
sources. Chinese travel market.
10Strongest world economic growth since 2011
⚫ Oxford Economics expects 3.1% global
GDP growth in 2018 will be strongest World GDP
performance in seven years.
% change
⚫ This is being driven by low interest rates, 3.5%
supportive credit, and the fastest world 3.1%
2.9% 3.0% 2.9%
trade since the financial crisis. 3.0% 2.9%
2.5% 2.4%
⚫ Despite the mounting threat of more
protectionist trade measures, we expect
2.0%
the impact on global growth and trade to
be mild.
1.5%
⚫ This should provide a supportive 1.0%
economic base for travel to the US in both
2018 and 2019. 0.5%
0.0%
2014
2015
2016
2017
2018
2019
Source: Oxford Economics
11Economies of major US source markets are all expanding
⚫ Global surveys signal that the global
expansion may lose momentum in Q2.
World GDP by major market in 2018
The global purchasing managers index fell % change
sharply in March. The fall highlights the
India
risk that lingering trade tensions could
China
damage confidence and prompt firms and
World
consumers to delay investment and major
United States
spending plans.
South Korea
Australia
⚫ US economy is expected to reach 2.8%
Mexico
GDP growth in 2018, with inflation
Canada
reaching the Fed’s 2% target.
Brazil
⚫ Eurozone GDP growth forecast for 2018 France
Germany
nudged down to 2.2%, but the pace is
United Kingdom
expected to remain well above trend.
Japan
⚫ China’s growth picked up markedly in 0.0% 2.0% 4.0% 6.0% 8.0%
early 2018, which could provide a boost to
global trade growth in the near term. Source: Oxford Economics
12Next year likely to experience a slowdown
⚫ Economic growth is expected to slow
World GDP by major market
somewhat in 2019 across most markets.
% change
⚫ The US is particularly exposed to the
reduced benefit of tax reform benefits, India
while the deficit rises and mounting trade China
wars hold the potential to stifle export World
growth. United States
South Korea
⚫ India will continue to lead growth among Australia
2017
all major economies as China continues Mexico
2018
its measured slowdown. Canada
2019
Brazil
France
Germany
United Kingdom
Japan
0.0% 2.0% 4.0% 6.0% 8.0%
Source: Oxford Economics
13Global headquarters
Tourism Economics Europe, Middle East Americas Asia Pacific
303 W Lancaster Avenue and Africa
Suite 2E New York Singapore
Wayne PA 19087 Oxford Philadelphia Sydney
610.995.9600 London Mexico City Hong Kong
Belfast Boston Tokyo
Oxford Economics Ltd Frankfurt Chicago
Abbey House Paris Los Angeles
121 St Aldates Milan Toronto
Oxford, OX1 1HB Cape Town San Francisco
UK Dubai Houston
Tel: +44 (0)1865 268900
London
Broadwall House
21 Broadwall
London, SE1 9PL
UK
Tel: +44 (0)203 910 8000
Singapore
Email:
6 Battery Road
info@tourismeconomics.com
#38-05
Singapore 049909
Website:
Tel: +65 6850 0110
www.tourismeconomics.comYou can also read