FULL YEAR RESULTS FOR THE YEAR ENDED 31 DECEMBER 2017 - Devro

Page created by Stanley Murphy
 
CONTINUE READING
FULL YEAR RESULTS FOR THE YEAR ENDED 31 DECEMBER 2017 - Devro
27 FEBRUARY 2018

FULL YEAR RESULTS
FOR THE YEAR ENDED 31 DECEMBER 2017
FULL YEAR RESULTS FOR THE YEAR ENDED 31 DECEMBER 2017 - Devro
FULL YEAR RESULTS PRESENTATION | FOR THE YEAR ENDED 31 DECEMBER 2017
1
THE COLLAGEN CASING COMPANY

Global Leader                  Global Operations          Collagen                         Technology
    One of the world’s                                                                         Differentiation through
•
    leading providers of       2,000+                     •   Main raw material taken
                                                              from the hide of carefully
                                                                                           •
                                                                                               product development
    collagen casings for the   staff across the world
    processed meats sector                                    selected animals             •   Enhanced
•   Supplies 1,000
                               6                              certified for food use           manufacturing
                                                                                               performance and
    customers in 100           manufacturing operations   •   A complex naturally-             increased capacity
    countries worldwide        in Scotland, Australia,        occurring polymer with
                               the Czech Republic,            unique characteristics       •   Close matching of
•   Provides technical         the USA, the Netherlands                                        product design to
    support to food            and China                  •   Dedicated food grade             customer needs and
    manufacturers                                             sourcing arrangements            market requirements
FULL YEAR RESULTS FOR THE YEAR ENDED 31 DECEMBER 2017 - Devro
FULL YEAR RESULTS PRESENTATION | FOR THE YEAR ENDED 31 DECEMBER 2017

2
OVERVIEW

 Financial Results                                       Devro 100
 •   Underlying EBITDA up 9% on                          •   Programme to accelerate the next
     prior year                                              stage of strategic development
       Reflects strong progress in
           underlying business                           •   Initiated in Q4 2016 and
                                                             progressing well
 •   Sales volumes increased 7%
       Most notably in China, SE                        •   Sales volume growth achieved in
         Asia and Russia                                     almost all markets during 2017
 •   Strong operating cash flow*                         •   £7 million manufacturing cost
       Up £19.7m on 2016                                    savings realised in 2017
 •   Improved covenant ratio**                                   Ahead of expectations
       Now 2.1 times                                    •   New Fine Ultra casings introduced
 •   Final dividend maintained                               in H2 as planned

       At 6.1p per share

* Before pension deficit funding ** Covenant ratio = net debt (including derivative liabilities) / underlying EBITDA
FULL YEAR RESULTS FOR THE YEAR ENDED 31 DECEMBER 2017 - Devro
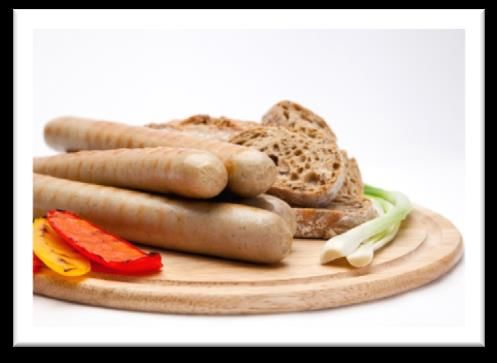
FULL YEAR RESULTS PRESENTATION | FOR THE YEAR ENDED 31 DECEMBER 2017

3

PETER PAGE

COMMERCIAL REVIEW
FULL YEAR RESULTS FOR THE YEAR ENDED 31 DECEMBER 2017 - Devro
FULL YEAR RESULTS PRESENTATION | FOR THE YEAR ENDED 31 DECEMBER 2017

4
REVENUE: EUROPE

                                                                                                                             43%
                                                                                                                               Group
                                                                                                                              revenue

UK & Ireland                        Continental EU                       Russia & East                      Middle E & Africa
•   2% increase in volume and       •   Excellent H2 + 13% volume        •   Adapted the product range to   •   Small proportion of total
    gains for market share              growth                               meet market requirements           business
•   2% improvement on pricing       •   Effective positioning of Devro   •   +21% volume as local           •   Stronger development in
    attributable to success of          offer and sales management           customers grow volumes and         South Africa with focus on gut
    Select Fresh                                                             Devro share recovered              displacement

     Edible collagen casings only
FULL YEAR RESULTS PRESENTATION | FOR THE YEAR ENDED 31 DECEMBER 2017

5
REVENUE: AMERICAS

                                                                                           24%
                                                                                            Group
                                                                                           revenue

         North America                          Latin America
         •   +3% volumes reflects continued     •   Impacted by change in sourcing of
             growth in beefstick category           products away from old USA plant
         •   Continued consolidation of key     •   25% decline in volumes attributed to
             accounts and leading brands            prior year changes
             provides opportunities for long-   •   Q4 stabilised
             term partnerships
                                                •   Opportunities to regain market share
                                                    in the region

    Edible collagen casings only
FULL YEAR RESULTS PRESENTATION | FOR THE YEAR ENDED 31 DECEMBER 2017

6
REVENUE: ASIA / PACIFIC

                                                                                                                 33%
                                                                                                                  Group
                                                                                                                 revenue

China                               South East Asia             Japan                        Australia & NZ
•   +69% volume growth as           •   +29% volume overall     •   Continued growth         •   Mature market
    capacity and product from new                                   in savoury snack and
                                    •   Strongest advances in                                •   Overall consumption lower
    plant supply the market                                         confectionery products
                                        Thailand
    Pricing consistent with prior                                                            •   Volumes adversely impacted
•                                                               •   New Fine Ultra casings
    year                                                                                         by customer manufacturing
                                                                    introduced
                                                                                                 changes
•   Premium segments being
    developed

    Edible collagen casings only
FULL YEAR RESULTS PRESENTATION | FOR THE YEAR ENDED 31 DECEMBER 2017

7
MARKET DYNAMICS

 Regional mix                          Pricing                               Short-term / medium-term
 • Growing volume in Europe and        • Devro remains price leader in       • Global demand growth estimated
   USA where markets are                 most markets and accounts             at 7% for 2017
   consolidating with pressure on
   leading brands                      • Increasing number of price-driven   • Global industry capacity coming
                                         tenders following acquisitions,       into balance
 • Regained share in important           and consolidation among
   markets of Russia and SE Asia                                             • Devro has greater capacity
                                         customers, impacting market           available at lower unit cost
 • Gaining share in China during a       dynamics; providing opportunity       following major capital investment
   period of local oversupply            for long term supply contracts        programme
 • Latin America decline due to        • New business and regained           • Devro continues to seek revenue
   change in Devro’s product             share achieved in a number of         growth in all areas, focussing on
   sourcing                              markets                               the most profitable market
                                       • Holding price in many markets         opportunities, with an emphasis
 • Devro continues to hold share in                                            on growing market share in
   mature markets with historic high     and accounts where Devro is
                                         long established and fully valued     developing economies
   market shares, particularly UK
                                         as a partner
FULL YEAR RESULTS PRESENTATION | FOR THE YEAR ENDED 31 DECEMBER 2017

8
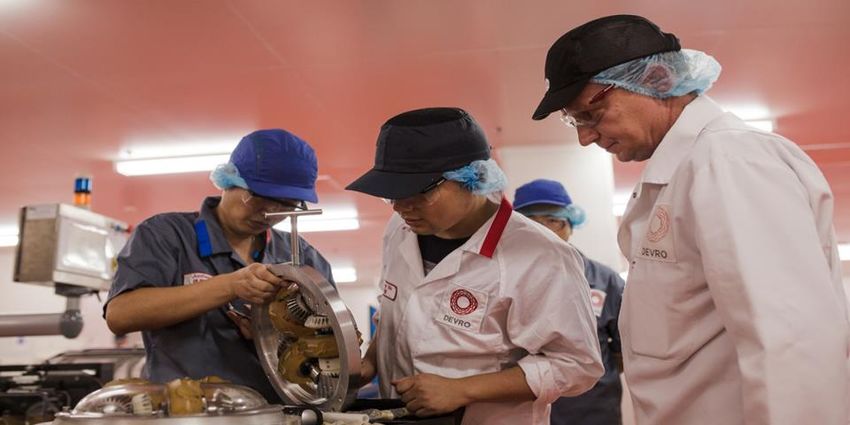
MANUFACTURING & OPERATIONS

Established manufacturing plants in UK
(Scotland), Czech Republic and Australia:

• Benefiting from operating in a single global supply chain
  organisation

• Achieving improved productivity levels compared with prior
  year

• Stable raw material and input costs

                                                               Following major investments, two new plants in
                                                               operation throughout 2017:
                                                               • Nantong, China: performed particularly strongly, with high
                                                                 levels of productivity and efficiency, with sales matching
                                                                 output in latter part of the year.
                                                               • South Carolina, USA: making progress with specialist snack
                                                                 stick casing, actual output lower than anticipated, priority for
                                                                 management in 2018 as further progress will release more
                                                                 capacity for sales.
FULL YEAR RESULTS PRESENTATION | FOR THE YEAR ENDED 31 DECEMBER 2017

9

PETER PAGE

DEVRO 100
OUR PLAN FOR GROWTH
FULL YEAR RESULTS PRESENTATION | FOR THE YEAR ENDED 31 DECEMBER 2017

10
DEVRO’S THREE PART STRATEGY
                                       ACCELERATING DELIVERY THROUGH…

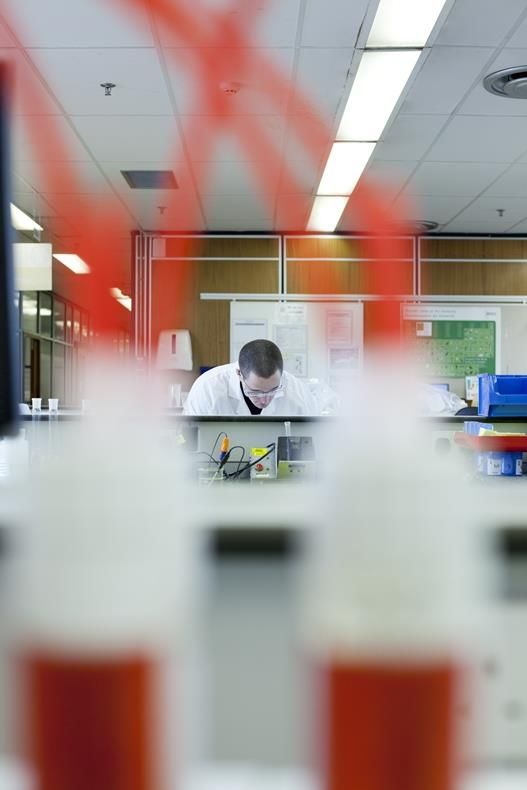
 Revenue growth                         Manufacturing efficiency                Collagen research
                                        Reduce cost                             and development
 •   Gut replacement in developed                                               Innovate & invent
     markets                            •   Maximise productivity of existing
                                            assets                              •   Differentiated products
 •   Increased demand in emerging       •   New capacity in lowest
     markets                                                                    •   Modern processes improve
                                            unit cost technology                    efficiency
 •   Pricing and value for customers    •   Reducing costs                      •   Creating new opportunities

                         Earnings growth & improving return on capital
FULL YEAR RESULTS PRESENTATION | FOR THE YEAR ENDED 31 DECEMBER 2017

11
…THE DEVRO 100 PROGRAMME

                                              Revenue growth

                                                                                                         Revenue growth
                                                 •   Focus on improved sales capabilities

                                              Next generation of differentiated

                                                                                                         Product differentiation
                                              products
                                                 •   To deliver a step change in product attributes
                                                     and performance

                                              Improving manufacturing efficiency

                                                                                                         Unit cost reduction
                                                 •   Using single global supply chain organisation to:
                                                        − Maximise productivity of existing assets
                                                        − Reduce unit cost
FULL YEAR RESULTS PRESENTATION | FOR THE YEAR ENDED 31 DECEMBER 2017

                             12
                             REVENUE GROWTH

                                  Actions & achievements in 2017

                                                                                                                                           Revenue growth
                                  • Volume growth of 8% for edible collagen casings
                                  • Focus on target markets and customers
                                  • Extension of sales capability training

                                                                                                                                           Product differentiation
                                  • Co-ordinated global tendering and pricing at all accounts
                                                                                 2016   2017                             69%
Year on year volume growth

                                                                                                                29%
                                                                     21%
                                     3%                     6%                   7%                5% 5%   6%
                                                                                          1% 2%

                                                                                                                                           Unit cost reduction
                               -5%                                                                                                   -3%
                                                      -8%                  -9%                                                 -8%
                                                                  -13%
                                             -25%
                                          -34%                                                                        -31%
                                North      Latin    Continental   Russia   Middle          UK &    Japan   SE Asia    China    Australia
                               America    America     Europe               East &        Ireland                                & NZ
                                                                           Africa
FULL YEAR RESULTS PRESENTATION | FOR THE YEAR ENDED 31 DECEMBER 2017

13
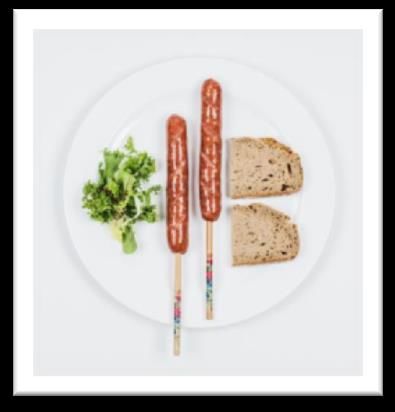
NEXT GENERATION OF DIFFERENTIATED PRODUCTS

                                                               Targeting major

                                                                                       Revenue growth
  FINE ULTRA                                                   markets for processed
  Introduced as planned in two variants in
  H2 2017, tailored to deliver unique                          sausages in Europe
  characteristics for our customers                            and Asia

                                                                                       Product differentiation
           For consumers:
           Improved pan and deep
           frying

                                                                                       Unit cost reduction
           For manufacturers:
           Increased robustness
           during filling
FULL YEAR RESULTS PRESENTATION | FOR THE YEAR ENDED 31 DECEMBER 2017

14
IMPROVING MANUFACTURING EFFICIENCY

Actions & achievements in 2017                                          2017      Total 2019

                                                                                               Revenue growth
  • New supplier contracts agreed based                                savings     benefit
                                                                                    range
     on global purchase requirements
                                                   Material costs      £1.4m     £3.5m-£4m
  • Global Best Practice teams established
     for each stage of production process          Conversion costs    £5.6m     £7.5m-£9m
  • Standardised operations blueprint              Production costs    £7.0m     £11m-£13m

                                                                                               Product differentiation
     implemented with conversion cost              Operating costs     £0.7m      £2m-£3m
     reduction following redundancies              Total costs         £7.7m     £13m - £16m
  • Energy savings through investing in
     more efficient technologies
  • Operating cost savings achieved

                                                                                               Unit cost reduction
     through standardisation and
     simplification of organisation structure
     and processes
FULL YEAR RESULTS PRESENTATION | FOR THE YEAR ENDED 31 DECEMBER 2017

15

RUTGER HELBING

FINANCIAL REVIEW
FULL YEAR RESULTS PRESENTATION | FOR THE YEAR ENDED 31 DECEMBER 2017

16
FINANCIAL SUMMARY

 Revenue                                                Profit                                                  Exceptional items
 • Increased 7% year-on-year to                         • Underlying operating profit of                        • Related to Devro 100 programme
   £256.9m                                                £38.1m; in line with prior year
                                                                 Volume gains, cost savings and
                                                                                                                • Total of £5.1m for 2017
 • Volume gains of 7% plus further                                FX, offset by full costs from
   4% from FX benefits                                            new plants & price/mix                                    Lower than expectations
 • Partially offset by -4% price/mix,                   • Reported operating profit of £33.0m,                              Expectations for total
   including increased volumes in                         increased from £15.4m in 2016                                      programme unchanged at
   China                                                                                                                     £10-12m
                                                        • Underlying EPS 12.5p (2016: 13.3p)

 Cash flow                                              Covenant ratio                                          Dividend
 • Continued strong cash                                • Key covenant ratio** improved to                      • Final dividend maintained at 6.1p
   generation, with operating cash                        2.1 times                                               per share, in line with prior year
   flow* of £61.2m
                                                                Due to increased underlying
    Improved EBITDA                                             EBITDA and lower net debt
    Lower capital expenditure
        and exceptional spend

* Shown before pension deficit funding ** Covenant ratio = net debt (including derivative liabilities) / underlying EBITDA
FULL YEAR RESULTS PRESENTATION | FOR THE YEAR ENDED 31 DECEMBER 2017

17
GROUP REVENUE

£m
                                                                       Volumes
                                                                       • Increased 7% year on year

                 +15.7       -10.4        +10.5       256.9

                                                                       Price/mix
                                                                       • Adverse by 4%
                                                                       • Country mix (e.g. China)
     241.1

                                                                       FX
                                                                       • Benefit of 4% for 2017
      2016       Volume     Price / Mix     FX         2017
FULL YEAR RESULTS PRESENTATION | FOR THE YEAR ENDED 31 DECEMBER 2017

18
REVENUE DEVELOPMENT

   Europe                                Americas                             Asia-Pacific
   (43% total revenue)                   (24% total revenue)                  (33% total revenue)

                                                                               +19%
                                 +11%                                                                      +12%
     +7%                   +5%                                  +3%                                  +4%

                -1%                                  -3%
                                           -5%                        -5%
                                                                                         -11%

     Volume    Price/Mix    FX   Total     Volume   Price/Mix    FX   Total     Volume   Price/Mix    FX    Total

   Revenue                                 Revenue                             Revenue
   • Volume – growth in all sales          • Volume – growth in North          • Volume – increase in China
     areas; particularly strong in           Amercia; offset by expected         sourced from new plant;
     Russia                                  reduction in Latin America,         significant growth in SE Asia
   • FX – sterling weaker vs euro            which had stablised by Q4         • Price/mix – mainly country
                                           • FX – sterling weaker vs US          mix from China
                                             dollar                            • FX – sterling weaker against
                                                                                 several key currencies
  Edible collagen casings only
FULL YEAR RESULTS PRESENTATION | FOR THE YEAR ENDED 31 DECEMBER 2017

19
EBIT* MOVEMENT

                                                     £m
 Volume                                                                      Volume                 Manufacturing
 • Higher sales volumes contributed
   gross margin and overheads
   recovery, offset by price/mix                                              +7.1        -7.8               +1.4 -14.8
                                                                                                   +7.0
 Cost savings
 • Result of actions taken as part of                             +6.3
   the Devro 100 programme                                                                                                       +4.2         -3.4
                                                        38.1                                                                                           38.1
 New plants
 • Remaining savings from
   replacement of old US plant, less
   remaining costs for new China plant
                                                          2016     Volume      Volume     Price/    Cost      New     Start-up      FX        Other    2017
                                                                  (margin)   (recovery)    mix     savings   plants   period in translation
                                                                                                                        2016
 Start-up period
 • Start-up period** of new plants in                  15.8%                                  EBIT margin*                                            14.8%
   2016 (when capacity not available)                                                      EBITDA margin*
   lowered costs in 2016                               24.4%                                                                                          25.0%

*Shown on underlying basis (before exceptional items) ** Incremental costs included in exceptional items
FULL YEAR RESULTS PRESENTATION | FOR THE YEAR ENDED 31 DECEMBER 2017

20
EXCEPTIONAL ITEMS

                                                                       2017                      2016
                                                                        £m                        £m
 Devro 100                                                                5.1                      2.0
 Investment projects                                                         -                    20.7
 Total exceptional items                                                  5.1                     22.7

 Devro 100                                              Investment projects
 • Final stage of six year transformation of business   • Completed in 2016
 • Major programme focussed on:                         • No further exceptional items in 2017
    Acceleration of revenue growth
    Substantial improvement in manufacturing
      efficiencies
    Introduction of next generation of
      differentiated products
FULL YEAR RESULTS PRESENTATION | FOR THE YEAR ENDED 31 DECEMBER 2017

21
EXCEPTIONAL ITEMS - DEVRO 100 GUIDANCE

                                               Cash costs                Benefits
                                 Exceptional items          Capex      Year-on-year
                                        £m                   £m             £m
       Total                         £10m-£12m              £7m-£8m    £13m-£16m

       2017 (actual)                    £5m                   £2m          £7m
       2018                           £5m-£7m               £5m-£6m     £3m-£4m
       2019                               -                    -        £3m-£5m
FULL YEAR RESULTS PRESENTATION | FOR THE YEAR ENDED 31 DECEMBER 2017

22
FINANCE COSTS*

                                           £m
 Higher loan balance
 • Relates to RMB loans to fund
   investment in China, which on                                                                 +0.2        -0.3
   average increased over 2017                                                     +0.5                               8.6
                                                                     +0.3
                                                         +1.0
 Higher interest rates
 • Also relates to RMB loans;
   interest rates increased in 2017             6.9
   vs 2016

 FX
 • Sterling weakened against key
   currencies (including USD and
   RMB)                                         2016   Higher loan    Higher    Capitalisation     FX        Other   2017
                                                        balance      interest     on major     translation
                                                          (RMB)        rates      projects
 Capitalisation                                                       (RMB)        in 2016

 • Ceased in 2016 once new plants
   started-up

* Excluding net finance cost on pensions
FULL YEAR RESULTS PRESENTATION | FOR THE YEAR ENDED 31 DECEMBER 2017

23
TAX RATE

  Effective tax rate*
 • Broadly in line with 2016
 • Reflects mix of profits in different
   tax jurisdictions across the group
 • Charge of £4.2m related to US tax                       23%         22%
   reforms reported in exceptional
   items
 • Review of internal funding
   structure helping to manage future
   impacts of US tax reforms and
   other changes

                                                           2016        2017

  * Shown on underlying basis (before exceptional items)
FULL YEAR RESULTS PRESENTATION | FOR THE YEAR ENDED 31 DECEMBER 2017

  24
  CASH FLOW 2017

   £m

        64.1        +2.8       66.9       -12.5
                                                     -5.7
                                                                48.7        -3.0       -8.3
                                                                                                  -11.9       +7.9       -14.7
                                                                                                                                     18.7

        EBITDA*    Working Operating      Capex      Cash     Operating    Pension     Interest     Tax        FX &     Dividends Movement
                    capital cash flow**           exceptional cash flow     deficit                            other               net debt
                    & other                          items      after      funding
                  movements*                                   capex

2016:    58.8        +5.6       64.4      -24.0      -22.9       17.5        -2.5       -7.7        -5.8      -14.9          -14.7   -28.1

    Operating cash flow after capex                                          Movement net debt
    • Strong growth due to improved EBITDA, and lower                        • Dividend maintained
      capex and exceptional spend                                            • Strengthening of sterling reduced net debt by £7m
                                                                             • Higher tax payments related to increased tax rate in
                                                                               2016

    * Shown on underlying basis (before exceptional items) ** Shown on underlying basis and before pension deficit funding
FULL YEAR RESULTS PRESENTATION | FOR THE YEAR ENDED 31 DECEMBER 2017

25
NET DEBT AND KEY BANKING COVENANTS

                                                         Dec 2017                     Jun 2017                  Dec 2016                     Current
                                                              £m                           £m                        £m                    covenant
 Net debt                                                         134.9                      151.9                       153.6

 Net debt** / EBITDA* ratio                                        2.1x                        2.4x                       2.7x                   4x

   * Shown on underlying basis (before exceptional items) ** Includes derivative liabilities of £0.4m (Jun 2017: £0.2m; Dec 2016: £2.6m)
FULL YEAR RESULTS PRESENTATION | FOR THE YEAR ENDED 31 DECEMBER 2017

26
PENSIONS

                                                                           Dec 2017         Dec 2016
 Net pension deficit                                                            £m               £m
 • Triennial valuation of UK
   scheme completed with no           Net pension deficit                            82.0              96.0
   increase in deficit funding
   contributions
    Shortened recovery plan
 • Reduced net deficit primaily due    UK discount rate                US discount rate
   to updated mortality
   assumptions for UK scheme                                              3.85%
 • Partially offset by reduced
   discount rates in UK and US                                                              3.40%

                                            2.60%
                                                            2.45%

                                            Dec 2016        Dec 2017      Dec 2016          Dec 2017
FULL YEAR RESULTS PRESENTATION | FOR THE YEAR ENDED 31 DECEMBER 2017

27
THE OUTLOOK

 • Global demand growth projections 2-4% pa

 • Devro 100 programme underpins the 3-part strategy
      • Improved sales capability
      • Next generation of differentiated products
      • Unit cost reduction savings of £13m-£16m

 • Devro has a modern asset base
      • With capacity to support growth

 • Targeting year-on-year growth with attractive financial returns
FULL YEAR RESULTS PRESENTATION | FOR THE YEAR ENDED 31 DECEMBER 2017

28

APPENDICES
FULL YEAR RESULTS PRESENTATION | FOR THE YEAR ENDED 31 DECEMBER 2017

29
INCOME STATEMENT

                                                       Underlying*                                              Statutory
                                                  2017      2016                   Change             2017          2016       Change
                                                   £m         £m                                       £m             £m
Revenue                                            256.9              241.1                +7%         256.9           241.1      +7%
EBITDA                                              64.1                58.8               +9%
EBIT                                                38.1                38.1                    -       33.0            15.4     +114%
Finance costs**                                     (8.6)              (6.9)             +25%           (8.6)          (6.9)     +25%
Tax charge                                          (5.8)              (6.7)              -13%          (6.0)          (4.0)     +50%
Profit after tax                                    20.9                22.2                -6%         15.6             2.2     +609%
EPS                                                12.5p              13.3p               -0.8p         9.3p            1.3p     +8.0p

 Depreciation & amortisation                                                       EPS (year-on-year change)
 • Underlying depreciation & amortisation increased                                • EBIT* per share             -
   £5.3m year-on-year, reflecting start up on new plants in                        • Finance cost per share  -1.0p
   2016                                                                            • Tax* per share           0.2p
                                                                                                            --------
                                                                                   • EPS*                    -0.8p

  * Underlying figures are stated before exceptional items ** Excludes net finance cost on pensions
FULL YEAR RESULTS PRESENTATION | FOR THE YEAR ENDED 31 DECEMBER 2017

30
KEY FINANCIAL INDICATORS

          EBITDA* (£m)                                                              Earnings per share* (pence)
                                                                             64.1
                                             60.6                     58.8
                                   56.4 58.4                                                                 19.9 19.4 20.8
                            49.0                        47.7 49.7                                    16.6
                                                                                                                                             15.4
                     38.5                                                                                                            13.7            13.3 12.5
             31.8                                                                            11.4

                                                                                      7.4

             2008 2009 2010 2011 2012 2013 2014 2015 2016 2017                       2008    2009    2010    2011    2012    2013    2014    2015    2016    2017

          Operating cash flow** (£m)                                                Dividends per share (pence)

                                                                                                                              8.5     8.8     8.8     8.8     8.8
                                                                      64.4 66.9                                       8.0
                                                                                                              7.0
                                          53.1          52.1 53.1
                            47.5 49.7            48.4
                     43.6
                                                                                                      5.0
             34.1                                                                     4.5     4.5

              2008   2009   2010   2011   2012   2013   2014   2015   2016   2017     2008    2009    2010    2011    2012    2013    2014    2015    2016    2017

 * All figures relate to continuing operations and are shown on underlying basis (before exceptional items). Figures for 2007 to 2012
   have been restated for revised pension accounting rules (IAS19R) ** Shown on an underlying basis and before pension deficit funding
FULL YEAR RESULTS PRESENTATION | FOR THE YEAR ENDED 31 DECEMBER 2017

31

                                              Contact
                                     investorrelations@devro.com
                                           www.devro.com
                                           +44 20 3865 7637
You can also read