RESULTS PRESENTATION HALF YEAR RESULTS - Coca-Cola HBC
←
→
Page content transcription
If your browser does not render page correctly, please read the page content below
RESULTS
PRESENTATION
    HALF YEAR RESULTS
    5 AUGUST 2020

1    HALF YEAR RESULTS AUGUST 2020
FORWARD-LOOKING
    STATEMENT
Unless otherwise indicated, the condensed consolidated interim financial statements and the financial and operating data or other information
included herein relate to Coca-Cola HBC AG and its subsidiaries (“Coca-Cola HBC” or the “Company” or “we” or the “Group”).

This document contains forward looking statements that involve risks and uncertainties. These statements may generally, but not always, be
identified by the use of words such as “believe”, “outlook”, “guidance”, “intend”, “expect”, “anticipate”, “plan”, “target” and similar expressions to
identify forward looking statements. All statements other than statements of historical facts, including, among others, statements regarding our
future financial position and results, our outlook for 2020 and future years, business strategy and the effects of the global economic slowdown, the
impact of the sovereign debt crisis, currency volatility, our recent acquisitions, and restructuring initiatives on our business and financial condition,
our future dealings with The Coca-Cola Company, budgets, projected levels of consumption and production, projected raw material and other costs,
estimates of capital expenditure, free cash flow, effective tax rates and plans and objectives of management for future operations, are forward
looking statements. By their nature, forward looking statements involve risk and uncertainty because they reflect our current expectations and
assumptions as to future events and circumstances that may not prove accurate. Our actual results and events could differ materially from those
anticipated in the forward-looking statements for many reasons, including the risks described in the 2019 Integrated Annual Report for Coca-Cola
HBC AG and its subsidiaries.

Although we believe that, as of the date of this document, the expectations reflected in the forward-looking statements are reasonable, we cannot
assure you that our future results, level of activity, performance or achievements will meet these expectations. Moreover, neither we, nor our
directors, employees, advisors nor any other person assumes responsibility for the accuracy and completeness of the forward-looking statements.
After the date of the condensed consolidated interim financial statements included in this document, unless we are required by law or the rules of
the UK Financial Conduct Authority to update these forward looking statements, we will not necessarily update any of these forward looking
statements to conform them either to actual results or to changes in our expectations.

2   HALF YEAR RESULTS AUGUST 2020
OPERATIONAL
REVIEW & STRATEGY

    ZORAN BOGDANOVIC
    CHIEF EXECUTIVE OFFICER

3    HALF YEAR RESULTS AUGUST 2020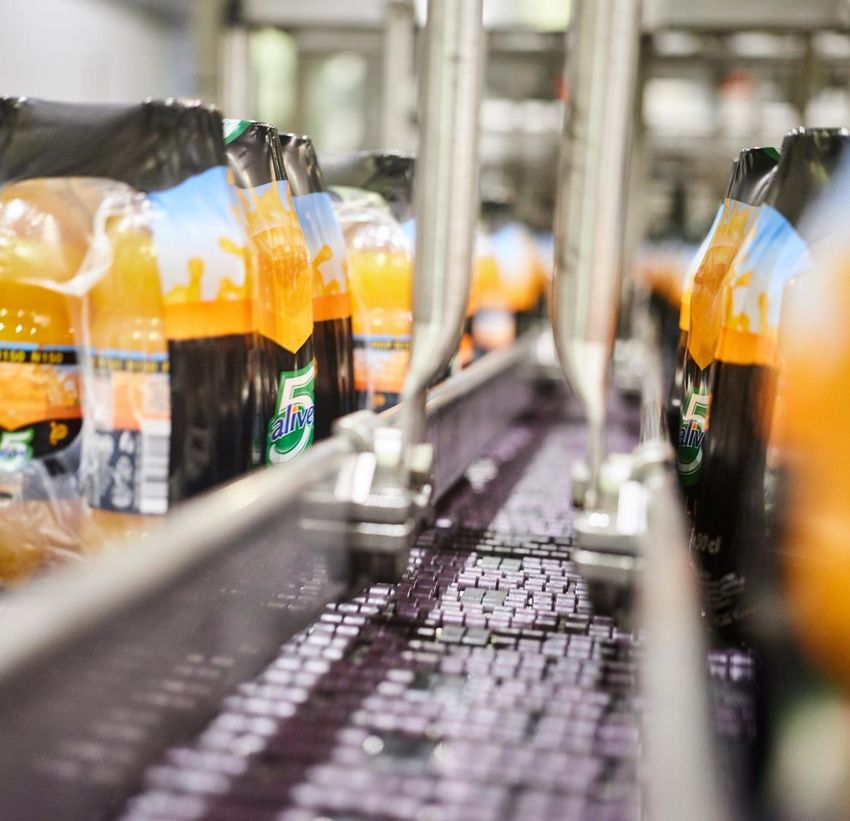
SAFETY, RESILIENCE,
    AGILITY
    The SAFETY of our people, customers, partners and
    communities is our FIRST PRIORITY

    Demonstrable business RESILIENCE during the crisis

    AGILITY as we prepare for future opportunities

                  COMING FROM A STRONG POSITION

               Leading             Excellent       Relevant
               product             customer      capabilities -
               portfolio         relationships    RGM & RTM

                                                    A high
               Unique              A strong
                                                 performance
             partnerships        balance sheet
                                                   culture

4    HALF YEAR RESULTS AUGUST 2020
ENCOURAGING SIGNS AS
    MARKETS REOPEN
    3 distinct periods
    1. Pre-COVID (up to early March)
    2. Lockdowns (mid March to end of April)
    3. Easing of restrictions

    Timing of countries going through these phases, as
    well as exposure to the out-of-home channel, has a
    significant impact on their performance
    GROUP FX-n REVENUE

         +4%         -8%       -36% -23% -18%      -5%

    JAN-FEB MARCH            APRIL   MAY   JUNE   JULY

5    HALF YEAR RESULTS AUGUST 2020
OUT-OF-HOME LEADING THE
    RECOVERY
       OUT-OF-HOME CHANNEL VOLUME YoY*
                                                                                               Open like ever before image
                                                                                               from Laura on Friday morning
           70-90%                               25-50%                              10-40%
            declines                             declines                           declines

              APRIL                       MAY AND JUNE                               JULY

       AT-HOME CHANNEL VOLUME YoY

             Low-                                                                    MSD
             teens                                  LSD
                                                 declines                           growth
            declines

              APRIL                       MAY AND JUNE                               JULY
    *The out-of-home channel typically accounts for slightly over 40% of revenues

6     HALF YEAR RESULTS AUGUST 2020
SPARKLING
    RESILIENCE                                                                                H1 2020 Volume movements YoY

    • Notable resilience in the sparkling category is                                      -9.2%         -4.5%       -3.9%
      consistent in all segments
    • Low- and no-sugar variants continue to lead                                        H1 2020 TOTAL   SPARKLING   TRADEMARK
                                                                                                                     COCA-COLA
    • Stills portfolio is over-indexed to the out-of-home
    • We are gaining or maintaining share in the majority                                  -2.4%          -6.6%       +6.7%
      of our markets in BOTH Sparkling and overall
      non-alcoholic ready to drink (NARTD)
                                                                                            COCA-          ADULT      ENERGY
                                                                                            COLA         SPARKLING
                                                                                            ZERO

                                                                                          -23.7%         -12.3%      -28.1%

                                                                                            WATER          JUICE*       TEA

*Juice volumes adjusted for accounting change on Russian Juice business. Including the
accounting adjustment Juice volumes declined by 25.4%

7    HALF YEAR RESULTS AUGUST 2020
SINGLE SERVE MIX RECOVERING
    FROM APRIL LOWS
    2015-2019:
    Single-serve mix grew by over 1pp per year
    H1 2020
    Single-serve mix down by 3.7pp

      SINGLE-SERVE MIX

          Low-                    MSD to
          teens                                       LSD
                                   HSD               decline
         declines                  decline

           APRIL              MAY AND JUNE           JULY

    Movement YoY in SS volume as % of Total Volume

8    HALF YEAR RESULTS AUGUST 2020
ESTABLISHED MARKETS

      -19.0%                          -2.6%                   -21.1%

        VOLUME                       PRICE/MIX                FX-NEUTRAL
                                                               REVENUE

                                                                                       ESTABLISHED MARKETS

      -15.8%                        -13.6%                     -6.5
                                                               -0.4%%      -16.1%
                                                                                       • Majority locked down early and
                                                                                         severely, eased cautiously
      SPARKLING                    TRADEMARK                  LOW- AND       ADULT     • Highest exposure to out-of-home
                                   COCA-COLA                  NO-SUGAR     SPARKLING
                                                                                       • Price/mix decline driven by lower
                                                                                         volumes of higher priced single-
                                                                                         serve package formats sold in
                                                                                         lockdown

All figures refer to half-year 2020 compared to prior-year,
unless otherwise stated

  9    HALF YEAR RESULTS AUGUST 2020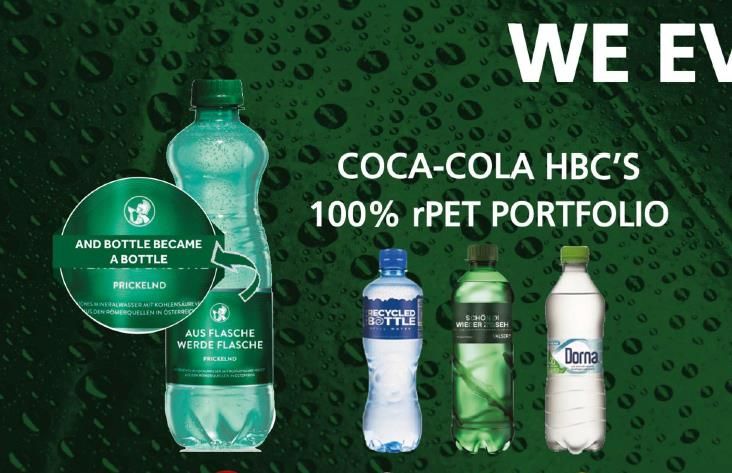
DEVELOPING MARKETS

        -8.9%                         -8.2%                   -16.4%

        VOLUME                       PRICE/MIX                FX-NEUTRAL
                                                               REVENUE

                                                                                       DEVELOPING MARKETS

       -3.4%                          -1.4%                    +5.1
                                                               -0.4%%      -2.3%       • Generally shorter, sharper
                                                                                         lockdowns and faster easing
                                                                                       • Lower exposure to out-of-home
     SPARKLING                     TRADEMARK                  LOW- AND       ADULT
                                   COCA-COLA                  NO-SUGAR     SPARKLING   • Price/mix also impacted by strategic
                                                                                         decision taken prior to crisis to have
                                                                                         less revenue growth from pricing in
                                                                                         2020 after several years of strong
                                                                                         performance on this metric
All figures refer to half-year 2020 compared to prior-year,
unless otherwise stated

  10 HALF YEAR RESULTS AUGUST 2020
EMERGING MARKETS
-4.1% -4.5% -8.4%
VOLUME PRICE/MIX FX-NEUTRAL
REVENUE
EMERGING MARKETS
+0.7% +1.2% -3.8
-0.4%% -6.4% • Varied impacts
• Nigeria resilient, growing in H1 and
stable in Q2
SPARKLING TRADEMARK LOW- AND ADULT
COCA-COLA NO-SUGAR SPARKLING • Russia and Ukraine have low
exposure to out-of-home
• Rest of the markets experience
similar to Developing segment
• Price/mix impacted by COVID and
All figures refer to half-year 2020 compared to prior-year,
unless otherwise stated Nigeria price adjustment in 2019
11 HALF YEAR RESULTS AUGUST 2020COSTA
LAUNCHED IN SIX MARKETS WITH
MORE TO COME
BULGARIA POLAND ROMANIA
SLOVENIA GREECE HUNGARY
12 HALF YEAR RESULTS AUGUST 2020ESG – MORE IMPORTANT PLASTIC-FREE CASES
AND MULTIPACKS
THAN EVER
2025
FY ’19
KPI target
Consumer packaging to be recyclable (%) 99.9 100
Recycled PET used within total PET(%) 12 35
Primary packaging collected for recovery (%) 48 75
13 HALF YEAR RESULTS AUGUST 2020FINANCIAL REVIEW MICHALIS IMELLOS CHIEF FINANCIAL OFFICER 14 HALF YEAR RESULTS AUGUST 2020
IMPACT ON YOY GROWTH
                                   H1 2020         H2      FY 2020
                                    Actual    Estimate    Estimate    Comparability of results impacted by:
  Accounting change
  Volume (YoY pp)                     (0.8)       (2.7)       (1.8)   1. Accounting change
  NSR/uc (YoY pp)                        -           -           -    • From early May the accounting treatment of our
                                                                        Russian Juice business changed
  Revenue (YoY pp)                    (0.8)       (2.8)       (1.8)
  EBIT (€m)                             (1)         +4          +3    • Impact: We no longer recognise the Russian
                                                                        Juice business’ financials in our P&L except for
  Bambi consolidation                                                   our share of its net profit as ‘share of results of
  Volume (YoY pp)                     +1.3           -        +0.7      integral joint ventures’, which is included in our
                                                                        comparable EBIT
  NSR/uc (YoY pp)                        -           -           -
  Revenue (YoY pp)                    +1.3           -        +0.7
  EBIT (€m)                           +13            -        +13     2. Bambi acquisition
  Total
                                                                      • From July 2020 we are cycling the full
  Volume (YoY pp)                     +0.5        (2.7)       (1.1)     consolidation of Bambi in our results
  NSR/uc (YoY pp)                        -           -           -    • Impact: Bambi becomes part of our ‘organic’
  Revenue (YoY pp)                    +0.5        (2.8)       (1.1)     business results
  EBIT (€m)                           +12           +4        +16

15 HALF YEAR RESULTS AUGUST 2020
FINANCIAL PERFORMANCE
REVENUES RECOVERING
• FX-neutral revenues fell 14.7%, or 15.1%
Adjusted for
excluding Bambi & accounting changes * Like for
As the
like
• Price/mix decline largely driven by weaker reported accounting
organic
package and channel mix impacted by change
lockdowns in the out-of-home channel
Volume (m u.c.) -9.2% -8.4% -9.7%
• Sequential improvement in volume and
price/mix during Q2 Net sales revenue (€m) -15.5% -14.7% -16.0%
*Technical impacts: FX-neutral net sales revenue
-14.7% -13.9% -15.1%
(€m)
• Bambi benefited FX-neutral revenue and volume growth by
130bps YoY FX-neutral NSR per case (€) -6.1% -6.0% -6.0%
• Accounting changes negatively impacted FX-neutral
revenue and volume growth by 80bps
Financial indicators on a comparable basis exclude the recognition of restructuring costs, unrealised commodity hedging results
• Net impact was 50bps positive on YoY reported growth and non-recurring items.
Certain differences in calculations are due to rounding.
16 HALF YEAR RESULTS AUGUST 2020COST CONTROL SUPPORTS MARGINS
• Flat YoY gross margin H1 2020 H1 2019 change
− Strong variable COGS base and cost
control; Comparable gross profit margin 37.2% 37.2% 0bps
− Favourable input costs;
Comparable operating expenses (€m) 850.0 922.0 -7.8 %
− Effective FX and commodity hedging;
− Reclassification of raw materials Comparable OPEX as % of NSR 30.0% 27.5% 250bps
credit settlements YoY (+0.8pp), with
no impact on absolute Gross Profit or
EBIT
• OPEX as a % of revenue deteriorated due
to volume and price/mix deleverage,
reflecting the fixed portion of OPEX, despite
absolute OPEX decline of 7.8%
• Marketing costs cut by over 40% YoY in Q2
17 HALF YEAR RESULTS AUGUST 2020EBIT AND CASHFLOW
Comparable EBIT margins fell by H1 2020 H1 2019 change
230bps to 7.4% Comparable EBIT (€m) 208.8 325.1 -35.8%
• Revenue deleverage (mainly driven by volume Comparable EBIT margin 7.4 9.7% -230bps
and pack mix weakness) led to EBIT margin
Comparable net profit (€m) 129.0 222.8 -42.1%
decline
Comparable EPS (€) 0.355 0.612 -42.0%
Free cash outflow of €38.5m
H1 2020 H1 2019 change
• Lower operational profitability EBITDA (€m) 399.8 479.4 -16.6%
• Lower activity drove lower payables, Working capital change (€m) -194.2 -129.5 64.7
significantly outstripping benefits from lower Net capital expenditure (€m) -176.3 -195.7 -9.9%
receivables and inventories
Free cash flow (€m) -38.5 79.3
• Capex deferrals in line with plans Financial indicators on a comparable basis exclude the recognition of restructuring costs,unrealised commodity hedging results
and non-recurring items.
Working capital days improving YoY Certain differences in calculations are due to rounding.
18 HALF YEAR RESULTS AUGUST 2020EMERGING SEGMENT MORE RESILIENT
REVENUE CHANGE COMPARABLE EBIT MARGIN
H1 2020 vs H1 2020 vs
• Volume and pack/channel mix
H1 2019 H1 2019 declines most pronounced in
Total CCH Total CCH Established and Developing
Volume -9.2% EBIT margin 7.4% markets, impacting margins
FXN-NSR per case -6.1% EBIT margin expansion -230bps more adversely
FXN-NSR -14.7%
Established markets
Established markets
EBIT margin 5.0%
• Emerging markets more
Volume -19.0% resilient, with margins
EBIT margin expansion -410bps
FXN-NSR per case -2.6% benefitting by +240bps from
Developing markets
Developing markets YoY reclassification of input
EBIT margin 3.7%
Volume -8.9% cost settlements, Bambi
EBIT margin expansion -480bps
FXN-NSR per case -8.2% consolidation and accounting
Emerging markets Emerging markets changes
Volume -4.1% EBIT margin 10.6%
FXN-NSR per case -4.5% EBIT margin expansion -10bps
19 HALF YEAR RESULTS AUGUST 2020STRONG BALANCE SHEET
• Net cash position at end of July (after dividend paid): €1.0b
− €700 m unutilised commercial paper facility
− €800 m unutilised revolving credit facility
− 2020 bond maturity paid
− Ordinary dividend of €0.62 paid
− No financial covenants that can impact liquidity or
access to capital
• Next bond maturity November 2024
• Gearing of 1.8x* at June-end, well within targeted range
of 1.5-2.0x
* Based on the Net Debt at 26/06/2020 and last 12 months Comp. EBITDA
20 HALF YEAR RESULTS AUGUST 2020Q&A For further information on Coca-Cola Hellenic please visit our website at: www.coca-colahellenic.com Or contact our investor relations team: Joanna Kennedy – Investor Relations Director Joanna.Kennedy@cchellenic.com +44 (0)7802 427505 Carla Fabiano – Investor Relations Manager Carla.Fabiano@cchellenic.com +44 (0) 7808 215245 Vasso Aliferi – Investor Relations Manager Vasso.Aliferi@cchellenic.com +41 79 610 7881 21 HALF YEAR RESULTS AUGUST 2020
STRONG INVESTMENT PROPOSITION

 A leading bottler                              World’s best-                           Diverse
  and strategic                                  selling non-                        geographic
  partner of The
    Coca-Cola                                     alcoholic                         footprint with
 Company with a                                beverage brands                        favourable
 60+ year history                                in portfolio                       demographics

                                                                                                      Ranked among
                                                                  Committed to
                          Strong balance                                                                  the top
                                                                 generating value
                         sheet and liquidity                                                           performers in
                                                                 for shareholders
                                                                                                     ESGbenchmarks

22 HALF YEAR RESULTS AUGUST 2020
You can also read