Half year results For the six months ended 30 June 2019 - 30 JULY 2019 - Aggreko plc
←
→
Page content transcription
If your browser does not render page correctly, please read the page content below
30 JULY 2019

Half year results
For the six months ended
30 June 2019
                           Results presentation July 2019   1
Introduction
Chris Weston
CEO
               Results presentation July 2019   2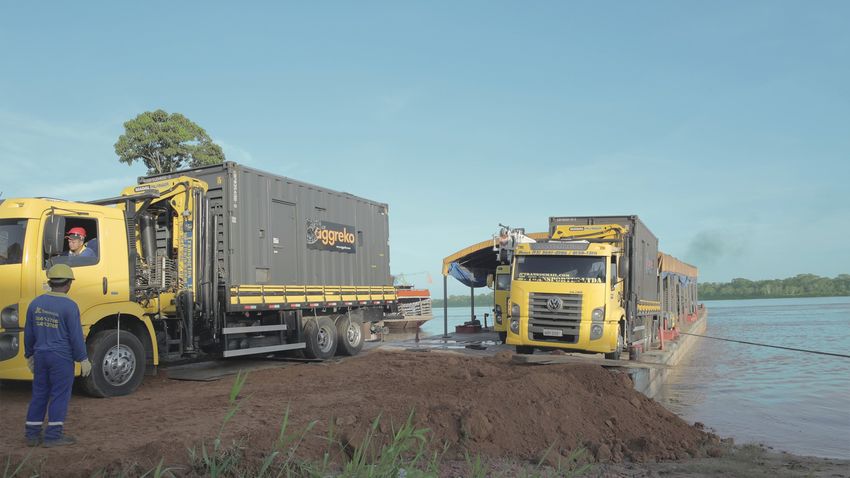
Headlines
On target to deliver mid-teens ROCE in 2020
Group revenue down 4%, reflecting Winter Olympics in the prior year
Improved profitability resulted in PBT up 9%
Continued discipline on capex and working capital
ROCE up 0.6pp
Interim dividend maintained
Continue to adapt to customer needs as energy markets evolve
Successful launch and mobilisation of the Y.Cube
Significant pipeline for hybrid thermal-solar opportunities
Results presentation July 2019 3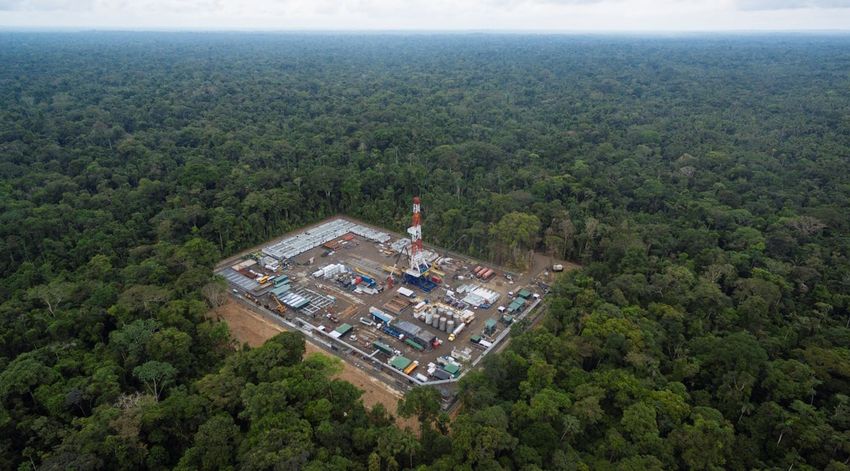
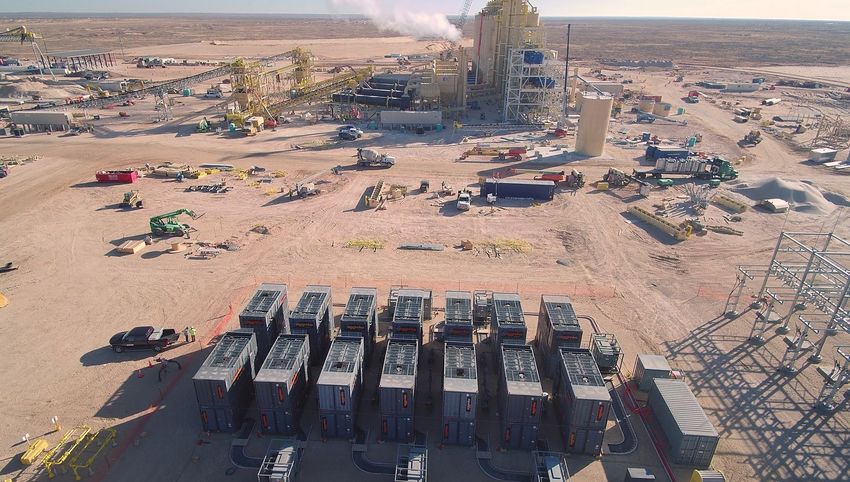
Rental
Solutions

REVENUE
(% OF GROUP excl. pass-through fuel)

53%
UTILISATION
at 30 June (MW)

1H19          56%                      Operating margin   Completed          Adapting to
                                       improvement        systems rollout    changing markets
1H18              61%
                                       Strong             Enabling           Mobilising Y.Cube for
                                       performance in     improvements in    our hybrid project at
                                       NAM driven by      efficiency and     Granny Smith mine,
                                       sector focus       customer service   Australia

                                                                             Results presentation July 2019   4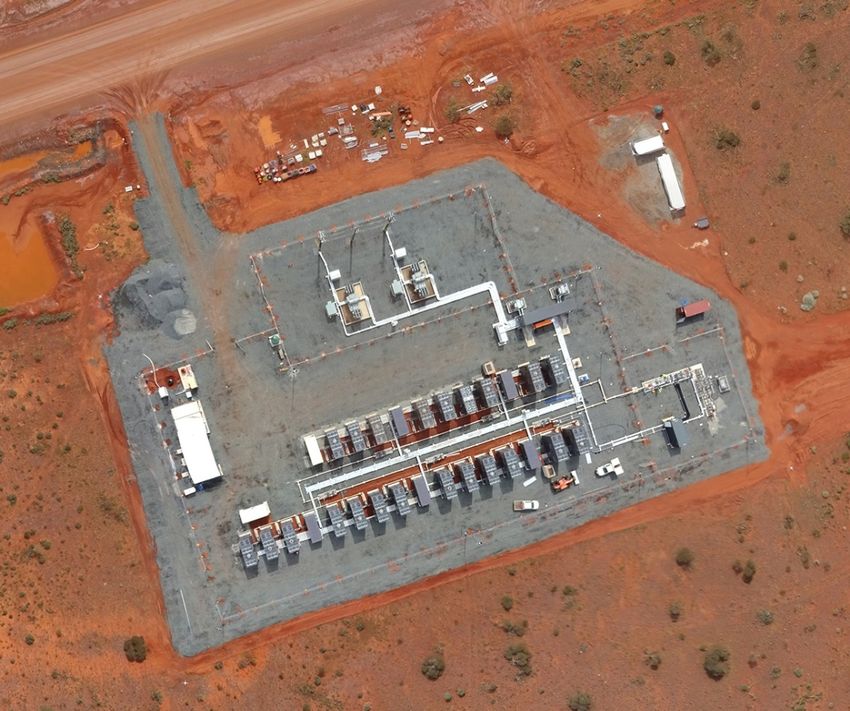
Power Solutions
Industrial

REVENUE
(% OF GROUP excl. pass-through fuel)

27%
UTILISATION
at 30 June (MW)

1H19              68%                  Revenue growth      Diversifying         Utilising
                                       of 4%, excl. 2018   in Eurasia           landfill gas
1H18              70%
                                       Winter Olympics     35% of new order     Signed our first
                                       Driven by LAM,      in-take related to   NGG projects
                                       Africa and Middle   manufacturing        using landfill gas
                                       East offset by      sector               to deliver cheaper,
                                       Eurasia                                  cleaner power
                                                                                Results presentation July 2019   5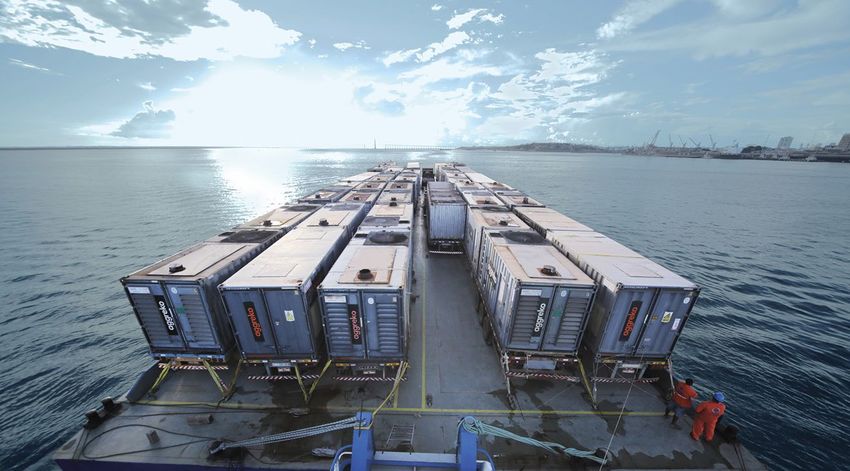
Power Solutions
Utility

REVENUE
(% OF GROUP excl. pass-through fuel)

20%
UTILISATION
at 30 June (MW)

1H19              66%                  Operating margin      Cash collections       Amazonas (Brazil)
                                       improvement           Good progress in       First sites now live
1H18              65%
                                       Increased cost        the period,            on this 15-year
                                       discipline            especially in Africa   project, across 26
                                       delivering benefits                          locations

                                                                                    Results presentation July 2019   6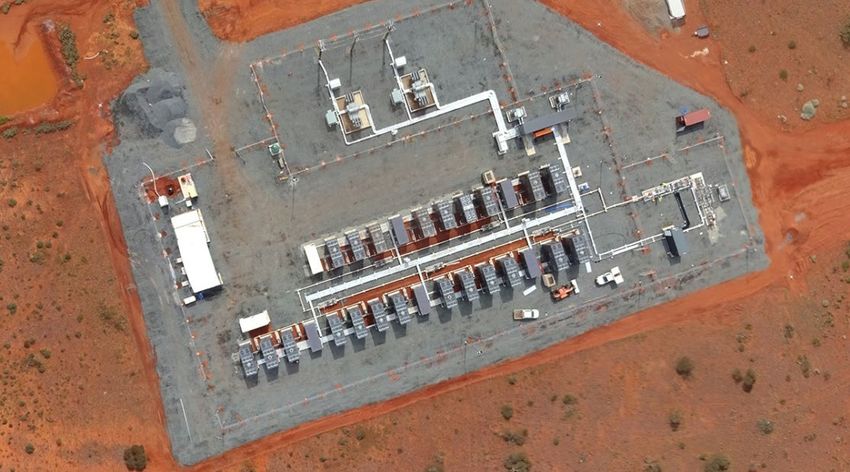
Continuing to adapt to customer needs

Launch of Y.Cube, our mobile and modular storage system

                              Mobile and modular                     Easy integration
                            Single units can be easily        Fits perfectly with our thermal
                         combined to deliver the power       power systems for an optimised
                          and energy capacity required                hybrid solution

     Key benefits
                               Quick set-up on site                 Fast deployment
                          All-in-one and ready-to-install      Up and running in less than 3
                             storage system reducing          months after contract signature
                          footprint and installation costs

                                                                               Results presentation July 2019   7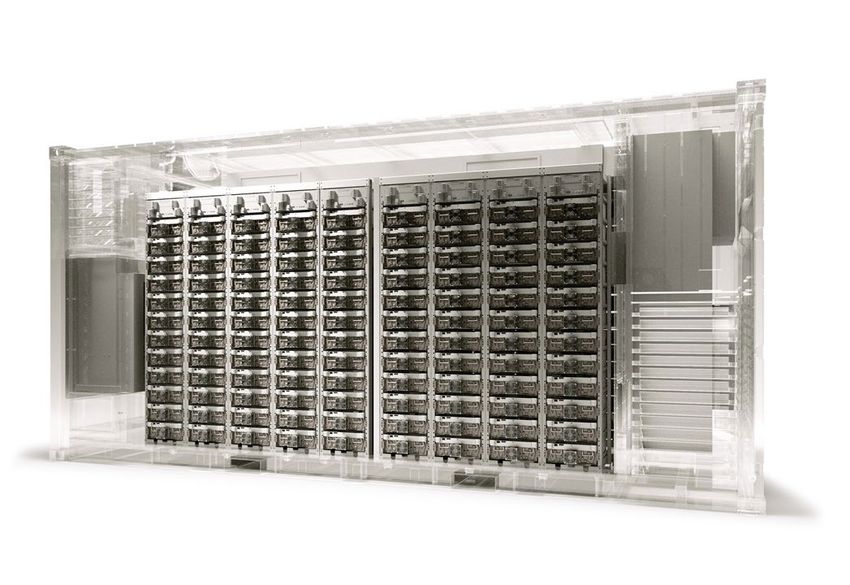
Continuing to adapt to customer needs

We are already seeing considerable interest from
various sectors for a range of applications

                                                            Typical applications                                                                                      Application case study

                                                R EP LAC E SPINNING R ESER VE                                  CONTROL PV PRODUCTION RAMPS
                                                                    100%

                                                                                                                             ACTUAL PV PRODUCTION
                     GENE RATOR E FF ICI ENCY

  Spinning reserve                                          WITH Y.CUBE               Ramp rate control
   displacement                                                                                                                           STEADY FEED-IN WITHY.CUBE

                                                           WITHOUT Y.CUBE

                     REDUCE DEMAND AND SHIFT ENERGY                                                           PROVIDE POWER TO C R ITIC AL LOADS

                                                                                                                            GRID OUTAGE

                                                                                                                                GRID SUPPLY

   Peak shaving                                                                      Uninterrupted power
                                                                                    supply (UPS) / Bridging
                                                                                            power               UPS

                                                        NOON         EVENING PEAK

                                                                                                                                                                       Granny Smith goldmine (Australia):
                                                                                                                                                                       Setting the standard for hybrid
                                                                                                                                                                       microgrids

                                                                                                                                                                                     Results presentation July 2019   8
1H19 results review
Heath Drewett
CFO
                      Results presentation July 2019   9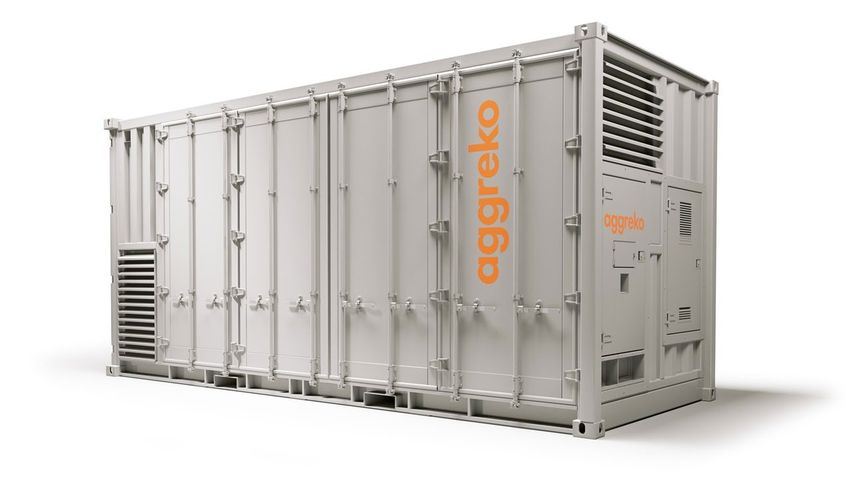
Group summary
Movement
CHANGE
excluding
pass-through
fuel and Revenue down 4%
£m 1H19 1H18 CHANGE currency
Revenue 768 857 (10)% (4)% Good underlying profit growth
Operating profit 81 76 6% 12%
Operating margin of 10.5%, up
Operating margin 10.5% 8.9% 1.6pp 1.5pp
1.5pp on an underlying basis
Net interest expense (21) (17) (21)%
Profit before tax 60 59 2% 9% Effective tax rate of 35%
Taxation (21) (18) (14)%
ROCE of 10.2%, up 0.6pp on an
Profit after tax 39 41 (3)%
underlying basis
Diluted earnings per share 15.33 15.85 (3)% 4%
Dividend per share 9.38 9.38 -
ROCE 10.2% 10.5% (0.3)pp 0.6pp
Results presentation July 2019 10Improving cash flow
£m 1H19 1H18
EBITDA 247 224
Working capital (16) (47) Working capital movement
Cash flows relating to fulfilment assets/demob provisions (30) (21) £m 1H19 1H18
Other 9 4 Trade and other receivables 34 7
Operating cash flow 210 160 Trade and other payables (48) (50)
Tax (30) (33) Inventory (2) (4)
Net interest (22) (18) Working capital (16) (47)
Acquisitions and investments - (33)
Purchase of fixed assets (99) (95) Mobilisation spend primarily related to the
Other fixed asset movements 5 - 2020 Tokyo Olympics , PIE A contract in
Lease payments (related to IFRS 16) (14) - Brazil and Burkina Faso
Free cash flow 50 (19) Reduced fleet capex of £83m including
Dividends (45) (45) £15m related to 2020 Tokyo Olympics
Changes in equity - (7) (2018: £87m)
Net cash flow 5 (71)
Increased free cash flow of £50m
Exchange (1) (18)
(2018: £(19)m)
Movement in lease liability (102) -
Movement in net debt (98) (89) Net debt/EBITDA (incl. IFRS 16 leases) 1.5x
Net debt (784) (741) Results presentation July 2019 11Net working capital change
£61m
1H19 FY18
Overall working Increase in inventory £(2)m
capital outflow Slight increase in materials, reflecting timing of in-house
of £16m build programme
(2018: £47m outflow)
Decrease in trade and other receivables £34m
Strong cash collection in Power Solution Utility
Reduced level of unbilled within Rental Solutions
Decrease in trade and other payables £(48)m
Reflecting a reduction in fuel consumption on contracts in
Brazil
Results presentation July 2019 12Trade receivables
Stable performance overall, with a reduction in PSU
GROUP TRADE RECEIVABLES (£m)
600
Good progress on cash collections within
Power Solutions Utility
Particular focus during the period in
400
Rental Solutions on reducing the unbilled
backlog
200
0
FY14 FY15 FY16 FY17 1H18 FY18 1H19
RS / PSI trade receivables PSU trade receivables
Results presentation July 2019 13Utility - Invoicing / receipts performance
Good progress on collections, especially in Africa
POWER SOLUTIONS UTILITY ($m)
200
$m 1H19 2H18 1H18
160 Invoicing 244 351 362
Receipts 295 349 345
120 Net total 51 (2) (17)
80
Bad debt provision within PSU
40 broadly unchanged at $84m
(Dec 2018: $83m)
0
Q1 18 Q2 18 Q3 18 Q4 18 Q1 19 Q2 19
Invoicing Receipts
Results presentation July 2019 14Rental Solutions – Trade receivables
TRADE RECEIVABLES – INCLUDING UNBILLED ($m) First half focus on the level of
unbilled revenue built up
300 through 2H 2018
250 Decrease in unbilled revenue
somewhat offset by an increase
200
in trade receivables
150
100
50
0
1H18 FY18 Jan Feb Mar Apr May Jun
2018 2019
Trade receivables Unbilled receivables
Results presentation July 2019 15Guidance
On track to deliver PBT in line with market expectations
− Currency headwinds of c. 2% (see appendix 4)
− IFRS 16 impact of c. £(2)m PBT
− Effective tax rate of c. 35%, subject to geographic mix
Confident of achieving 2020 mid-teens ROCE target
− Full year fleet capexAggreko is a customer focused specialist provider of power,
temperature control and energy services on a global basis.
These services are based on modular and mobile equipment
operated on a digital platform with a market leading
integration capability.
Results presentation July 2019 17Appendix
Results presentation July 2019 18Appendix 1 - Rental Solutions
Movement
CHANGE
excluding
1H19 1H18 CHANGE currency
Revenue (£m) 400 386 4% 1%
Operating profit (£m) 47 40 17% 12%
Operating margin 11.8% 10.5% 1.3pp 1.1pp
ROCE (rolling 12 months) 14.3% 15.6% (1.3)pp (1.2)pp
Fleet capital expenditure (£m) 29 26
% Revenue by sector 1H19
Petrochemical & refining 20%
Building services & construction 18%
Oil & Gas 18%
Utilities 10%
Events 9%
Manufacturing 6%
Mining 6%
Other 13%
Results presentation July 2019 19Appendix 2 - Power Solutions
Power Solutions Industrial Movement Power Solutions Utility Movement
CHANGE CHANGE
excluding excluding
Excluding pass-through fuel 1H19 1H18 CHANGE currency Excluding pass-through fuel 1H19 1H18 CHANGE currency
Revenue (£m) 198 219 (9)% (9)% Revenue (£m) 150 163 (8)% (7)%
Operating profit (£m) 21 23 (8)% (4)% Operating profit (£m) 13 14 (2)% 52%
Operating margin 10.5% 10.5% - 0.6pp Operating margin 8.9% 8.3% 0.6pp 3.5pp
ROCE (rolling 12 months) 10.6% 9.7% 0.9pp 1.6pp ROCE (rolling 12 months) 6.0% 6.7% (0.7)pp 0.9pp
Fleet capital expenditure (£m) 24 27 Fleet capital expenditure (£m) 30 34
% Revenue by sector 1H19
Oil & Gas 45% This segment includes only Utility customer
Mining 15% projects
Building services & construction 12%
Manufacturing 7%
Events 6%
Utilities 5%
Petrochemical & refining 2%
Other 8%
Results presentation July 2019 20Appendix 3 – Reported to underlying revenue
Movement
£m
CHANGE
1H19 1H18 CHANGE %
Reported 768 857 (89) (10)%
Fuel (20) (89)
Excluding fuel 748 768 (20) (3)%
FX¹ 7
Underlying 748 775 (27) (4)%
¹ The currency impact line included in the table above excludes the currency impact on pass through fuel in PSU which in 2019 was £4 million
Results presentation July 2019 21Appendix 4 - FX impact into 2019
FX RATES REVENUE (£m)
FY18
Restated at
FY18 June FYF FY18 June 2019 %
average average actual FYF average Variance Variance
US Dollar 1.34 1.28 805 839 34 4%
Euro 1.13 1.13 256 256 - -
Australian Dollar 1.79 1.82 91 89 (2) (2)%
Argentinian Peso 37.48 53.90 40 28 (12) (30)%
Brazilian Real 4.87 4.91 233 231 (2) (1)%
Canadian Dollar 1.73 1.69 29 29 - -
Russian Rouble 83.70 82.19 73 75 2 2%
Other 233 230 (3) (1)%
Total revenue 1,760 1,777 17 1%
Total operating profit 219 214 (5) (2)%
Note: UAE Dirhams included within US Dollar as it is pegged to the US dollar; Argentinian Peso includes Power Solutions Utility
contracts which are pegged to the US Dollar but paid and reported in Argentinian Pesos. Results presentation July 2019 22Appendix 5 - IFRS 16: Lease accounting
Effective from 1 January 2019 with NO prior year restatement
Expected full-year impact:
Income statement
− Improvement in operating profit of c. £3m (including c. £30m additional depreciation in lieu of
operating lease rental cost)
− Increase in interest costs of c. £5m
− Reduction in PBT of c. £2m
Balance sheet
− Increase in fixed assets of c. £100m, together with a corresponding liability of c. £100m
Leverage
− Increase in Net debt / EBITDA of c. 0.2x (reflecting incremental debt, but also increased EBITDA)
Return on capital
− Reduction in the Group’s ROCE of around c. 0.3pp
Results presentation July 2019 23Appendix 6 - ROCE definition
Full year ROCE is calculated by dividing operating profit pre-exceptional items for the year by the average net operating
assets at 1 January, 30 June and 31 December. Half year ROCE calculated by taking the underlying operating profit on a
rolling 12-month basis and expressing it as a percentage of the average net operating assets at 30 June, 31 December
and the previous 30 June.
1H19 FY18 1H18 FY17
£m £m £m £m
Operating profit (pre-exceptional items, 2017
only) 2241 219 2211 224
Average net operating assets
1 January 2,074 2,124
30 June 2,123 2,123 2,071 2,071
31 December2 2,263 2,159 2,074 2,074
30 June 2,190 2,123
3-point average 2,192 2,119 2,089 2,090
ROCE3 (operating profit pre-exceptional items
divided by average net operating assets) 10.2% 10.3% 10.5% 10.7%
1 The 1H19 and 1H18 operating profit is calculated on a rolling 12-month basis.
2 For the purposes of the 1H19 calculation, the net operating assets at 31 December 2018 have been adjusted by £104m to reflect the initial right of use asset taken to the balance sheet
on transition to IFRS 16.
3 Prior year ROCE comparatives have not been adjusted for IFRS 16
Results presentation July 2019 24Disclaimer
The information contained in this presentation has largely been extracted from the results announcement for
the six months ended 30 June 2019.
This presentation may contain certain “forward-looking” statements. By their nature, forward-looking statements
involve risk and uncertainty because they relate to future events and circumstances. Actual outcomes and results
may differ materially from any outcomes or results expressed or implied by such forward-looking statements.
Any forward-looking statements made by or on behalf of Aggreko speak only as of the date they are made and
no representation or warranty is given in relation to them, including as to their completeness or accuracy or the
basis on which they were prepared.
This presentation is published solely for information purposes.
The distribution of this presentation in jurisdictions other than the UK may be restricted by law and therefore any
persons who are subject to the laws of any jurisdiction other than the UK should inform themselves about, and
observe, any applicable requirements.
All opinions expressed in this presentation are subject to change without notice and may differ from opinions
expressed elsewhere.
Results presentation July 2019 25You can also read