ZOOPLUS AG H1 2020 RESULTS - INVESTOR & ANALYST PRESENTATION August 18, 2020 - Munich - Dr. Cornelius Patt, CEO, Andreas Maueröder, CFO

Page created by Samantha Graves
 
CONTINUE READING
ZOOPLUS AG H1 2020 RESULTS - INVESTOR & ANALYST PRESENTATION August 18, 2020 - Munich - Dr. Cornelius Patt, CEO, Andreas Maueröder, CFO
ZOOPLUS AG
H1 2020 RESULTS
INVESTOR & ANALYST PRESENTATION
August 18, 2020 – Munich – Dr. Cornelius Patt, CEO, Andreas Maueröder, CFO
ZOOPLUS AG H1 2020 RESULTS - INVESTOR & ANALYST PRESENTATION August 18, 2020 - Munich - Dr. Cornelius Patt, CEO, Andreas Maueröder, CFO
SAFE HARBOR STATEMENT

This document includes supplemental financial measures that are or may be non-GAAP financial measures. These supplemental financial
measures should not be viewed in isolation as alternatives to measures of zooplus’ financial condition, results of operations or cash flows
as presented in accordance with IFRS in its Consolidated Financial Statements. Other companies that report or describe similarly titled
financial measures may calculate them differently.

This document contains statements related to our future business and financial performance and future events or developments involving
zooplus that may constitute forward-looking statements. We may also make forward-looking statements in other reports, in presentations,
in material delivered to stockholders and in press releases. In addition, our representatives may from time to time make oral forward-
looking statements. Such statements are based on the current expectations and certain assumptions of zooplus’ management, and are,
therefore, subject to certain risks and uncertainties. A variety of factors, many of which are beyond zooplus’ control, affect zooplus’
operations, performance, business strategy and results and could cause the actual results, performance or achievements of zooplus to be
materially different from any future results, performance or achievements that may be expressed or implied by such forward-looking
statements or anticipated on the basis of historical trends. Further information about risks and uncertainties affecting zooplus is included
throughout our most recent annual and interim reports, which are available on the zooplus website, investors.zooplus.com. Should one or
more of these risks or uncertainties materialize, or should underlying assumptions prove incorrect, actual results, performance or
achievements of zooplus may vary materially from those described in the relevant forward-looking statement as being expected,
anticipated, intended, planned, believed, sought, estimated or projected. zooplus neither intends, nor assumes any obligation, to update or
revise these forward-looking statements in light of developments which differ from those anticipated.

Due to rounding, numbers presented throughout this and other documents may not add up precisely to the totals provided and
percentages may not precisely reflect the absolute figures.

                                                                                                                 H1 2020 Results Presentation   2
ZOOPLUS AG H1 2020 RESULTS - INVESTOR & ANALYST PRESENTATION August 18, 2020 - Munich - Dr. Cornelius Patt, CEO, Andreas Maueröder, CFO
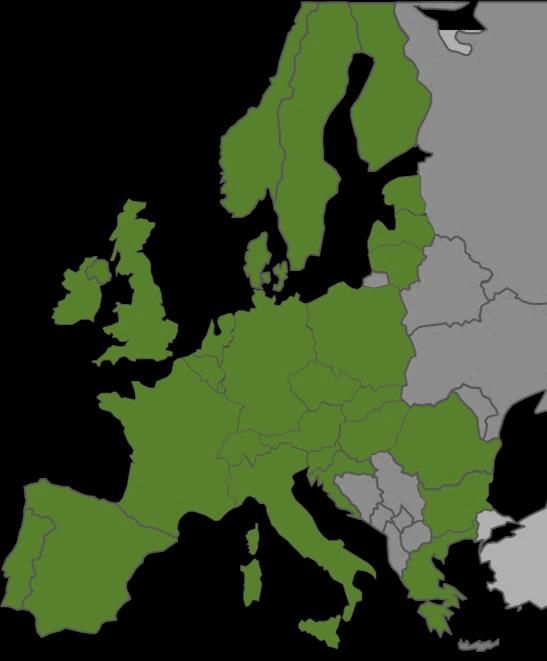
H1 2020 RESULTS
 PRESENTATION
   H1 2020 Investor & Analyst Call
ZOOPLUS AG H1 2020 RESULTS - INVESTOR & ANALYST PRESENTATION August 18, 2020 - Munich - Dr. Cornelius Patt, CEO, Andreas Maueröder, CFO
HIGHLIGHTS

             H1 2020 Results Presentation   4
KEY FINANCIAL HIGHLIGHTS – STRONG PERFORMANCE

 SALES (in EUR m)                                               EBITDA (in EUR m, in % of sales)
                                              862
                         727                          +19%
   643                                                vs. PY
                               +13%
          +24%                 vs. PY                                                               29.4
            vs. PY
                                                                                                    +3.4%
                                                                                 +0.6%
                                                                  -0.8%
                                                                                  4.5

  H1 2018            H1 2019                H1 2020
                                                                   -5.0
                                            1,765                H1 2018        H1 2019           H1 2020
                     1,524                           +16%E                                         ≥40.0
  1,342                                                vs. PY
                               +14%
          +21%                 vs. PY                                                               +2.3%E
            vs. PY
                                                                                 +0.8%
                                                                  +0.6%
                                                                                 11.8
                                                                   8.6

  FY 2018            FY 2019               FY 2020E              FY 2018        FY 2019          FY 2020E
    New Customer Sales              Existing Customer Sales
                                                                                           H1 2020 Results Presentation   5
STRATEGIC BUSINESS KPIS – ALL INDICATORS
SIGNIFICANTLY IMPROVED

                                     1)
                                                           H1 2018   H1 2019   H1 2020
                                                                                            Revenue Retention and NC
                                                                                             2nd Order Sales are the key
Revenue Retention Rate                                       94%      92%       95%          contributors to sustainable
                                                                                             top line growth
New Customer 2nd Order Sales                                +20%      -8%       +21%
                                                                                            Customer Acquisition Cost
Customer Acquisition Cost (in €)                              11       16        10
                                                                                             significantly reduced
Own Brands Share                                             14%      15%       17%
                                                                                            Own Brands Share is a key
Gross Margin (% of Sales)                                   27.7%    28.4%     30.5%         driver for Gross Margin

Basket Size (in €)                                            54       55        57         Basket size increase is
                                                                                             helpful for operational
Operational Efficiency               1) (in % of Sales)     22.0%    21.0%     20.8%         efficiency

1) Logistics costs + payment costs + customer care costs
                                                                                                    H1 2020 Results Presentation   6
TOP LINE PERFORMANCE

                       H1 2020 Results Presentation   7
SALES VOLUME INCREASED BY EUR 136 m VS. H1 2019 –
GROWTH PATH CONTINUED IN Q2 2020
SALES (in EUR m)

                                   vs. H1 2019
                                                                                               zooplus continued to benefit from
                                          +19%                                                  strong online demand and high
                                                             440             423
                                                 419                                            loyalty of existing customers
   363             363           378
                                                                                               Strong y-o-y development affirms
                                                                 +21%              +16%         successful efforts on improving
                                                                   vs. PY          vs. PY
                                                                                                customer activation and sales
      +13%            +14%          +14%          +14%                                          retention combined with solid
         vs. PY        vs. PY       vs. PY         vs. PY                                       sales execution

                                                                                               High growth of accessories sales
                                                                                                (+32% vs. Q2 2019) proves
                                                                                                success of the active steering of
                                                                                                the product sales mix meeting
                                                                                                increased customer demand in Q2
  Q1 2019         Q2 2019       Q3 2019      Q4 2019        Q1 2020         Q2 2020

                                                                                                              H1 2020 Results Presentation   8
SALES RETENTION RATE CLIMBS TO 95% IN Q2 2020 –
INVESTMENTS IN LOYALTY ARE PAYING OFF
SALES RETENTION RATE1

                                                                                       Sales Retention is a 12-months
                                                                                        trailing indicator, measuring how
                                                                 94%       95%
     93%                                                                                much of the sales with the
                          92%                          91%                              customer base acquired until 12
                                              91%
                                                                                        months ago can be retained,
                                                                                        comparing the last 12m sales to
                                                                                        the 12m before (-24m to -12m)

                                                                                       Positive development reflecting
                                                                                        successful initiatives to improve
                                                                                        loyalty and reactivation – after 6
                                                                                        months we are already up by 4%

                                                                                       95% retention rate means that the
   Q1 2019             Q2 2019              Q3 2019   Q4 2019   Q1 2020   Q2 2020       churn (lost recurring sales) is only
                                                                                        5% (over a 12m period)
1) Sales retention 12 months rolling (net, non-BMF)
                                                                                                       H1 2020 Results Presentation   9
ZOOPLUS IS THE ONLINE MARKET LEADER IN EUROPE
AND IS GAINING SHARE FROM OFFLINE
TOTAL MARKET SHARE1                                              ZOOPLUS SALES BY REGION IN H1 2020 (in EUR m)

       8%                                         DACH                                                                                           246                                            +17%

       6%                                               FR                                                    142                                                +19%

      9%                                   BENELUX                                             95                                +15%
                                                                                                                                                               Pet supplies market1
      14%2                                               PL                               80                           +25%
                                                                                                                                                       EUR 25.3 bn
       4%                                                 IT                           71                        +24%

       3%                                         UK, IE                              69                        +20%

       5%2                                            CEE                           61                    +25%
                                             other than PL

       6%                                  NORDICS                              51                  +13%

       5%                                         ES,PT                        49                   +14%
1) Total net market = online + offline market, based on Euromonitor International 2020 and management estimates as of June 2020 in relation to zooplus FY 2019 sales figures; 2) change vs . prior disclosure due
to updated market data reflecting an overall larger total market in Poland and CEE; zooplus continues to outperform total market growth in respective markets.                   H1 2020 Results Presentation       10
SALES & MARKETING PERFORMANCE

                                H1 2020 Results Presentation   11
BETTER NEW CUSTOMER QUALITY TRANSLATES
INTO SUSTAINABLE GROWTH

    Repeat purchasing                                                                                                                       Key lesson taken from 2019 – we
                                                               H1 2019                       H1 2020
           new accounts 1)                                                                                                                   need to focus on quality customers.
                                                                                                                                             Only repurchasing accounts
         Sales                                                   -8%                          +21%                                          contribute to future growth

         Accounts                                                -4%                         +14%                                          Improved early stage cohort
                                                                                                                                             behavior compared to H1 2019
         Sales per Account                                       -5%                            +6%                                         cohort reflects revised acquisition
                                                                                                                                             channel mix, unbiased customer
         Share of new                                             28%                           32%                                         value proposition and better use of
          accounts with
          repeat purchases
                           2)                                                                                                                loyalty & retention tools

                                                                                                                                            Sales volume from 2nd order on with
                                                                                                                                             strong increase – both driven by
                                                                                                                                             loyalty and basket size

1) At least one consecutive order   2) Of all new accounts, note - only limited opportunity for repurchases after 6 months into the year of acquisition
                                                                                                                                                           H1 2020 Results Presentation   12
THE CORE TASK OF STRATEGIC SALES & MARKETING IS
TO GROW A LARGE AND LOYAL CUSTOMER BASE
ACTIVE CUSTOMER BASE (in k)
                              8,062

                                                Customers with at least one order in the last 12 months
            7,195                     +12%
                                                Reduced intake of low-quality new accounts in 2020,
                                                 correcting the 2019 marketing campaign issues

           H1 2019            H1 2020

ACTIVE REPEAT CUSTOMER BASE (in k)              Customers with at least one consecutive order
                              4,781              (at least two orders in total) in the last 12 months

                                                Adjusting for one-time purchasers in the last 12
                                      +16%       months, counting only customers with inclination for
            4,117                                repurchases

                                                More suitable indicator for the company's future
                                                 topline growth
           H1 2019            H1 2020                                               H1 2020 Results Presentation   13
OUR NEW STRATEGY BALANCES
   CUSTOMER QUALITY, SCALING AND EFFICIENCY
   SPEND ON CUSTOMER ACQUISITION AND LOYALTY (AS % OF SALES)

                                                                                           Massive increase in new business
                                 5.9%
                                                                                            acquisition efficiency: budget at
                                                                                            50%, with new business at 120%
                                                                                            of PY
            Traffic                                               4.2%
         Acquisition             3.3%                                                      Tactical situation in months March,
                                                       3.8%
                                                                                            April and May helped efficiency
                                                                   1.7%
                                                                                 1.9%
  New Customer 1)                                                                          91% → 95% revenue retention
       Discount                  0.5%                              0.2%                     increase driven by quality focus
                                                                                            and better use of retention and
Repeat Customer 2)
                                 1.7%                              1.7%                     loyalty tools
        Discount                                       2.1%                      2.3%
 Loyalty Program                 0.4%                              0.6%                    Main driver for growth:
                                                                                            consistently positive customer
                         2019 / EUR 727 m                     2020 / EUR 862 m
                                                                                            experience throughout Q1 & Q2
   1) New: Starter coupons; 2) Repeat: SaverPlan discounts
                                                                                                           H1 2020 Results Presentation   14
LOYALTY PROGRAMS DRIVING CUSTOMER
RETENTION AND REPURCHASE RATE

       SaverPlan

  Best Value for Money         - €3m

       zooPoints

  Interactive Shopping Experience

     zooplus APP

  Multi-Platform Shopping Experience

                                       H1 2020 Results Presentation   15
OWN BRANDS AND GROSS MARGIN

                              H1 2020 Results Presentation   16
OWN BRANDS PORTFOLIO CONTINUES TO
OUTPERFORM TOTAL FOOD AND LITTER SALES
OWN BRAND SALES & SALES SHARE FOOD & LITTER (in EUR m)

                       vs. H1 2019
                              +32%
                                                  64          64
                                       61
                         52
  48          49
                                        16.7%       16.5%       17.9%
                                                                           High-margin business in the
                                                                            mid to premium segment
    15.3%      15.6%      15.9%                                             contributing to gross margin
                                                                            expansion

                                                                           Growth index own brands / food
                                                                            2.2 in Q2 2020 (H1 2020: 1.7)

Q1 2019     Q2 2019    Q3 2019       Q4 2019    Q1 2020     Q2 2020

                                                                                          H1 2020 Results Presentation   17
GROSS MARGIN FURTHER IMPROVED IN Q2 2020 –
STRONG INCREASE COMPARED TO PY
GROSS MARGIN1

                                                       vs. H1 2019
                                                                                                        Sustainable increase in margin in
                                                            +2.1%p
                                                                                       31.6%             food segment driven by active
                                                               30.2%     29.4%                           management of product sales
       28.2%               28.7%                28.7%
                                                                                                         mix
                                                                             +1.2%p        +2.9%p       Surge in demand for accessories
                                                                              vs. PY        vs. PY
                                                                                                         in Q2 and the continued trend
                                                                                                         towards own brand sales driving
                                                                                                         gross margin improvement

                                                                                                        Solid yield management focusing
                                                                                                         on loss leaders (avoidance)
                                                                                                         supports positive development of
                                                                                                         gross margin
      Q1 2019             Q2 2019              Q3 2019         Q4 2019   Q1 2020       Q2 2020

1) Gross margin = sales – cost of goods (as a % of sales)
                                                                                                                       H1 2020 Results Presentation   18
OPERATIONAL EFFICIENCY & FINANCIAL PERFORMANCE

                                                 H1 2020 Results Presentation   19
STRONG INCREASE OF BASKET VALUE –
DRIVER FOR LOGISTICS EFFICIENCY
AVERAGE BASKET VALUE (NON-BMF; in EUR)

                                                                         Successful upselling measures
                                                                          and incentives drive basket value
                                                         57.2             in H1 2020. Accessories sales
                                                                          make a helpful contribution
                                                            +2.4 €
                                                             vs. PY
                                                                         Bigger baskets correlate
                                                                          positively with repurchase
                                           55.6                           likelihood
                        55.2
                                                                         Increased basked value with
          54.2                   54.8         +0.4 €
                                               vs. PY                     positive impact on logistics cost
                                                                          efficiency – Price increases in
                                                                          delivery and additional logistics
                                                                          cost related to protective COVID-
                                                                          19 measures fully compensated
      H1 2018         H2 2018   H1 2019   H2 2019       H1 2020

Based on order date                                                                     H1 2020 Results Presentation   20
COST EFFICIENT OPERATION CREATING MOAT
FOR ONLINE AND OFFLINE COMPETITORS
COST STRUCTURE (in % of SALES)

                    Ad./Marketing                   3.3%                              Reduced marketing spend vs. PY –
                                                                          1.7%
                                                                                       back in efficient territory while
                                                                                       increasing new business intake

                                                                                      Larger baskets prompting for higher
                            Logistics            18.4%                   18.1%         value per parcel, offsetting additional
                                                                                       cost for higher FC capacity
                           Payment 1
                                                    1.1%                  1.1%

                            IT/Admin
                                                    1.9%                  2.5%
                                          2
                                                                                      Increase in IT/ Admin cost base
                    Personnel
                                                   3.5%                   3.7%         reflecting higher non-operating
             FX gains & losses
                                                   0.0%                  0.2%          expenses for strategic projects
                                                  H1 2019                H1 2020

1) Impairment expenses on financial assets reclassified to payment
                                                                                                       H1 2020 Results Presentation   21
2) Including LTI & SOP; own work capitalized reclassified to personnel
EBITDA DRIVEN BY PRODUCT MIX & COST EFFICIENCY,
SOLID FREE CASHFLOW IN H1 2020
EBITDA (in EUR m)                             CASH FLOW H1 2020 (in EUR m)
                    +24.9                                      +22.7

                                      3.4%

                                     29.4                               29.6

         0.6%
                                                      6.9
         4.5

       H1 2019                      H1 2020         H1 2019            H1 2020

     % values: EBITDA margin (of sales)
                                                                             H1 2020 Results Presentation   22
GUIDANCE 2020
Updated on July 14, 2020
      H1 2020 Investor & Analyst Call
UPDATED FINANCIAL YEAR 2020 OUTLOOK –
ZOOPLUS INCREASES TARGETS DUE TO RESILIENT DEMAND
SALES GROWTH (in EUR m)                   EBITDA (in EUR m)

                     approx. 240 m                            at least 40 m

         225 m

                                            at least 20 m

           2020             2020E                2020            2020E
       May 7, 2020        July 14, 2020      May 7, 2020        July 14, 2020

         UPDATED THE FINANCIAL YEAR 2020 OUTLOOK ON JULY 14, 2020
                                                                                H1 2020 Results Presentation   24
Q&A
H1 2020 Investor & Analyst Call
PROFIT & LOSS
H1 2020

*The previous year's figures have been adjusted. Gains and losses from foreign currency valuation in the amount of EUR 1,103,416.33 and   H1 2020 Results Presentation   26
EUR – 2,037,197.20 were reclassified from other income or other expenses to other gains/(losses) - net.
BALANCE SHEET AS OF JUNE 30TH, 2020

                                      H1 2020 Results Presentation   27
CASH FLOW STATEMENT
H1 2020

in EUR m                                                                                         H1 2020                  H1 2019*

EBT                                                                                                  13.7                       -9.1
Cash flow from operating activities                                                                   31.6                        9.2
Cash flow from investing activities                                                                   -2.0                       -2.4
Free cash flow                                                                                       29.6                        6.8
Cash flow from financing activities                                                                  -11.6                       -9.9

Net change of cash and cash equivalents                                                              18.0                       -3.1
Currency effects on cash and cash
                                                                                                      -0.7                        0.0
equivalents
Cash on hand, bank deposits                                                                           81.6                      56.5

The previous year's figures have been adjusted. Please refer to section 2.1.1 of the notes to the consolidated financial statements in the Annual Report 2019.   H1 2020 Results Presentation   28
You can also read