CUSTOMER SATISFACTION INDEX OF SINGAPORE - 2020 Q1 RESULTS OVERVIEW Retail and Info-Communications
←
→
Page content transcription
If your browser does not render page correctly, please read the page content below
CUSTOMER
SATISFACTION
INDEX OF
SINGAPORE
2020

Q1 RESULTS OVERVIEW
Retail and
Info-Communications
2020 Q1 SCORES
                                RETAIL AND INFO-COMMUNICATIONS

        How Well Did Companies Satisfy Their Customers?

     71.3 Info-Communications                       71.0 Retail

     73.9 Wireless@SG                               72.9 e-Commerce                                71.2 Department Stores
                                                    77.5   Ebay*                                   77.0   Robinsons*
     71.7 Mobile Telecom                            75.7   Amazon                                  73.2   Tangs
     72.1 StarHub                                   75.7   Zalora                                  72.3   Marks & Spencer
     71.6 M1                                        75.5   Shopee                                  70.1   OG
     71.5 Singtel                                   72.7   Fave                                    70.0   BHG
                                                    72.6   Aliexpress                              70.4   Other department stores
     70.1 Broadband                                 70.6   Qoo10
     70.9 Singtel                                   70.3   Taobao/Tmall                            69.9 Supermarkets
     70.3 M1                                        70.0   Lazada                                  76.5   Market Place/Jasons*
     69.2 StarHub                                   69.5   Carousell                               73.0   Cold Storage
                                                    80.7   Other e-Commerce*                       70.7   Sheng Siong
     70.6 PayTV                                                                                    70.3   NTUC FairPrice
     70.9 StarHub                                   72.1 Fashion Apparels                          67.9   Prime
     70.2 Singtel                                                                                  65.6   Giant
                                                    75.6 Adidas
                                                    74.6   Uniqlo
                                                    74.3   G2000
                                                    72.1   Giordano
                                                    70.3   H&M
                                                    66.3   Cotton On
                                                    72.4   Other fashion apparels

This chart summarises the results of the CSISG 2020                  The sparklines indicate the satisfaction score of their
satisfaction scores in the Retail and Info-Communications            respective sectors, sub-sectors and companies over the past
sectors at the sector, sub-sector and company levels.                few years.
Each sector score (in gold) represents a weighted average                      statistically significant increase in customer
of their respective sub-sector scores (in blue). Satisfaction                  satisfaction from 2019 to 2020
scores for sub-sectors with individual company scores are                      statistically significant decrease in customer
weighted averages of these individual company scores.                          satisfaction from 2019 to 2020
All scores displayed are accurate to one-decimal place.                        no significant year-on-year change in customer
Entities are presented in decreasing levels of satisfaction.                   satisfaction score
* Companies indicated with an asterisk(*) are companies that
have performed significantly above their sub-sector average.         Entities shown in this scorecard have samples of N≥50.
* Sub-sectors indicated with an asterisk(*) are sub-sectors          For Fashion Apparels, due to the fragmented nature of the
that have performed significantly above their sector average.        sub-sector, entities shown have N≥30.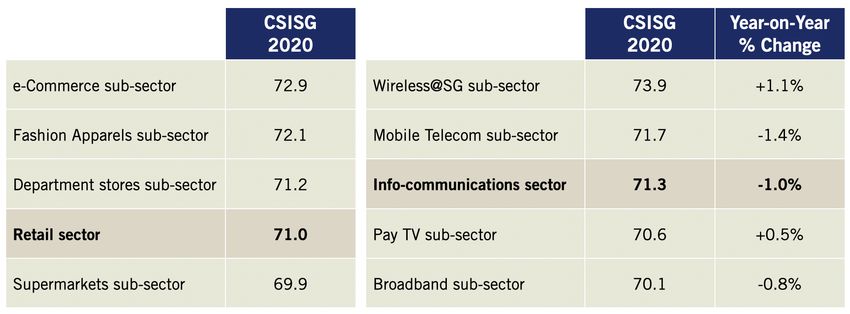
CSISG 2020 FIRST QUARTER RESULTS OVERVIEW

The Customer Satisfaction Index of Singapore (CSISG) computes customer satisfaction scores at the national,
sector, sub-sector, and company levels. The CSISG serves as a quantitative benchmark of the quality of goods
and services produced by the Singapore economy over time. 2020 marks the 14th year of measurement for
the CSISG national study.

FIRST QUARTER RESULTS HIGHLIGHTS

A substantial change was made to the Retail sector’s fieldwork methodology this year. Unlike previous years,
the sector’s survey interviews were conducted through online survey panels, instead of previous years’ face-to-
face interviews. Due to this change in data collection methodology, no year-on-year performance comparisons
would be made: Various research, including one by ISE1, suggests that when survey collection methods
change, there may be statistically significant changes to the results, even if other components of the study
remains unchanged.

Nonetheless, as a baseline reference, the Retail sector scored 71.0 points (on a 0 to 100 scale). This score
was derived from companies and brands in the Department Stores, e-Commerce, Fashion Apparels and
Supermarkets sub-sectors.

In comparison, the Info-communications sector continued using the same fieldwork methodology, i.e., face-to-
face interviews, and thus have results that were comparable year-on-year: The sector scored 71.3 points, a
1.0% dip from last year’s 72.1 points. Among its constituent sub-sectors, the Mobile Telecom and Broadband
sub-sectors declined while the PayTV and Wireless@SG sub-sectors inched up; neither of these movements
were statistically significant*.

Figure 1 illustrates the CSISG performance for each sub-sector measured in Q1.

Figure 1: CSISG scores for each of the measured sectors and sub-sectors in Q1, arranged in descending order of
performance.

*Statistical significance for the CSISG study is measured at a confidence interval of 90%.
1 CSISG fieldwork methodology whitepaper, https://ink.library.smu.edu.sg/ises_research/77/
FIRST QUARTER KEY FINDINGS
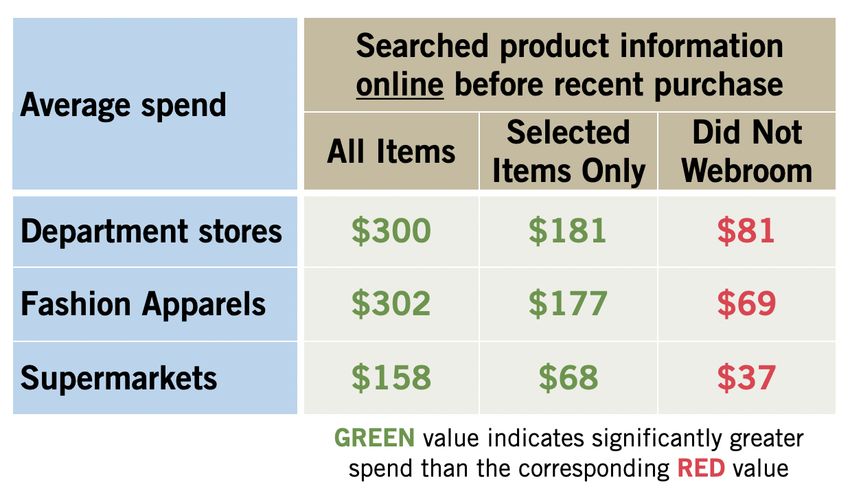
Webrooming Customers More Loyal and Spend More
Analysis revealed that customers that did online
research for information on the product they
intended to purchase before making the actual
purchase at a physical brick and mortar store, had
higher levels of customer loyalty — 13.4% higher.
They also spent significantly more at the retail
store, compared to customers that did not do any
online search for product information; this is
illustrated in Figure 2.
The study, which polled local customers of
department stores, fashion apparel stores, and
supermarkets, showed that survey respondents with Figure 2: Customers’ average spend at brick and mortar
this type of pre-purchase behaviour, i.e., retailers i.e., department stores, fashion apparel stores, and
webrooming, had a Customer Loyalty score of 74.6 supermarkets. Respondents were segmented by those that
points, compared to 65.7 points for respondents practiced webrooming for all items, selected items only and
that did not engage in webrooming. These those who did not webroom before their recent purchase.
respondents were also more likely to repurchase
from the retailer.
In addition, webrooming customers were observed to spend substantially more on average. For instance,
customers of department stores that indicated webrooming behaviour spent $229 on average; whereas
department store customers that did not do online research spent just $81 on average.
This suggests a powerful potential opportunity for retailers when creating an omnichannel presence: By
proactively engaging customers with a curated online showcase, retailers can shape and value-add to the
shopping experience.
Service Quality with Mobile Telcos Declined Significantly
The Info-communication sector’s soft overall
performance may be attributed to poorer
performance in respondents’ perceived service
quality. In particular, the Mobile Telco sub-sector
saw its Service Quality score fall significantly, from
78.1 points in 2019 to 75.6 points in 2020, a
3.2% decline.
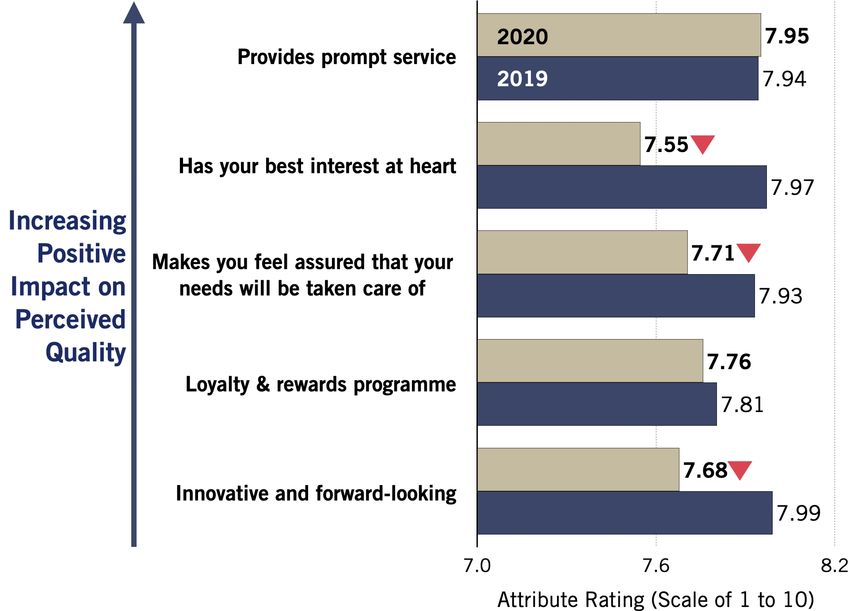
An impact analysis revealed that service-related
attributes such as “Providing prompt service”, “Has
your best interest at heart”, and “Makes you feel
assured that your needs will be taken care of”, were
the most important drivers of perceived quality for
mobile telco customers. Unfortunately, these latter
two attributes registered poorer performance year-
on-year. Figure 3 shows the performances of the Figure 3: The top 5 most important attributes in driving
five most important drivers of perceived quality for perceived quality in the Mobile Telco sub-sector, listed in
the Mobile Telco sub-sector. descending order of importance. A red arrow indicates the
2020 rating was a statistically significant decline from the
This suggest telcos would need to renew their focus 2019 rating.
in these areas to turn around this most recent
lacklustre performance in customer satisfaction and
service quality.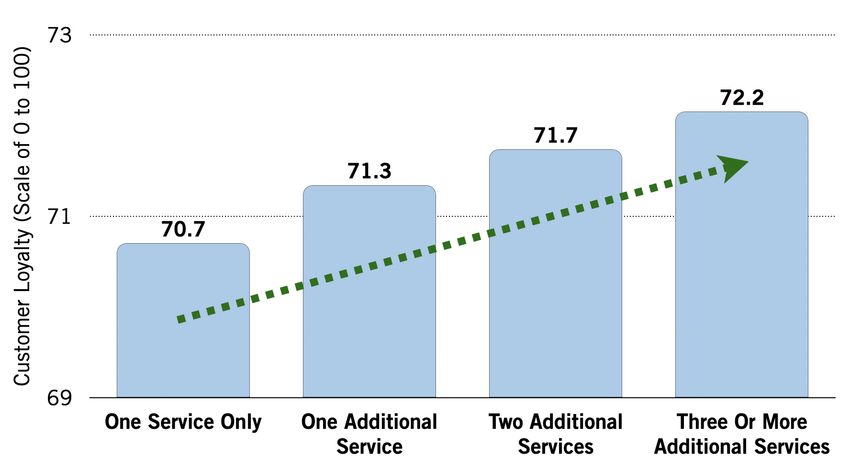
Weaker Broadband Customer Loyalty Coupled with Decline in Average Number of Services
Held Per Customer
The Broadband sub-sector recorded substantially
weaker levels of customer loyalty compared to the
previous year; its Loyalty score fell by 5.4% to 68.9
points, compared to 72.8 points from a year ago.
The poorer performance in Broadband customers’
loyalty was coupled with a significant decrease in
the average number of telco services these
customers held; the number of services held by a
typical Broadband customer fell from an average of
2.36 in 2019 to 1.63 in 2020.
Figure 4: Average Customer Loyalty scores for the Info-
Additional analysis showed that bundling, i.e.,
communications Sector customers, grouped by the number
customers subscribing to two or more other types of of services customers were subscribed to.
telco services with the same provider, helps raise
customer loyalty levels. For instance, a typical telco
customer with just one service has an average
Loyalty score of 70.7 points. This rises to 72.2
points when the customer has three or more
services. This is illustrated in Figure 4.
The year-on-year decline in Broadband customers’
average number of telco services held suggests
challenges in the service providers’ ability to
bundle services and should be an area of concern.
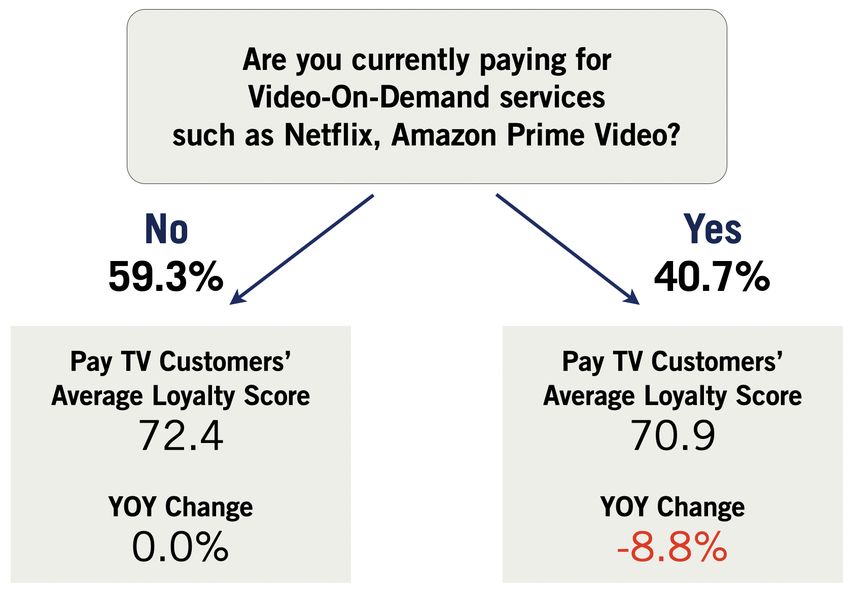
More Pay TV Customers Also Have Video Streaming Subscriptions
Within the Pay TV sub-sector, compared to the
previous year, it was observed a significantly larger
proportion of customers had subscriptions to video
streaming services such as Netflix. In 2019,
11.5% of Pay TV customers indicated they had a
subscription to a video streaming service. This rose
to 40.7% this year.
The increasing popularity in over-the-top (OTT)
streaming services among Pay TV subscribers was
coupled with an observation of significantly lower
Customer Loyalty scores year-on-year for this
customer segment, i.e., Pay TV customers with an
OTT subscription saw a significant 8.8% year-on-
year decline in their Loyalty score. This is
Figure 5: Differences in Pay TV customers’ loyalty scores
illustrated in Figure 5.
between those that did not have an additional OTT
subscription and those that did, and their respective year-
on-year changes.
CSISG BACKGROUND

CSISG scores are generated based on the econometric modelling of survey data collected from end-users after
the consumption of products and services.

Company scores are weighted based on a separately-conducted incidence study. This incidence study
determines each company’s sample profile and the local-tourist weights. Sub-sector scores are derived as a
weighted average of company scores, in proportion to the local and tourist incidence interactions with the
constituent companies. Sector scores are derived by aggregating the sub-sector scores proportionately to each
sub-sector’s revenue contributions. Finally, the national score is weighted according to each sector’s
contribution to GDP. CSISG scores customer satisfaction on a scale of 0 to 100 with higher scores
representing better performance.

Under a quarterly measure-and-release system, distinct sectors are measured each quarter with their results
released the following quarter. Companies in the Retail and Info-Communications sectors were measured in
the first quarter, the Air Transport and Land Transport sectors in the second quarter, the Food & Beverage and
Tourism sectors in the third quarter, and finally the companies of the Finance & Insurance sector in the fourth
quarter. The national score for 2020 would then be computed using the data collected over these four
quarters.

For the first quarter of 2020, results for the Retail and Info-Communications sectors were collected and
analysed. The former comprises of the Department Stores, e-Commerce, Fashion Apparels, and Supermarkets
sub-sectors. The latter consists of the Broadband, Mobile Telecoms, Pay TV, and Wireless@SG sub-sectors.

CSISG 2020 FIELDWORK PROCESS

Survey data for the Retail and Info-Communications sectors was collected between February and April 2020.
For the Retail sector, data was collected through online survey panels. For the Info-communications sector,
data was collected through face-to-face interviews with Singapore residents at their homes. Some interviews,
specifically responses for the Wireless@SG service, were conducted with departing tourists at Changi Airport.

All survey interviews were concluded before Singapore entered the Covid-19 pandemic Circuit Breaker phase.
Nonetheless, the survey period occurred as Singapore began seeing Covid-19 infections and people began
working from home. While there was no specific evidence that the Covid-19 pandemic affected the survey
responses, it was not possible to completely rule out the impact the pandemic had on the study’s findings.

In total, the Q1 fieldwork garnered 1,804 face-to-face interviews with local residents, 2,579 online interviews
with local residents, and 96 interviews with departing tourists at the airport. Together, there were 4,479
unique responses covering 77 distinct entities in the Retail and Info-Communications sectors; 36 entities
have published scores.
Contact us

For more details on the CSISG, the ISE Membership programme, and customised research,
please reach us at

Institute of Service Excellence
Singapore Management University
Lee Kong Chian School of Business
50 Stamford Road
Singapore 178899
+65 6828 0111
ise@smu.edu.sg

ise.smu.edu.sg
You can also read


