Saudi Arabian Mining Company (Ma'aden) - Investor Presentation - Q1 2021 Results

Page created by Frank Brady
 
CONTINUE READING
Saudi Arabian Mining Company (Ma'aden) - Investor Presentation - Q1 2021 Results
Growing a Saudi Global
                                              Mining Giant

Saudi Arabian Mining Company (Ma’aden)
Investor Presentation – Q1 2021 Results
Growing a Saudi Global
                                        Mining Giant

Frederik Michaelsen
Senior Investor Relations Advisor
Disclaimer
This presentation contains statements that are, or may be deemed to be, forward looking statements, including statements about the beliefs and expectations of the
Saudi Arabian Mining Company Ma’aden (the "Company"). These statements are based on the Company's current plans, estimates and projections, as well as its
expectations of external conditions and events. Forward-looking statements involve inherent risks and uncertainties and speak only as of the date they are made. As a
result of these risks, uncertainties and assumptions, a prospective investor should not place undue reliance on these forward-looking statements. A number of important
factors could cause actual results or outcomes to differ materially from those expressed in any forward-looking statements. The Company is not obliged to, and does not
intend to, update or revise any forward- looking statements made in this presentation whether as a result of new information, future events or otherwise.

This communication has been prepared by and is the sole responsibility of the Company. It has not been reviewed, approved or endorsed by any financial advisor, lead
manager, selling agent, receiving bank or underwriter retained by the Company and is provided for information purposes only. In addition, because this communication
is a summary only, it may not contain all material terms and in and of itself should not form the basis for any investment decision.

The information and opinions herein are believed to be reliable and have been obtained from sources believed to be reliable, but no representation or warranty, express
or implied, is made with respect to the fairness, correctness, accuracy, reasonableness, or completeness of the information and opinions. There is no obligation to
update, modify or amend this communication or to otherwise notify you if any information, opinion, projection, forecast or estimate set forth herein, changes or
subsequently becomes inaccurate.

You are strongly advised to seek your own independent advice in relation to any investment, financial, legal, tax, accounting, or regulatory issues discussed herein.
Analyses and opinions contained herein may be based on assumptions that if altered can change the analyses or opinions expressed. Nothing contained herein shall
constitute any representation or warranty as to future performance of any financial instrument, credit, currency, rate, or other market or economic measure.
Furthermore, past performance is not necessarily indicative of future results. The Company disclaims liability for any loss arising out of or in connection with your use of,
or reliance on, this communication.

These materials may not be published, distributed or transmitted and may not be reproduced in any manner whatsoever without the explicit consent of Ma’aden’s
management. These materials do not constitute an offer to sell or the solicitation of an offer to buy the securities in any jurisdiction.

Non-IFRS financial measures
Some of the financial information included in this presentation is derived from Ma’aden consolidated financial statements but are not terms defined within the
International Financial Reporting Standards (IFRS) as applied In the Kingdom of Saudi Arabia. Such information is provided as the Company believes they are useful
measures for investors. A reconciliation of this information with the consolidated financial statements is included in the presentation

                                                                                                                                                                                Page 3
Abdulaziz A. Al Harbi
Chief Executive Officer (A)

                              Page 4
Ma’aden’s 2025 Strategy
“Sustainable mining champion with global presence”

Pillar 1: Operational, capital and       Pillar 2: National mining                                    Foundations : Sustainability and
                                                                        Pillar 3: Global presence
      commercial excellence                      champion                                                   capability building

• Enhance competitiveness            • Grow sustainably phosphate,   • Leverage world-class mineral   • Build best-in-class safety
• Enhancing profitability and          aluminum, gold and base         deposits in Saudi Arabia to      culture and practices across
  commercial return in line            metals in Saudi Arabia          grow as a global industry        the organization and foster a
  with the profitability of          • Grow in specific industrial     leader                           zero-harm environment
  international companies              minerals                                                       • Strengthening capabilities
• Leverage digital technology        • Leading the development of                                       and preparing leaders in all
  and lean manufacturing to            the Saudi mining sector                                          core business units to
  improve efficiency levels                                                                             achieve Ma’aden’s aspiration
  across all company assets                                                                             for growth
                                                                                                      • Lead stewardship of the
                                                                                                        mining industry in Saudi
                                                                                                        Arabia and its ecosystem

                                                                                                                                     Page 5
Ma’aden’s outperformed peers and the market
  Share price returns (indexed to 100)                                                                                  Ma’aden 2019 Equity
                                                                                                                         increase (Debt for                     Annualized return since the IPO
 260%                                                                Ma’aden 2014                                           Equity swap)                        (in percent)
 240%                                                                 Rights issue
                                                                     250 M Share
 220%
 200%
 180%
                                                                                                                                                                Ma’aden                 11.1%
 160%
                                                                                                                                                                Mining Giants1          10.0%
 140% Ma’aden
            IPO
 120%                                                                                                                                                           Pure players2            7.4%
 100%
  80%                                                                                                                                                           Saudi INDEX              3.0%
  60%
  40%
  20%
    0%

                                           TASI           Mining Giants1       Pure players2             MAADEN

1 Includes Anglo American, BHP, Glencore, Rio Tinto, Vale, Vedanta             2 Includes Aluminum Corp of China, Rusal, Mosaic, Phosagro, Barrick, GoldFields, Newmont

                                                                                                                                                                                         Page 6
Health, Safety, Security &
Environment (HSSE)

                             Page 7
EHSS Performance
Ma’aden compares favorably with peers

             Total Recordable Injury Rate (TRIR)   Benchmarking

     TRIR: Recordable Injuries X 200,000
                Manhours worked

                                                                  Page 8
Q1 2021 Update

                 Page 9
Q1 2021 - Financial Performance Update
Ma’aden recorded a net profit of SR848mn in Q1-21

                          • Sales reached SR5.5bn, down 2% q-o-q, due to lower sales volume of all products (except
        Financial           gold and FRP), partially offset by increase in commodity prices of all products (except gold)
        Performance         Sales was up 25% y-o-y, because of higher prices of all products, combined with the higher
                            volumes of FRP, primary aluminum and alumina along with Meridian higher sales.

                          • EBITDA reached SR2.2bn, up 10% q-o-q, mainly due to lower operating expenses despite
                            lower sales. EBITDA was up 101% y-o-y, due to the higher sales, lower selling & marketing
                            and exploration expenses.

                          • Net profit reached SR0.85bn, up 37% q-o-q, mainly due to higher EBITDA and higher share
                            in net income of JV coupled with exchange gain of Meridian. Q1-21 turned into net profit from
                            net loss of SR0.64bn in Q1-20, mainly due to higher EBITDA, higher share in JV net income
                            and lower finance cost, partially offset by higher zakat & tax and lower income from time
                            deposits.

                          • Cash generated from operations was SR1.4bn; down 35% q-o-q

                          • Working capital stood at SR5.1bn; up 11% q-o-q due to higher inventories, receivables and
                            lower payables
                                                                                                                            Page 10
Q1 2021 - Production Update

                 • Ammonium Phosphate production was 1,071kt (down 1% y-o-y and down 19% q-o-q)
    Production
                 • Ammonia production was 498kt (down 14% y-o-y and down 17% q-o-q)

                 • Aluminum production was 256kt (up 4% y-o-y and down 2% q-o-q)

                 • Alumina production was 441kt (up 4% y-o-y and down 3% q-o-q)

                 • Flat Rolled Products production was 73kt (down 1% y-o-y and down 1% q-o-q)

                 • Gold production was 97koz (down 14% y-o-y and up 8% q-o-q)

                 • Copper production was 17kt (up 7% y-o-y and up 3% q-o-q)

                                                                                                  Page 11
Market Prices & Outlook

                          Page 12
Phosphate & Ammonia Prices
Both, Phosphate and Ammonia prices increased drastically
                     $600                                                       $450

                     $500                                                       $400

                     $400                                                       $350

                     $300                                                       $300

                     $200                                                       $250

                     $100                                                       $200

                       $0                                                       $150

                                                        DAP        Ammonia
                                               (Avg. KSA FOB)   (Avg. ME FOB)

                                                                                       Page 13
Aluminum & Alumina Prices
Prices continues to climb higher

                       $2,500                                                               $650

                                                                                            $600
                       $2,300
                                                                                            $550

                       $2,100                                                               $500

                                                                                            $450
                       $1,900
                                                                                            $400

                       $1,700                                                               $350

                                                                                            $300
                       $1,500
                                                                                            $250

                       $1,300                                                               $200

                                   LME 3-month Aluminum Price   Alumina Price Index (API)

                                                                                                   Page 14
Gold & Copper Prices
Gold slightly down, Copper continued to rise

                      $2,000                                                   $9,000

                      $1,900
                                                                               $8,500
                      $1,800
                                                                               $8,000
                      $1,700
                                                                               $7,500
                      $1,600

                      $1,500                                                   $7,000

                      $1,400
                                                                               $6,500
                      $1,300
                                                                               $6,000
                      $1,200
                                                                               $5,500
                      $1,100

                      $1,000                                                   $5,000

                                               Gold in $/oz   Copper in $/kt

                                                                                        Page 15
Yaser A. Barri
SVP, Finance & Chief Financial Officer (A)

                                             Page 16
Q1 2021 - Financial Performance

                                  Page 17
Q1 2021 - Consolidated Key Financial Results

                                               Page 18
Q1-21 net profit higher by 37% compared to Q4-20
                                                                                                   SRmn
Movement in net profit by line items (q-o-q)

   Profit / (Loss) attributed to the shareholders’ of parent co.
   Profit / (Loss) attributed to minority interest

                                                                                                    848
                                           376
                                                                     -473
           617                                                                             365

                                                                                  -38
                                                                                                      761
             572

             45                                                                                       87
         Net profit                       Price                    Sales vol.   Finance   Others   Net profit
          Q4-20                           effect                     effect       cost              Q1-21
                                                                                                                Page 19
Q1-21 net profit compared to Q1-20 net loss
                                                                                                   SRmn

Movement in net profit/ (loss) by line items (y-o-y)

   Profit / (Loss) attributed to the shareholders’ of parent co.
   Profit / (Loss) attributed to minority interest

                                                                                                      848
                                                                                           200
                                                                                  188
                                                                                                       761
                                                                      151

                                                                                                          87
         -353                             946
                                                                   Sales vol.   Finance   Others    Net profit
                                                                     effect       cost               Q1-21
         -284

        -638
       Net loss                         Price
        Q1-20                           effect
                                                                                                                 Page 20
Q1 2021 - Consolidated Sales and EBITDA by Segment

     Consolidated                                         Phosphate
                                     vs.        vs.                                      vs.         vs.
                           Q1-21   LY Qtr.   Prev. Qtr.                         Q1-21   LY Qtr.   Prev. Qtr.

     Sales (SRmn)          5,450   25%       -2%          Sales (SRmn)          2,697   41%         -5%

     EBITDA* (SRmn)        2,193   101%      9%           EBITDA* (SRmn)        1,000   544%        0%

     EBITDA margin         40%     15%       4%           EBITDA margin         37%     29%         2%

                                                          50% of Group EBITDA

     Aluminium                                            Gold
                                     vs.        vs.                                      vs.         vs.
                           Q1-21   LY Qtr.   Prev. Qtr.
                                                                                Q1-21   LY Qtr.   Prev. Qtr.

     Sales (SRmn)          2,113   20%       2%           Sales (SRmn)          640     -7%         2%

     EBITDA* (SRmn)        865     39%       21%          EBITDA* (SRmn)        328     5%          12%

     EBITDA margin         41%     6%        7%           EBITDA margin         51%     6%          4%

     35% of Group EBITDA                                  15% of Group EBITDA

                                                                                                               Page 21
Quarterly EBITDA and EBITDA margins
Highest EBITDA since Q1 2017; EBITDA margins continue to rise
                                           55%     53%
                 52%   50%                               51%
                                   47%
                             43%                                44%
                                                                                                                                40%
                                                                                                                        36%
                                                                          33%         33%                       32%
                                                                                30%         29%
                                                                                                  25%   27%

                                                                                                                                2,193
                                           1,966                                                                        2,003
                                                   1,815 1,727
                                                               1,681
                 1,428 1,504 1,345 1,541                               1,392 1,310 1,439 1,416                  1,470
                                                                                                  1,091 1,069

                                                         EBITDA (mn SR)          EBITDA Margin

                                                                                                                                        Page 22
SRmn
Q1 2021 - Consolidated statement of cash flows
Healthy cash flow from operating activities
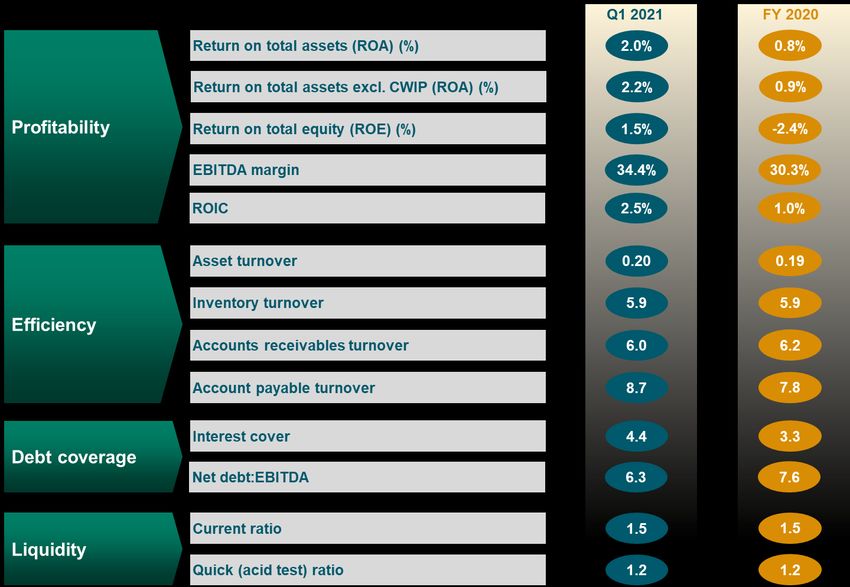
                                                        Page 23
SRmn
Financial Ratios

                          Page 24
Q1 2021 - Operational Performance

                                    Page 25
Phosphate & Ammonia: Production & Sales in Q1 2021

        Ammonium Phosphate Fertilizer                                                    Ammonia
1,800                                                              700
                                                                         577                  598
1,500                          1,328 1,320                         600
                1,197
                                                                                                                      498
1,200   1,081                                        1,071 1,080   500
                                                                   400         347                    330
 900                                                                                                                          269
                                                                   300
 600
                                                                   200
 300                                                               100
   0                                                                 0
         Q1 2020                Q4 2020                  Q1 2021         Q1 2020               Q4 2020                    Q1 2021

                Production (in kmt)     Sales (in kmt)                          Production (in kmt)      Sales (in kmt)

                                                                                                                                    Page 26
Aluminum & Alumina: Production & Sales in Q1 2021

                     Aluminum                                                                                                         Alumina
265                                                                                                         500      426                  455                 441
                           260 260
260                                            256 256                                                      400
255
             249                                                                                            300
250   245
                                                                                                            200
245                                                                                                                                              105
240                                                                                                         100              35                                      42
235                                                                                                              0
      Q1 2020              Q4 2020             Q1 2021                                                               Q1 2020              Q4 2020             Q1 2021

            Production (in kmt)      Sales (in kmt)                                                                        Production (in kmt)      Sales (in kmt)

                                                                 Flat Rolled Products
                                                      90                                                    81
                                                                 77                   78
                                                      80   74                  74                    73
                                                      70
                                                      60
                                                      50
                                                      40
                                                           Q1 2020            Q4 2020                Q1 2021

                                                                Production (in kmt)        Sales (in kmt)

                                                                                                                                                                          Page 27
Gold & Copper: Production & Sales in Q1 2021

                             Gold                                                              Copper
                                                                                  18.8
150                                                                 20.0                          16.5    16.8                17.0
      113   116                                                            15.9                                                      15.0
                              90      89                  97   96   15.0
100
                                                                    10.0
 50
                                                                     5.0

  0                                                                  0.0
      Q1 2020                  Q4 2020                    Q1 2021           Q1 2020                Q4 2020                     Q1 2021

                Production (in koz)      Sales (in koz)                             Production (in kmt)      Sales (in kmt)

                                                                                                                                            Page 28
Updates on Ma’aden’s Projects

                                Page 29
SRmn
Updates on Ma’aden’s Projects

     Ammonia III
     • Expected to produce 1,1kmt p.a.
     • US$1,113mn Budget
     • Completion: Q4 2021 (20kmt) and full operational Q1 2022

     MMGP
     • Expected to produce 250k ounces of gold p.a.
     • US$880mn Budget
     • Completion: Q2 2022

     Phosphate III
     • Expected to produce 3,0kmt p.a.
     • US$4,219mn Budget
     • Completion: 2025 (Phase 1)

     Remediation at Wa’ad Al-Shamal
     • Phosphate production to improve from 2.8kmt in 2021 to 3.1kmt in 2025

                                                                                      Page 30
Q&A

      Page 31
Growing a Saudi Global
                Mining Giant

Thank You
Appendix

           Page 33
COVID-19 Update
Infection rate is only 0.17%

    3.00
    2.50
    2.00
     1.50
     1.00
    0.50
    0.00

                                                                                                                                                                                                                                                                                                                                                        7-Mar
                                                                                                                                                                                                                                                                         3-Jan
                                                                                                                                      20-Sep

                                                                                                                                                                                                                                              13-Dec
                                                                                  9-Aug

                                                                                                                                                                                                                                                                                                                     7-Feb
                                                                                                                                                                                                                                                                27-Dec

                                                                                                                                                                                                                                                                                                                                               28-Feb

                                                                                                                                                                                                                                                                                                                                                                14-Mar
                                                                                                                                                                                                   8-Nov

                                                                                                                                                                                                                                                                                                                                                                                  28-Mar
                                                                                                                                                                                                                                                                                                                             14-Feb
                                                        19-Jul

                                                                                                                                                                                                                             29-Nov

                                                                                                                                                                                                                                                       20-Dec
                                       5-Jul

                                                                                                                     6-Sep

                                                                                                                                                                                                                                                                                          17-Jan
                                                                                                                                                        4-Oct

                                                                                                                                                                                                                                                                                                            31-Jan

                                                                                                                                                                                                                                                                                                                                      21-Feb
                                                                                                                                                                         18-Oct

                                                                                                                                                                                           1-Nov
                                                                                          16-Aug
            14-Jun

                              28-Jun

                                                                          2-Aug

                                                                                                                                                                                                                                                                                                   24-Jan
                                                                                                                             13-Sep

                                                                                                                                                                                                                                                                                                                                                                         21-Mar
                                                                                                                                                                                                           15-Nov

                                                                                                                                                                                                                                                                                 10-Jan
                                                                                                                                                                                                                                      6-Dec
                                                                 26-Jul

                                                                                                                                               27-Sep
                                                                                                   23-Aug

                                                                                                                                                                11-Oct
                     21-Jun

                                               12-Jul

                                                                                                                                                                                  25-Oct

                                                                                                                                                                                                                    22-Nov
                                                                                                            30-Aug

                                                                                                                                      Overall                                          Direct                                         Contractors

       Infection rate is the percentage of the overall workforce with an active COVID-19 infection.

       This is calculated by the following formula:
                                                                                                                        # of Active Infections X 100 = Rate of Infection
                                                                                                                           Workforce
             (The provided data included all Maaden Affiliates Employees including contractor count. The total number is approx. 22,000)
                                                                                                                                                                                                                                                                                                                                                                                           Page 34
SRmn
Debt repayment profile

                                Page 35
You can also read