FY 2016 Results VTG AG - On the track for the future - Analyst Conference - Investor Relations

Page created by Felix Harrison
 
CONTINUE READING
FY 2016 Results VTG AG - On the track for the future - Analyst Conference - Investor Relations
FY 2016 Results
VTG AG – On the track for the future

Analyst Conference
April 6, 2017
FY 2016 Results VTG AG - On the track for the future - Analyst Conference - Investor Relations
Agenda

   1      Highlights 2016
   2      Discussion of FY 2016 figures
   3      Outlook FY 2017
   4      VTG 4.0 – Current Financial Status
   5      Financial calendar

FY 2016 Results - Analyst Conference, April 6, 2017, ©2017 VTG Aktiengesellschaft   1
FY 2016 Results VTG AG - On the track for the future - Analyst Conference - Investor Relations
Executive Summary

        Considerable synergies from AAE takeover and
         efficiency gains lead to higher profitability
        In spite of slight sales decline, EBITDA rises to new
         record high
        EPS more than doubled
        For 2017 further increase in sales and earnings expected
        New shareholder structure: After more than ten years
         Wilbur Ross gave his shares into new hands

        Group figures
                                                                        2015         2016                 ∆
         Sales                                                      1,027.5          986.9       - 4.0 %

         EBITDA                                                        336.5         345.3      + 2.6 %

         EPS                                                             0.75         1.56     + 108 %

         Utilization                                                 90.6 %         89.8 %      - 0.8 PP

FY 2016 Results - Analyst Conference, April 6, 2017, ©2017 VTG Aktiengesellschaft            06.04.2017       2
FY 2016 Results VTG AG - On the track for the future - Analyst Conference - Investor Relations
Railcar Division – Highlights by region

                     Europe                                            North America                       Russia

          Market demand remains                                       High utilization maintained    Stabilizing economic
          stable but less dynamic                                     Downturn in shale gas          environment
          than expected                                               market with no impact on       Utilization remains on a
          Investments into new                                        VTG‘s US business              high level at low prices
          builds increased                                            Opportunistic acquisition of   Capex plans mainly on
          Joint development of                                        a used fleet (200 wagons)      hold due to uncertain
          innovative railcars started                                 Delivery of 1,000 new          political and economical
          Digitization of fleet                                       railcars expected to           situation
          announced                                                   commence in 2017

FY 2016 Results - Analyst Conference, April 6, 2017, ©2017 VTG Aktiengesellschaft                           06.04.2017          3
FY 2016 Results VTG AG - On the track for the future - Analyst Conference - Investor Relations
Railcar fleet

   Fleet development 2016                                                           Utilization

                             2,600                2,400
                                                                                    90.9%                   90.6% 90.6%
                                                                                            90.2%                         90.1%
                                                                                                    89.6%                         89.8% 89.8%

        81,700                                                        81,900

                                                                                              2015                            2016
     31.12.2015                 In                 Out             31.12.2016

    Comment                                                                         Comment
       1,400 new and 300 used wagons were added to                                   Utilization of VTG’s world wide fleet
        the fleet in 2016                                                              remains on satisfying level
       Additionally the take over of a French railcar                                European intermodal fleet with somewhat
        pool increased the number of wagons by 900                                     lower utilization

       In the same period 2,000 wagons were
        discharged and another 400 were off-hired

FY 2016 Results - Analyst Conference, April 6, 2017, ©2017 VTG Aktiengesellschaft                                                               4
FY 2016 Results VTG AG - On the track for the future - Analyst Conference - Investor Relations
Split of Group Sales and EBITDA

      Group Sales                                                                    Group EBITDA
      (in € m)                                                                       (in € m)

                                    - 4.0 %                                                             + 2.6 %

                    1,027.5                                                                                       345.3
                                                     986.9                                      336.5

                     2015                            2016                                       2015              2016

      Comment                                                                       Comment
    Sales below last year due to:                                                   Key drivers of EBITDA increase:
     increased road competition                                                     Efficiency gains
     discontinuation of low margin business in                                      realized synergies from AAE acquisition
      rail logistics                                                                 positive one-off (6m €)
     lower freight rates in tank container logistics

FY 2016 Results - Analyst Conference, April 6, 2017, ©2017 VTG Aktiengesellschaft                                               5
FY 2016 Results VTG AG - On the track for the future - Analyst Conference - Investor Relations
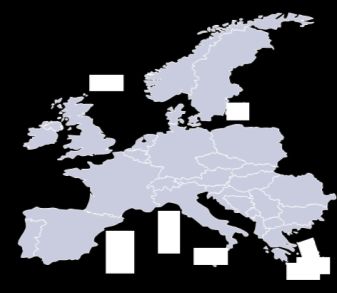
Sales development by division

      Railcar                                                   Rail Logistics                        Tank Container Logistics
      (in € m)                                                  (in € m)                              (in € m)

                         - 3.7%                                                     - 3.6%                               - 5.3%

                 537.2                                                     324.0                                 166.3
                                    517.2                                                    312.3                                157.4

                 2015               2016                                   2015              2016                2015             2016

      Comment                                                   Comment                               Comment
     Intensified competition with                             Discontinuation of low margin         Stable transport volumes
      road transport due to low                                 business
      diesel prices and reduced                                                                       Lower freight rates due to
                                                               Little demand for agricultural         lower oil prices
      truck toll in Germany                                     goods transportation and
     Utilization with 89.8 % on a                              production downtimes at
      satisfying level (2015: 90.6 %)                           customers

FY 2016 Results - Analyst Conference, April 6, 2017, ©2017 VTG Aktiengesellschaft                                                         6
FY 2016 Results VTG AG - On the track for the future - Analyst Conference - Investor Relations
EBITDA development by division

      Railcar                                                      Rail Logistics                     Tank Container Logistics
      (in € m)                                                     (in € m)                           (in € m)

                         +2.6%                                                       +71.2%                            -17.5%

                                                                                                                                -7.3%
                                                                                                                 1.5

                                     344.3                                                    5.8
                 335.4                                                                                           12.1
                                                                                                                                11.2
                                                                              3.4

                 2015                 2016                                    2015            2016               2015           2016

      Comment                                                      Comment                            Comment
     Synergies, efficiency gains                                 EBITDA up by 71 % on the           Extraordinary income in Q1
      and a positive one-off lead to                               back of a higher margin             2015 from sale of affiliate
      positive EBITDA development                                  business and efficiency gains       (1.5 m €)
     EBITDA margin at 66.6 %                                     EBITDA margin* at 20.9 %           Like-for-like EBITDA down by
      (2015: 62.4 %)                                               (2015: 12.2 %)                      7 % - margin* at 39.4 %
                                                                                                       (2015: 42.1 %)
   * EBITDA margins calculated on gross profit (logistics divisions only)

FY 2016 Results - Analyst Conference, April 6, 2017, ©2017 VTG Aktiengesellschaft                                                       7
VTG Group with strong anchor shareholders

       Share price development                                                           Ownership structure
                                                                                                             Joachim
                                                                                                           Herz Stiftung
     110%                                                                                                      10%
                                                                                                                                          Freefloat
                                                                                                                                            41%
     105%                                                                                      Kuehne
                                                                                              Holding AG
                                                                                                 20%
     100%

                                                                                                 Morgan Stanley
      95%                                                                                         Infrastructure
                                                                                                       29%

      90%

      85%                                                                              Group dividend per share (in €)
                                                                                                                                                              0.75*
      80%

                                                                                                                                                       0.50
      75%                                                                                                                                       0.45
                                                                                                                                         0.42
                                                                                                                           0.35   0.37
            January 2016                                      December 2016                         0.30    0.30
                                                                                                                   0.33

                                                                                         (VTG-IPO)
              SDAX Performance Index                                                 N/A     0
              VTG Share (incl. dividend)
                                                                                     2006 2007 2008 2009 2010 2011 2012 2013 2014 2015 2016e
                                                                                    * Intended proposal to AGM

FY 2016 Results - Analyst Conference, April 6, 2017, ©2017 VTG Aktiengesellschaft                                                                                     8
Agenda

   1      Highlights 2016
   2      Discussion of FY 2016 figures
   3      Outlook FY 2017
   4      VTG 4.0 – Current Financial Status
   5      Financial calendar

FY 2016 Results - Analyst Conference, April 6, 2017, ©2017 VTG Aktiengesellschaft   25.04.2010   9
Group key figures

       Key figures                                                                             Comment

    (in € m)                                       2015              2016                 Δ     Group revenue below while EBITDA
                                                                                                 slightly above last year´s level
    Sales                                     1,027.5               986.9            - 4.0 %
    EBITDA                                       336.5              345.3            + 2.6 %    Significant EBT improvement mainly
                                                                                                 triggered by lower interest expenses
    EBIT                                         144.1              149.7            + 3.8 %     and lower other financial expenses
    EBT                                            45.9               88.2          + 92.3 %     (FX and swap valuation)
    Net income                                     29.4               57.5          + 95.5 %    Earnings per share (EPS) more than
    Net income to                                                                                doubled
                                                   21.6               45.0          + 108 %
    shareholders
    EPS in €                                       0.75               1.56          + 108 %

FY 2016 Results - Analyst Conference, April 6, 2017, ©2017 VTG Aktiengesellschaft                                                       10
Financial result

       Split of financial result (in € m)                                                     Comment
                                                                            2015    2016
                                                                                             Financial result improved
        EBIT                                                               144.1    149.7     significantly
        EBT                                                                  45.9    88.2    New financing structure led to
        Financial result                                                    -98.2   -61.5     interest savings of 11.4 m € in
        Thereof:                                                                              2016

           interest expenses of financial debt                              -65.4   -53.5    Other financial expenses
                                                                                              considerably lowered
           interest expenses from credit lines                               -2.0    -2.5
           Total interest expenses                                          -67.4   -56.0    Overall net effect of swap
                                                                                              valuation and ruble appreciation
                                                                                              still negative (-0.9 m€)
           transaction costs                                                 -7.9    -3.2
           Swap effects                                                      -9.7    -4.9    Average interest rate at around
                                                                                              4% (incl. swaps)
           FX effects                                                       -10.5     4.0
           interest on pensions                                              -1.3    -1.3
           other financial result                                            -1.4    -0.1
        Total other financial expenses                                      -30.8    -5.5

FY 2016 Results - Analyst Conference, April 6, 2017, ©2017 VTG Aktiengesellschaft                                                11
Capex

       Capital expenditures (in € m)                                                              Comment
                                                                                                 Higher off balance capex due to
                                                                                                  postponements from last year
                 Total: 195.8                                Total: 259.3
                                                                                                 Roughly 50% of on balance capex was
                                                                                                  made in Q4 with no effect on earnings in
                                                                     38.5                         2016
                                                                                                 Order book shows effects from the
                           10.6                                                                   “Initiative 2020” which will additionally
                                                                                                  drive Capex in the next 3 years

                                                                                                  Order Book
                                                                     220.8                      5,000
                          185.2                                                                                                               4,000
                                                                                                4,000

                                                                                                3,000

                                                                                                2,000

                                                                                                1,000
                          2015                                       2016
                                                                                                    -
           Fixed assets*            Off balance                                                    Q4/2012   Q4/2013    Q4/2014   Q4/2015     Q4/2016

   * Capex for fixed assets, including intangible assets and capitalization of revision costs

FY 2016 Results - Analyst Conference, April 6, 2017, ©2017 VTG Aktiengesellschaft                                                                     12
Implications for mid-term targets

         Investments                                                                               Comments
         (on balance, in m€)
                                                Acquisition
                                                opportunities                                     Investments and utilization have been below
     Target:                                                      50       „Initiative 2020“       budget recently reflecting the somewhat
     250 m€
                     -65 m€                   -30 m€              250
                                                                                                   slower economic environment
                                        220
                 185                                                                              Growth investments of 95 m€ are currently
                                                                                                   delayed

                                                                                                  For 2017 investments will increase up to the
                                                                                                   originally planned level but will not fully close
                2015                   2016                     2017 (e)
                                                                                                   the gap
        Utilization
                                                                                                  VTG will use the currently favorable market
                                                                                                   conditions for new builds and increase
       90.9%
                90.2%              90.6% 90.6% 90.1%                                               modernization efforts (“Initiative 2020”)
                         89.6%                       89.8% 89.8%

                                                                                                  To meet 2018 EPS expectations growth
                                                                                                   investments and utilization especially in the
                                                                                                   intermodal segment need to catch up

                    2015                                    2016

FY 2016 Results - Analyst Conference, April 6, 2017, ©2017 VTG Aktiengesellschaft                                                                      13
VTG Group – Operating cash flow and Net debt

       Cash flow                                                                             Net debt
       (in € m)                                                  2015               2016     (in € m)               31.12.2015    31.12.2016
       Operating cash flow                                       282.9              326.2
       Payments for fixed assets                                -170.5          -220.4       Net debt                   1,667.5       1,660.4

       Disposal of fixed assets                                  +76.0              +11.9    Net debt adjusted
                                                                                                                        1,742.0       1,731.4
                                                                                             (incl. pensions)
       Financial assets AAE (net)                                +19.4                  -
                                                                                             Net debt adj./EBITDA           5.2           5.0
       Others                                                      -6.4              +1.3
       Total investing cash flow                                 -81.5          -207.2
                                                                                             Comment
       Free cash flow (rep.)                                     201.4              119.0    Operating cash flow further improved
       Disposal of fixed assets                                  -50.5                  -    Free cash flow in 2015 was boosted by the
                                                                                              sale of a wagon fleet and from the acquisition
       Financial assets AAE (net)                                -19.4                  -     of AAE (effect: € 69.9 m)
       Free cash flow (adj.)                                     131.5              119.0    On the back of a very healthy Free cash flow
                                                                                              net debt decreased while investments
                                                                                              increased in 2016

FY 2016 Results - Analyst Conference, April 6, 2017, ©2017 VTG Aktiengesellschaft                                                              14
Comparing ROCE and WACC

      ROCE and WACC

                                                   8.2                              8.4
                    7.8
                                                                                                      6.4    6.7
                    7.8                            7.5
                                                                                    6.3                      5.5
                                                                                                      5.8
                   2012                            2013                             2014              2015   2016
                                                   ROCE                              WACC (pre tax)

           Comment
       ROCE improved slightly in 2016 in light of higher profitability and stable capital employed
       Decline in ROCE in 2015 is typical for high investments in young fleets
       ROCE is expected to further recover in the coming years as book values of former AAE fleet decline
        and profits increase
       Capital costs continued to decline in 2016

FY 2016 Results - Analyst Conference, April 6, 2017, ©2017 VTG Aktiengesellschaft                                   15
Several effects influenced ROCE development

       ROCE Development                                                               ROCE Calculation
       (in %)                                                                        (in m €)
                                                                                                                           2015      2016
           8.4                                  8.4
                                   8.2
                       7.8                                                           EBIT                                  144.1     149.7
                                                                                     Elimination PPA                          8.1       8.1
                                                                        6.7
                                                            6.4
                                                                                     Elimination extraordinary
                                                                                     result                                   8.2       8.4
                                                                                     EBIT normalized                       160.5     166.2

                                                                                     Capital employed                      2,490*   2,498**

                                                                                                      EBIT normalized
                                                                                     ROCE =                            6.4%           6.7%
                                                                                                      Capital employed
          2011        2012        2013         2014        2015        2016
                                                                                    *Year-end value    ** Yearly average

FY 2016 Results - Analyst Conference, April 6, 2017, ©2017 VTG Aktiengesellschaft                                                             16
WACC development

       WACC Development                                                             WACC Calculation
       (in %)
                                                                                                             2015*     2016
                                                                                    Risk free rate            1.6 %    0.7 %
                       7.8                                                          Market Risk premium       6.3 %    6.3 %
           7.6                     7.5
                                                                                    Beta                      0.96x    1.00x
                                                6.3                                    Cost of Equity         7.6 %    7.0 %
                                                            5.8
                                                                        5.5         Debt premium             267 bp   337 bp
                                                                                       Cost of debt           2.7 %    2.7 %
                                                                                       Cost of hybrid bond    5.0 %    5.0 %
                                                                                    Share of equity          16.0 %   16.0 %
                                                                                    Share of hybrid bond      9.0 %    9.0 %
                                                                                    Share of debt            75.0 %   75.0 %
                                                                                    Tax rate                 36.0 %   35.0 %

                                                                                    WACC (pre tax)            5.8 %    5.5 %
          2011        2012         2013        2014        2015         2016

                                                                                    * after refinancing

FY 2016 Results - Analyst Conference, April 6, 2017, ©2017 VTG Aktiengesellschaft                                              17
Agenda

    1      Highlights 2016
    2      Discussion of FY 2016 figures
    3      Outlook FY 2017
    4      VTG 4.0 – Current Financial Status
    5      Financial calendar

FY 2016 Results - Analyst Conference, April 6, 2017, ©2017 VTG Aktiengesellschaft   18
FY 2017 outlook

                           For VTG Group slight increase in sales and EBITDA expected

             Railcar
             Stable sales and EBITDA development expected                                              Segment outlook
                Current market environment with no significant growth drivers
                                                                                                       Revenue
                Utilization to stay at previous year level with slight fluctuations
                6 m € one-off from 2016 will be compensated by full-year effect of 2016 investments   EBITDA

                Rail Logistics
             Slight increase in sales and EBITDA expected                                              Segment outlook
                Strengthening of sales activities with continued focus on high                        Revenue
                 margin business
                Further efficiency measures to be taken                                               EBITDA

                Tank Container Logistics
                                                                                                       Segment outlook
            Slight increase in sales and EBITDA expected
                                                                                                       Revenue
                Slight increase in transport volume expected
                Margin improvement due to investment in own containers                                EBITDA

FY 2016 Results - Analyst Conference, April 6, 2017, ©2017 VTG Aktiengesellschaft                                        19
Agenda

    1     Highlights 2016
    2     Discussion of FY 2016 figures
    3     Outlook FY 2017
    4     VTG 4.0 – Current Financial Status
    5     Financial calendar

FY 2016 Results - Analyst Conference, April 6, 2017, ©2017 VTG Aktiengesellschaft   20
Mid-term financial objectives

        Status of Projects                                                             Comments
      1 Growth
                                                                                     Growth investments catching up – effect on
            Railcar
                                                ↗           In progress               EPS increase might be delayed
            Logistics
                                                ↗         Well on track              Growth in logistics divisions with good
                                                                                      progress
       2 Efficiency
            Utilization                        ↗            In progress              Expected increase of utilization with the
                                                                                      current economic outlook less predictable
            Efficiency                         ↗          Well on track              Efficiency and synergies progressing well
            Synergies                          ↗         Well on track

      3 Finance & Tax
                                                                                     Effect of better financing fully seen in 2016
            Interest Rates                              accomplished
                                                                                     Tax rate moving in the right direction
            Tax Rate                            ↗         Well on track

                         VTG is on track to reach the EPS target of 2.50 € in 2018/2019

FY 2016 Results - Analyst Conference, April 6, 2017, ©2017 VTG Aktiengesellschaft                                                     21
Disclaimer
This presentation contains forward-looking statements. These statements are based on the current views, expectations,
assumptions and information of the management of VTG Aktiengesellschaft. Forward-looking statements shall not be
construed as a promise for the materialization of future results and developments and involve known and unknown risks
and uncertainties. Actual results, performance or events may differ materially from those described in such statements due
to, among other things, changes in the general economic and competitive environment, risks associated with capital
markets, currency exchange rate fluctuations, changes in international and national laws and regulations, in particular with
respect to tax laws and regulations, affecting VTG Aktiengesellschaft, and other factors. VTG Aktiengesellschaft does not
assume any obligations to update any forward-looking statements.

This document and the information contained herein are for information purposes only and do not constitute a prospectus or
an offer to sell or a solicitation of an offer to buy any securities in the United States. Any securities referred to herein have
not been and will not be registered under the U.S. Securities Act of 1933, as amended, (the “Securities Act”) or the laws of
any state of the United States, and may not be offered, sold or otherwise transferred in the United States absent
registration or pursuant to an available exemption from registration under the Securities Act. VTG Aktiengesellschaft does
not intend to register any securities referred to herein in the United States.

FY 2016 Results - Analyst Conference, April 6, 2017, ©2017 VTG Aktiengesellschaft                                             22
Save the date 2017

    Financial Calendar 2017:
     March 7                                                 Preliminary Results FY 2016
     April 6                                                 Annual Report FY 2016
     April 6                                                 Analyst Conference, Hamburg
     May 4                                                   Quarterly Statement Q1 2017
     June 8                                                  Annual General Meeting, Hamburg
     August 29                                               Half-Yearly Financial Results 2017
     November 9                                              Quarterly Statement Q3 2017

          Contact Investor Relations

                        Christoph Marx                                                             Alexander Drews
                        Head of Investor Relations                                       Investor Relations Manager
                        Phone: +49 40 2354 1351                                             Phone: +49 40 2354 1352
                        Fax: +49 40 2354 1350                                                 Fax: +49 40 2354 1350
                        Email: christoph.marx@vtg.com                               Email: alexander.drews@vtg.com
                                               VTG Aktiengesellschaft, Nagelsweg 34, 20097 Hamburg, Germany

FY 2016 Results - Analyst Conference, April 6, 2017, ©2017 VTG Aktiengesellschaft
You can also read