FY20 Results Presentation - 6 August 2020 - Nick Scali
←
→
Page content transcription
If your browser does not render page correctly, please read the page content below

FY20 Results Presentation
6 August 2020

Results Overview

FY20 Highlights

                                       • Written sales orders up 9% to $293.2m (FY19: $268.9m)
Sales                                  • Sales down 2% to $262.5m (FY19: $268.0m)

Margin                                 • Gross margin 62.7% (FY19 : 62.9%)

NPAT                                   • Underlying1 NPAT $42.1m, above guidance of $39-40m (FY19: 42.1m)

                                       • Net increase in cash of $26.8m
Cashflow                               • Underlying operating cashflow of $62.8m1 (FY19: $45.4m)

                                       • Final dividend of 22.5 cps (FY19: 20.0 cps)
Dividends                              • Total dividend for the year of 47.5 cps (FY19: 45.0 cps), up 5.6% on last year
                                       • Full year payout ratio of 90% (FY19: 87%)

                                       • One new store opened during the year, our third store in New Zealand
Store network                          • Online sales channel successfully launched in April 2020

 1Underlying   results exclude the impact of the gain on sale of property, one offs and the impact of the adoption of AASB 16.

                                                                                                                                 2
Sales Orders & Trading

Written Sales Orders, A$m      FY20 Trading Commentary
                               • Written sales orders for the year up from $268.9m to
                                 $293.2m, driven by exceptional growth in May and June

                               • H2 FY20 written sales up 18% on H2 FY19, driven by
                                 increased levels of customer activity prior to temporary store
                                 closures and a subsequent rebound following reopening of
                                 the network
                        H2
       H2              167.1   • Estimated ~$9-11m of sales orders lost during poor trading at
      141.8   +17.8%             the end of March and temporary store closures in April

                               • Total written sales orders up over 70% in May and June, with
                                 store traffic up approximately 30% across the network

                               • Sales order bank finished the financial year at a record level
                                 following May and June trading

       H1               H1
      127.1    -0.8%   126.1

       FY19             FY20

                                                                                                  3
Sales Revenue

Sales Revenue, A$m                       Sales Commentary
                                         • Total sales revenue down 2.1%, and down 6.7% on a LFL
                                           basis, largely due to temporary store closures in April and a
                                           subdued trading environment in March 2020 impacting
                                           revenue for FY20

                                         • Despite the closures, sales revenue greater than initially
                                           anticipated due to a higher level of deliveries arising from
                                           sales of ‘in-stock’ and shorter lead time items

                                         • Existing order bank provides a good level of visibility on
                                           forward revenue for 1H FY21
                         268.0   262.5
                 250.8
         232.9
 203.0

 FY16    FY17    FY18    FY19    FY20

                                                                                                           4
Profit & Loss

                                                FY20             FY19          Change              Profitability
Sales revenue                                   262.5           268.0             - 5.5            • Gross profit margins maintained despite significant
                                                                                                     devaluation of AUD, driven by retail pricing initiatives and
Cost of sales                                   (97.8)           (99.4)           + 1.6              support from suppliers
Gross profit                                    164.7           168.6             - 3.9
                                                                                                   • Operating expenses for the full year reduced by $5.0m as a
Other income                                       1.9             2.2             - 0.3             result of cost reductions in property, employment, marketing
Operating expenses                             (100.9)          (105.8)           + 4.9              and general operating expenses achieved in 2H FY20

EBITDA                                           65.7             65.0            + 0.7            • 2H FY20 NPAT up 25% on the prior year despite lower
Depreciation                                      (4.9)            (4.3)           - 0.6             revenue relative to FY19

EBIT                                             60.8             60.7            + 0.1            • Underlying FY20 NPAT of $42.1m, in line with FY19 and above
Net interest expense                              (0.9)            (1.1)          + 0.2              guidance of $39-40m

Profit before tax                                59.9             59.6            + 0.3

Taxation                                        (17.8)           (17.5)            - 0.3

Net profit after tax                             42.1             42.1            + 0.0

Gross profit margin                            62.7%            62.9%

Operating expense %                            38.4%            39.4%

The results reported in Appendix 4E and the Annual Report for FY20 reflect the adoption of AASB 16 under the modified retrospective approach, and consequently, FY19
comparatives have not been restated to reflect AASB16 in Appendix 4E or the Annual Report .

To enable a more effective comparison of results versus FY19, FY20 results shown above have been adjusted to exclude the impact of the adoption of AASB 16 and one-off
transactions such as the sale of properties and non-recurring corporate projects. The reported results for FY20 are shown in Appendix 1, along with a reconciliation of the
impact of the adoption of AASB 16 and one-off transactions.
                                                                                                                                                                              5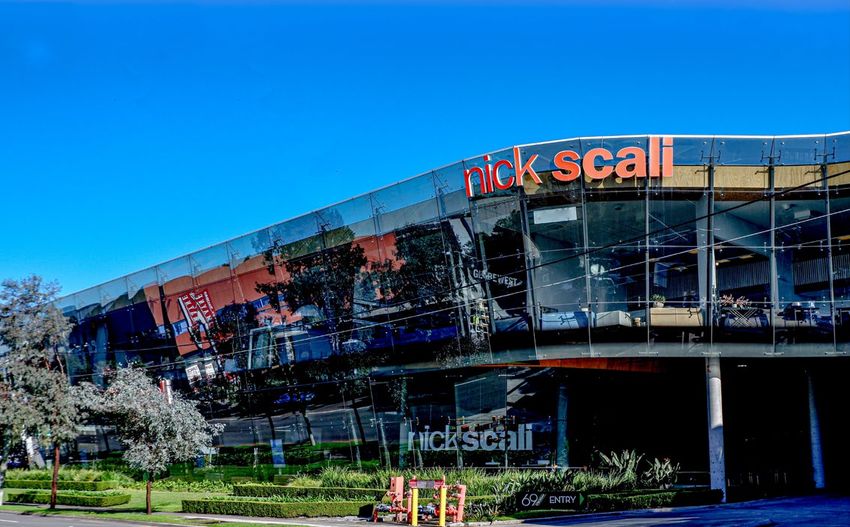
Balance Sheet

                                             FY20                      FY19               Change              Receivables
                                      (ex AASB16)
                                                                                                              • $4.1m of COVID related receivables from ATO (JobKeeper)
Cash                                             63.0                   36.3                + 26.8              and landlords (rent relief) at 30 June 2020
Receivables                                        5.4                   1.1                 + 4.3
                                                                                                              Inventory
Inventory                                        36.3                   37.6                  - 1.3

Fixed assets - Owned                             90.2                   92.7                  - 2.5           • Improved efficiency in the Distribution Centres reduced
                                                                                                                inventory held, increase of stock-in-transit due to strong
Intangibles                                        2.4                   2.4                       -            trading in May and June
Deferred tax                                       2.2                  (0.2)                + 2.4                              Showrooms                            DCs                   Transit
                                                                                                                FY19
Other                                              2.1                   1.7                 + 0.4                                 14.5                              17.6                    5.5

Total assets                                   201.6                  171.6                 + 29.9
                                                                                                                                 Showrooms                        DCs                 Transit
                                                                                                                FY20
                                                                                                                                    15.1                          13.5                  7.6

Borrowings                                       33.7                   33.7                       -

Deferred revenue                                 40.9                   26.5                + 14.4            Fixed Assets
Payables                                         18.3                   17.4                 + 0.9
                                                                                                              • Fixed assets includes $74.5m of owned and occupied retail
Current tax liabilities                            5.6                   0.4                 + 5.2              properties recorded at historical cost, including additional
Provisions                                       10.7                    9.2                 + 1.5              property purchased in Auburn in February 2020
                                                                                                              • Additional retail property acquired after balance sheet date in
Other                                              5.4                  (0.7)                + 6.1              Keswick, South Australia for $6.6m
Total liabilities                              114.5                   86.4                 + 28.1
                                                                                                              Deferred Revenue
Net equity                                       87.1                  85.2                  + 1.9
                                                                                                              • Increase in customer deposits balance reflecting growth of
                                                                                                                order bank during May and June
 The results reported in Appendix 4E and the Annual Report for FY20 reflect the adoption of AASB 16 under the modified retrospective approach, and consequently, FY19 comparatives have not been
 restated to reflect AASB16 in Appendix 4E or the Annual Report . To enable a more effective comparison of results versus FY19, FY20 results shown above have been adjusted to exclude the impact of
 the adoption of AASB 16 .The reported results for FY20 are shown in Appendix 2, along with a reconciliation of the impact of the adoption of AASB.                                                    6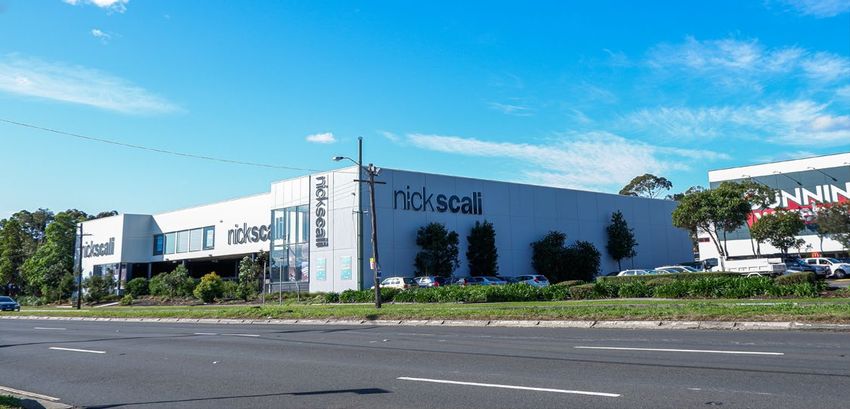
Cashflow

                                                 FY20             FY19          Change             Cashflow Commentary
Receipts from customers                          304.5            295.4            + 9.1           • $26.8m increase in cash on hand due to strong trading in May
                                                                                                     and June, with operating cash flow increased by 38% to
Payments to suppliers/employees                 (229.1)          (232.1)           + 3.0             $62.8m
Operating cashflow before                         75.4             63.3           + 12.1
interest and tax                                                                                   • Strong operating cashflow conversion with 96% conversion
                                                                                                     from EBITDA
Interest received                                   0.5              0.8            - 0.3

Income tax paid                                  (13.1)           (18.8)           + 5.7           • Capex included purchase of a new property ($4.7m),
                                                                                                     relocation of NZ Distribution Centre, various store
Operating cash flow                               62.8             45.4           + 17.4
                                                                                                     refurbishments and other BAU items.

                                                                                                   • Dividends paid in October 2019 ($0.20 per share) and June
Capital expenditure                                (8.6)            (5.2)           - 3.4
                                                                                                     2020 ($0.25 per share)
Proceeds from disposals                             0.1              0.4            - 0.3

Investing cash flow                                (8.5)           (4.8)            - 3.7                                     8.5

                                                                                                                                             36.5
Dividends                                        (36.5)           (39.7)           + 3.2                      62.0
                                                                                                                                                              9.8
Interest paid                                      (0.8)            (1.1)          + 0.3
                                                                                                                                                                              26.8
Financing cash flow                              (37.3)           (40.7)           + 3.5

                                                                                                           Operating       Net Capex       Dividends       One-offs     Retained Cash
                                                                                                           Cashflow
Net cash flow                                     17.0             (0.3)          + 17.3                   & Interest

The results reported in Appendix 4E and the Annual Report for FY20 reflect the adoption of AASB 16 under the modified retrospective approach, and consequently, FY19
comparatives have not been restated to reflect AASB16 in Appendix 4E or the Annual Report .

To enable a more effective comparison of results versus FY19, FY20 results shown above have been adjusted to exclude the impact of the adoption of AASB 16 and one-off
transactions such as the sale of properties and non-recurring corporate projects. The reported results for FY20 are shown in Appendix 2, along with a reconciliation of the
impact of the adoption of AASB 16 and one-off transactions.
                                                                                                                                                                                        7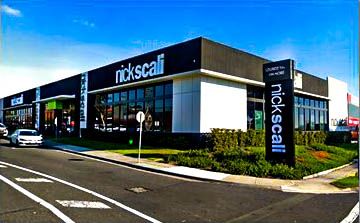
Impact of COVID-19

                    • Traffic down 40%+ in last two weeks of March
Store Network       • All stores closed for between two and four weeks (seven weeks in NZ) in April and May
                    • Traffic up 30% since re-opening
                    • Estimated $9-11m loss in sales due to store closures
Sales               • Since reopening, sales orders have been very strong with May & June sales orders up
                      over 70% with June sales orders exceeding the Company’s previous largest trading
                      month on record by 40%
                    • Delays in supply chain from Asia of up to four weeks in March and April
Supply Chain        • Worked closely with suppliers to ensure delivery lead times back to normal by early
                      May
                    • Online sales channel successfully launched in April 2020
                    • $1m+ average monthly sales orders since launch
Online              • Online segment contributed EBIT in the first quarter of operation at 50%+ EBIT
                      contribution margin
                    •   NCK eligible for JobKeeper subsidy for six months, April to September
                    •   Rent concessions obtained from >85% of landlords
Cost Reduction      •   Reduced store operating hours
                    •   Media spend reduced throughout Q4 FY20
                    • Q4 FY20 operating cashflow of $43m, up 142% from $18m in the same period last year
Cashflow            • Interim dividend payment deferred from 27 March to 27 June
                    • Three new store openings deferred to FY21, two stores to open November 2020
New Store Rollout   • New store opportunities being cautiously considered, focus on ensuring rents are
                      sustainable in the long term
                                                                                                              8
Nick Scali Online
Average transaction value since launch (A$) Online Commentary
• Nick Scali online launched in April 2020 and has performed
strongly since inception
$3,000
• Website traffic up 75% from April to June 2020,
despite reduced advertising spend
$2,500
• Average transaction value of ~$1,800
$2,000
• Contribution margin of 50%+
$1,500
• 60% of sales orders for casegood (lounge, dining,
bedroom furniture) related products
$1,000 • Management see further opportunities for targeted product
expansion into segments where customers are comfortable
purchasing online, without a need to physically view the
$500 product before transacting
• Improvements to the online customer experience and
$0 consumers trust in the platform to drive further
Online Showrooms expansion of the lounge segment online
• Nick Scali Online targeting a $4m EBIT contribution in FY21
9Store Network
Network Changes
Jun 19 Opened Closed Jun 20
Nick Scali Furniture
Australia 55 - - 55
New Zealand 2 1 - 3
Total 57 1 - 58
One new NSF showrooms opened in FY20:
• St. Lukes (New Zealand)
Two new NSF showrooms planned for H1 FY21:
• Bennetts Green (NSW): November 2020
• Wairau Park (New Zealand): November 2020
Two relocations also planned for H1 FY21, with further openings
anticipated in H2 FY21
10Company Owned Properties
Over 37,000sqm of property owned in metro locations, adjacent to major growth corridors
Location State/ Territory Date acquired Site area (sqm) NLA (sqm)
Auburn NSW December 2017 4,763 5,469
Auburn** NSW February 2020 1,490 788
Alexandria NSW July 2010 1,680 1,680 QLD
(1)
Caringbah NSW July 2014 3,396 2,633 WA (1)
SA
Fyshwick ACT November 2012 7,070 4,120* (1)
NSW (4)
Nunawading VIC September 2014 3,163 2,667
Macgregor QLD October 2015 9,701 4,839 ACT (1)
VIC (1)
Keswick SA July 2020 3,582 2,573
Joondalup WA March 2015 2,198 2,198
Total 37,043 26,284
*Note: DA approved to increase NLA to 4,120sqm from 3,427sqm. Construction to be completed during FY21
** Additional property in Auburn located adjacent to existing property owned and operated by Nick Scali was acquired in February 2020.
11Outlook
Outlook
• As highlighted in the Trading Update on 19 June 2020, the
Company experienced a significant rebound in customer
activity during May and June, with sales orders up 65%+ on a
comparable store basis against the prior corresponding
period. Total growth in the combined period was over 70%.
• This exceptional level of growth has continued in July 2020,
with written sales orders up 75% against July 2019, as
consumers continue to reallocate discretionary spending
toward furnishings and homewares.
• As approximately 65% of Nick Scali’s products are made to
order with current delivery lead times of 9-13 weeks, the
recent strong order intake performance means the Company’s
opening order book for FY21 is significantly higher than in
previous years. These orders will be delivered in the first
quarter and contribute to revenue in the FY21 financial year.
• Based on the large increase in written sales orders for the
months of May, June, & July, sales revenue growth for the first
half of FY21 will increase substantially when compared to the
same period last year.
• As a result of the strong sales revenue growth, and after
allowing for 6 weeks of temporary closures in our Melbourne
showrooms, the Company expects first half profit to be up by
at least 50-60% when compared to 1H FY20. This remains
subject to no further extensions of existing restrictions in
Melbourne, further store closures across the network as a
result of government imposed lockdowns, or any material
delays in the supply chain affecting deliveries.
12Important Notice & Disclaimer
Notice on Information
Nick Scali Limited (the “Company”) advises that the information
in this presentation contains general background information
about the Company’s activities as at the date of the
presentation. It is information given in summary form and is
based on information available to the Company that has not
been independently verified.
The information in the presentation contains forward looking
statements which may be subject to uncertainties outside the
Company’s control and therefore no representation or warranty,
express or implied, is made or given as to the accuracy, reliability
or completeness of the information, opinions and conclusions
expressed.
The Company disclaims any obligation or undertaking to
disseminate updates or revisions to any forward looking
statements in this document to reflect any change in
expectations in relation to any forward looking statements or any
change in events, conditions or circumstances on which any
such statement is based.
This presentation should not be relied upon as a
recommendation or forecast by the Company.
This document should be read in conjunction with the FY20
Results Announcement and FY20 Appendix 4E.
13Appendix 1:
NPAT Reconciliation
Reversal of
FY20 Recognition of FY20
Operating Lease One-offs
Underlying AASB 16 Reported
Expense
Sales revenue 262.5 262.5
Cost of sales (97.8) (97.8)
Gross profit 164.7 164.7
Other income 1.9 1.1 1.8 4.8
Operating expenses (100.9) 27.3 2.3 (0.6) (71.9)
EBITDA 65.7 27.3 3.3 1.2 97.6
Depreciation (4.9) (25.1) (30.0)
EBIT 60.8 27.3 (21.7) 1.2 67.6
Net interest expense (0.9) (6.5) (7.4)
Profit before tax 59.9 27.3 (28.3) 1.2 60.2
Taxation (17.8) (8.1) 8.4 (0.5) (18.1)
Net profit after tax 42.1 19.2 (19.9) 0.7 42.1
The results reported in Appendix 4E for FY20 reflect the adoption of AASB 16 under the modified retrospective approach, and consequently, FY19 comparatives have not been
restated to reflect AASB16 in Appendix 4E.
To enable a more effective comparison of results versus FY19, FY20 results shown in this presentation have been adjusted to exclude the impact of the adoption of AASB 16
and one-off transactions such as property transactions and corporate costs. The reported results for FY20 are shown above, along with a reconciliation of the impact of the
adoption of AASB 16 and one-offs
14Appendix 2:
Balance Sheet Reconciliation
FY20 AASB16 AASB16 FY20 Reported
(ex AASB16) Adoption FY20 Impact
Cash 63.0 63.0
Receivables 5.4 (2.8) 2.6
Inventory 36.3 36.3
Fixed assets - Owned 90.2 (0.5) 89.7
Fixed assets - Leased 174.3 (12.6) 161.7
Intangibles 2.4 2.4
Deferred tax 2.2 4.6 0.2 7.0
Other 2.1 2.1
Total assets 201.5 179.0 (15.7) 364.8
Borrowings 33.7 33.7
Lease liabilities 194.8 (13.6) 181.2
Deferred revenue 40.9 40.9
Payables 18.3 (0.3) 18.0
Current tax liabilities 5.6 5.6
Provisions 10.7 (5.0) (1.0) 4.7
Other 5.4 5.4
Total liabilities 114.5 (189.8) 14.9 289.4
Net equity 87.1 (10.8) (0.8) 75.4
The results reported in Appendix 4E and the Annual Report for FY20 reflect the adoption of AASB 16 under the modified retrospective approach, and consequently, FY19 comparatives have not been
restated to reflect AASB16 in Appendix 4E or the Annual Report . To enable a more effective comparison of results versus FY19, FY20 results shown above have been adjusted to exclude the impact of
the adoption of AASB 16 .The reported results for FY20 are shown in Appendix 2, along with a reconciliation of the impact of the adoption of AASB.
15Appendix 3:
Cashflow Reconciliation
Reclassification of
FY20 FY20
Lease Payments as One-offs
Underlying Reported
Financing
Receipts from customers 304.5 304.5
Payments to suppliers/employees (229.1) 29.3 0.6 (199.2)
Operating cashflow before interest and tax 75.4 29.3 0.6 105.3
Interest received 0.5 0.5
Income tax paid (13.1) (0.5) (13.6)
Operating cash flow 62.8 29.3 0.1 92.2
Capital expenditure (8.6) (8.6)
Proceeds from disposals 0.1 9.7 9.8
Investing cash flow (8.5) 9.7 1.1
Dividends (36.5) (36.5)
Repayment of lease liabilities - (22.8) (22.8)
Interest paid (1.1) (6.5) (7.3)
Financing cash flow (37.3) (29.3) - (66.5)
Net cash flow 17.0 - 9.8 26.8
The results reported in Appendix 4E for FY20 reflect the adoption of AASB 16 under the modified retrospective approach, and consequently, FY19 comparatives have not been
restated to reflect AASB16 in Appendix 4E.
To enable a more effective comparison of results versus FY19, FY20 results shown in this presentation have been adjusted to exclude the impact of the adoption of AASB 16
and one-off transactions such as property transactions and corporate costs. The reported results for FY20 are shown above, along with a reconciliation of the impact of the
adoption of AASB 16 and one-offs
16Appendix 4:
Historical Performance
FY16 FY17 FY18 FY19
Sales revenue 203.0 232.9 250.8 268.0
Cost of sales (79.7) (87.3) (93.6) (99.4)
Gross profit 123.4 145.6 157.2 168.6
Other income 1.4 1.6 1.9 2.2
Operating expenses (83.8) (90.5) (95.6) (105.8)
EBITDA 41.0 56.6 63.6 65.0
Depreciation (3.1) (2.8) (3.8) (4.3)
EBIT 37.9 53.8 59.8 60.7
Net interest (expense)/income (0.4) (0.6) (0.9) (1.1)
Profit before tax 37.5 53.2 58.9 59.6
Taxation (11.3) (16.0) (17.9) (17.5)
Net profit after tax 26.2 37.2 41.0 42.1
Earnings per share (Cents) 32.3 46.0 50.6 52.0
Dividends per share (Cents) 23.0 34.0 40.0 45.0
Stores (#) 42 45 51 57
17Appendix 5:
Company Owned Properties
Diversified portfolio of company owned properties across 6 states and territories in Australia
Alexandria, New South Wales Auburn, New South Wales
Nunawading, Victoria Caringbah, New South Wales
18You can also read