Ferronordic
Company Presentation
    August 2020
←
→
Page content transcription
If your browser does not render page correctly, please read the page content below
Ferronordic
Company Presentation
August 2020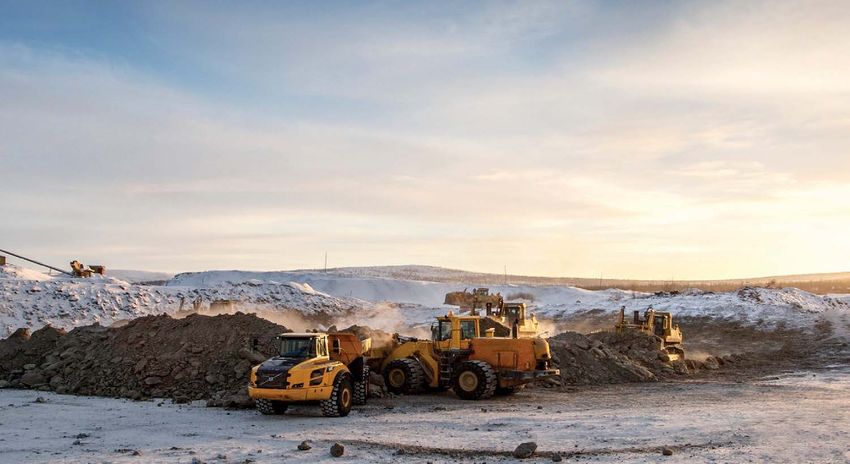
Introduction to Ferronordic
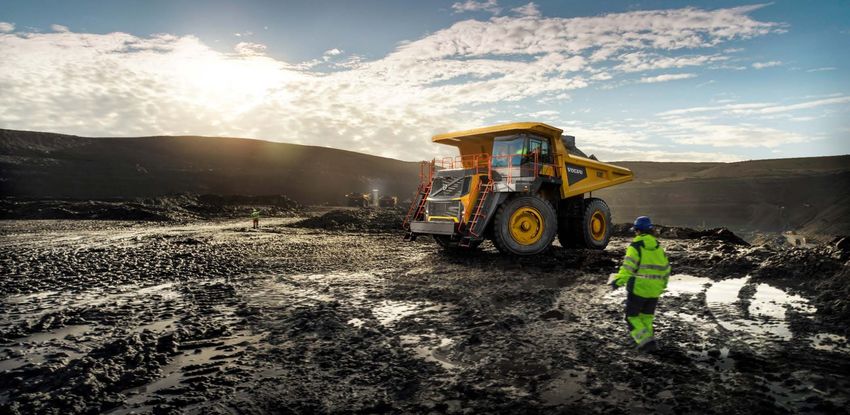
Who is Ferronordic? Development
Service and sales company in the areas of construction
2010 (start) Q2 2020
equipment and trucks
Dealer of Volvo Construction Equipment and certain Employees ~160 1,352
other brands in all of Russia and Kazakhstan1)
Revenue (SEKm)2) 1,184 4,245
Aftermarket partner of Volvo Trucks and Renault Trucks
in parts of Russia
Outlets 6 95
Business partner that offers contracting services, where
we own and operate equipment for our customers
New machine revenue by customer type (2019, Russia/CIS)
Dealer of Volvo Trucks and Renault Trucks in parts of
Oil & Gas
Germany from January 2020 Quarries & 5%
Aggregates
12% Mining
Ferronordic started operations in 2010 and now has 23%
approx. 100 outlets and about 1,400 employees
Road
Vision to be regarded as the leading service and sales Construction
18%
company in our markets
General
Shares in Ferronordic AB (publ) are listed on Nasdaq Forestry
Construction and
Other
Stockholm. 14% 28%
1) In Kazakhstan, Ferronordic is a dealer of Volvo CE and Mecalac since January 2019.
2) Annualized. 2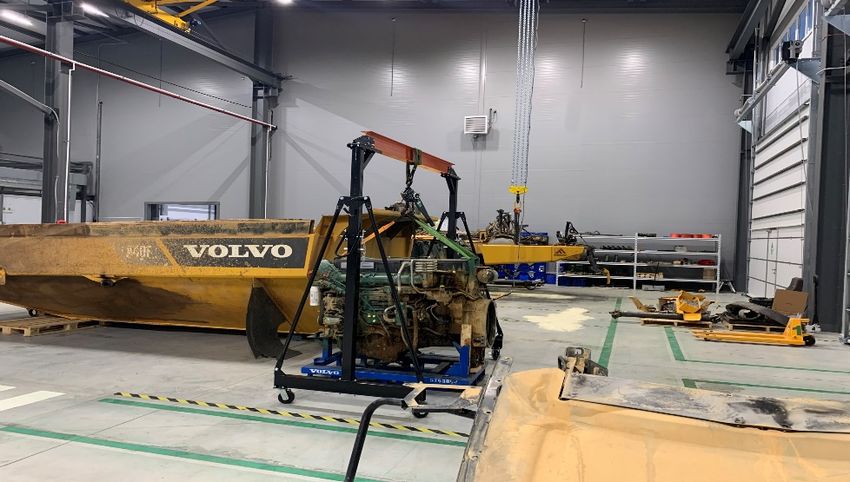
Russia/CIS: A market opportunity
Russia overview Import of construction equipment to Russia (units)3)
Population: ~144 million1) 21 009 20 573
Area: 16.4 million sq. km1)
11th biggest economy in the world1) 13 568
Rich in oil and minerals; top 3 producer of oil, natural gas and gold 11 766 11 725
10 310
World’s largest forest land 8 426
Strong balance sheet and approx. USD 569 billion2) in international
3 573 4 354
currency reserves plus USD 131 billion2) in gold
12.5% government debt/GDP ratio (nominal 2019)
Underinvested infrastructure 2012 2013 2014 2015 2016 2017 2018 2019 LTM
Road density in Russia and Kazakhstan is low Russia’s National Projects – infrastructure and roads
Road density (km road per 100 sq. km land area)1)
192
172 180
2% Roads
129 132 14% Railways
Waterways
67 USD Airports
43
23
20% 155 bln4) 63%
6 14
4
Kazakhstan
Finland
China
Poland
USA
Canada
Sweden
Russia
UK
Germany
France
1) World Bank. 2) Russian Central Bank. 3) Russian import statistics (until April 2020) compiled by Volvo CE. 4) Based on a USD/RUB rate of 73.
3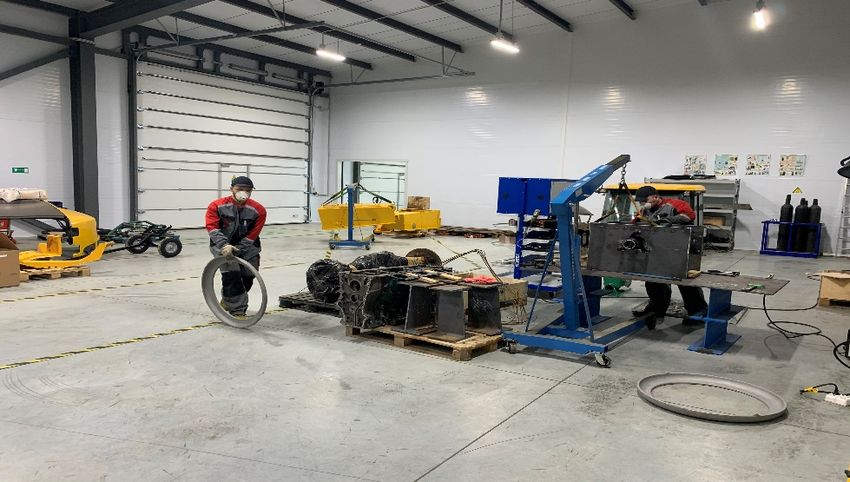
Strategic objectives

Leadership within the                       Expansion into related
market for construction                          business
equipment and trucks                               areas

                      Aftermarket absorption
                       rate of at least 1.0 x

                                            Further development of
Geographic expansion                              contracting
                                                   services

                                                                     4
Product offering
 Brand

                               Volvo & Renault    Volvo & Renault
             Volvo CE                                                   Gensets               Dressta               Rottne           Mecalac
                                   Trucks             Trucks
Example
product
 Year

             2010 (Russia)                                                                                                          2017 (Russia)
           2019 (Kazakhstan)
                                    2020               2012                2014                 2016                 2016         2019 (Kazakhstan)
 Product

                                Full Volvo &                           Own labelled
                                                                                           Bulldozers and        Forwarders and
           Full VCE range      Renault Trucks       Aftermarket      diesel generators                                            Backhoe loaders
                                                                                            pipe layers            harvesters
                                   range                                 (gensets)

                               ~20% of German
 Area

            All of Russia &                        11 locations in                                                                 All of Russia &
                               market for heavy                        All of Russia         All of Russia        All of Russia
             Kazakhstan                                Russia                                                                       Kazakhstan
                                   trucks

           ~57% of 6M 2020     ~22% of 6M 2020
                                                                                       ~11% of 6M 2020 revenue
              revenue             revenue

                                                                                                                                           5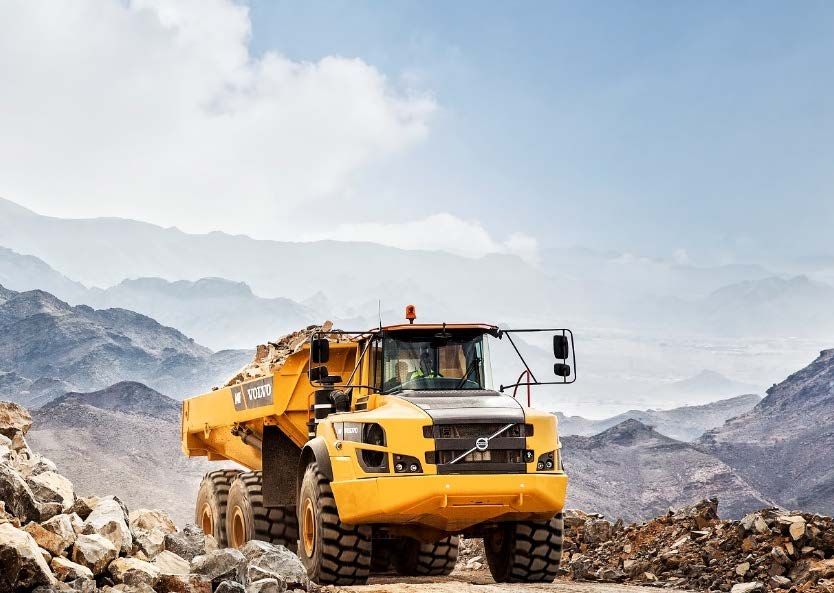
RussiaNationwide coverage
                                                        and Kazakhstan  coverage

                                                                                                                                                                                           Egvekinot

                                                     Murmansk
                                                  Kirovsk

             St .Petersburg          Petrozavodsk
                                               Arkhangelsk
      Velikiy Novgorod
                 Cherepovets
                 Tver           Vologda          Karpogory
    Smolensk                              Velsk
           Kaluga              Yaroslavl       Koryazhma                                         Norilsk                                                                    Yagodnoe
                                                                Vorkuta        Labytnangi
                     Moscow           Sharya        Syktyvkar
           Tula       Ryazan                                                       Noviy Urengoy                                                                                          Magadan
Belgorod                           Kirov                                                                                                                                 Ust-Omchug

                        N.Novgorod                                                                                              Udachniy
       Voronezh   Saransk          Cheboksary
                                   Kazan
                                                 Perm              Sovetskiy
       Rostov-on-Don     Naberezhnye
 Krasnodar                        Samara Ufa              Berezovskiy            Surgut                                                                                 Mar-Kuel
                         Chelny
  Armavir                                                 Ekaterinburg
                                                              Tyumen                                         Kyumba                                      Aldan
     Mineralnye Vody                        Chelyabinsk                                                                                                          Elga
                                  Orenburg          Varna
  Makhachkala                              Novotroitsk                                                                                               Neryungri
                                                                                    Tomsk                                              Vysochaishy
                                  Aktobe                                                                                  Ust-Ilimsk
                                                                                            Kemerovo             Bratsk
                                                                                                Belovo Krasnoyarsk                                                                               Yuzhno-Sakhalinsk
                                                          Karaganda                                                                                          Blagoveshchensk
                                                                                                                                                                                   Khabarovsk
                                                                                                                                             Chita

                                                                                                                                                                                        Artyom
                                                                Almaty

     (84) Ferronordic outlets in Russia and Kazakhstan as of June, 2020

                                                                                                                                                                                                          6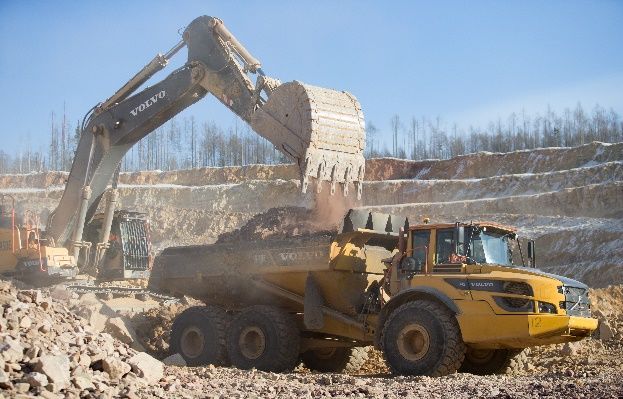
Nationwide coverage
                                                        Germany coverage

(11) Ferronordic outlets in Germany as of June, 2020

                                                                             7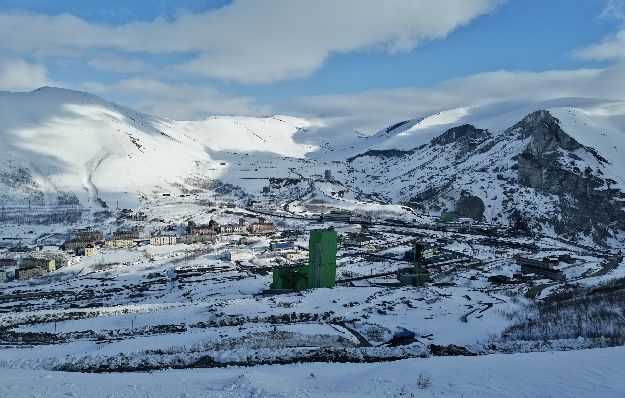
Aftermarket focus
                      Aftermarket sales (SEKm)                    Share of sales (6M 2020) - Russia/CIS
                                                                                           Other 1%
                                                                    Contracting services
1 000                                                                      12%

 900

 800                                                                          Aftermarket
                                                                                  25%
 700
                                                                                           Machine sales
                                                                                              63%
 600

 500
                                                                  Share of sales (6M 2020) - Germany
 400                                                                               Other 7%

 300

 200
                                                                              Aftermarket
                                                                                  26%
 100

   0                                                                                       Truck sales
        2015   2016         2017       2018      2019   6M 2020                               67%

                         Russia/CIS   Germany

                                                                                                           8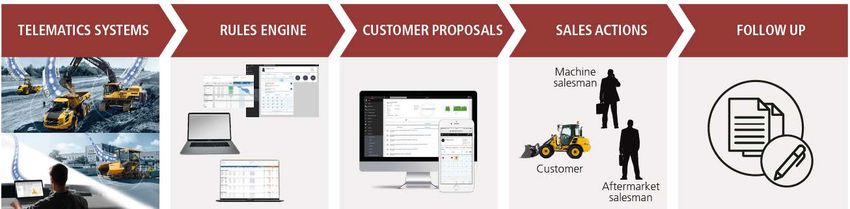
Focus on connectivity and digitalization
Focus on connectivity and digitalisation to grow sales
             to create additional sales

       We are in the forefront of using a system that utilizes telematics systems
       to maximize sales and increase customer satisfaction and fleet efficiency

                                                                                    9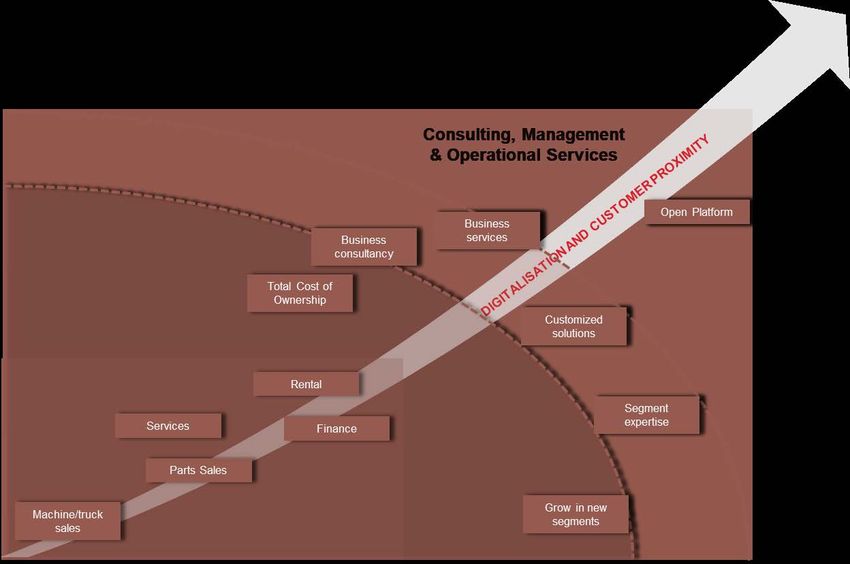
Moving towards further customer integration
Complexity of customer demand

                                               Ferronordic offering

                                                                              10
Focus on connectivity and digitalization
Contracting services - case study
to create additional sales
Client: GV Gold, top 10 gold mining company in Russia
Location: Irkutsk region, Golets Vysochaishy,
Vysochaishy mine
Project staff: 161 people (as at end of June 2020)
Fleet size: 43 units (35 haulers, 1 grader, 7 excavators)
11Component rebuild center
• Opened in Ekaterinburg in Q4 2019
• Rebuild of machines for customers
• Rebuild of engines and gearboxes for Volvo
CE and Volvo and Renault Trucks
• Chop-off and rebuild of machines planned
• Part of the center’s capacity is expected to be
used by Ferronordic’s contracting services
business
• Components to be resold to customers with a
warranty from Ferronordic or installed in used
machines in “Volvo Certified Rebuild” program
• First rebuilt articulated haulers completed in
Q2 2020
• Recycling of used equipment, broader value
offering, and increased local market access
12Strong
Russia/CIS: development
Strong resiliencedespite low level
and growth market
in market with upside
450%
400%
408%
381%
350%
300%
291%
250%
Index = 100 in 2011
200%
199% 155% 154%
150% 134%
113% 110% 109% 106%
140%
92%
100%
100% 99% 103% 96% 69% 63% 63%
61% 55%
95% 45%
50% 71% 73%
19% 23%
0%
2011 2012 2013 2014 2015 2016 2017 2018 2019 LTM
1)
Market (units) Operating profit (SEK)2) Revenue (SEK)
1) Russian import statistics (until April 2020) compiled by Volvo CE.
2) 2011-2016 refer to adjusted EBIT, i.e. operating profit excluding (i) amortization of transaction-related intangible assets and (ii) write-downs of non-current assets in Q4 2016. 13COVID-19 response
Employee Customer Costs and
Health Service Cash
and
Safety
• Strict health and safety • All workshops remained • Reduced headcount and
protocols operational working hours
• Protective equipment for • 24/7 coverage • Temporary and voluntary salary
employees • Remote and virtual support cuts
• Work from home initiatives • Longer rotations for operators • Travel and marketing expenses
when possible in contracting services decline
• Good on-site facilities
• Split team shifts for • Focus on customer uptime and • Minimum capex
mechanics to reduce staff productivity • Tight credit controls
overlap and manage risks
• Improved liquidity position
14Best second quarter to-date despite COVID-19
Unit sales in Russia/CIS grow even as market declines sharply
Robust aftermarket and contracting services performance
Operating profit up on revenue resilience and cost control
Sales in Germany decline quarter-on-quarter in line with market
Strong operating cash flows and lower net debt
9% 7% 8.7% 4%
revenue increase operating profit operating margin EPS increase
growth
15Q2 2020 highlights
Russia/CIS unit sales up 6% despite sharp market
Q2 2020 %
decline in Q2 2020
Q2 2019 Russia / Q2 2020 Q2 2020 change
SEK MM Group CIS Germany Group Group Germany unit sales down QoQ in line with market
New units sold 280 296 146 442 58% Total revenue of SEK 1,203m (+9%)
1,100 958 245 1,203 9%
80% Russia/CIS and 20% Germany
Revenue
64% Equipment and trucks, 24% aftermarket
Gross Profit 221 190 16 207 -6% and 10% contracting services
SG&A expenses as share of revenue was 9.4% in Q2
% Margin 20.1% 19.9% 6.7% 17.2% -2.9pp
2020 vs.10.1% in Q2 2019
Operating profit 98 120 -15 105 7% SG&A in Russia/CIS declined 28% YoY and 14%
QoQ
% Margin 8.9% 12.5% -6.1% 8.7% -0.2pp Operating margin declined to 8.7% on negative
contribution from Germany
Result 73 76 4%
Operating profit increased 7% to Q2 record SEK
5.03 5.24 4%
105m as a result of resilient revenue, cost control and
EPS a one-off customs refund
Strong cash flows from operations as net working
capital decreased to 10% of revenue
126 156 -4 152 21%
EBITDA Net debt declined to SEK 230m
16Financial objectives and dividend policy
KPI Objective Q2 2020 LTM
Triple 2016 revenue in 2.2 x
Revenue
Russia/CIS by 2021 2016 revenue
Operating margin 6-8% 8.5%
Net Debt / EBITDA 0-2 x 0.4 x
• Ambition to distribute at least 25% of the result to shareholders
Dividend Policy • Board takes several factors into consideration when proposing
the dividend level, including expansion opportunities, financial
position and investment needs
17OUTLOOKOutlook
– CEO COMMENT
“The outbreak and the measures to contain the spread of COVID-19 have caused
great uncertainty across our markets. For the rest of 2020, we may continue to
face various degrees of disruption in supply, demand and customer interfacing.
Looking ahead, we are confident that our business model, which is built on a
great team and a robust aftermarket business, will remain resilient. While we
expect our markets to decline in 2020, we believe that we may have seen the
lows. In a longer perspective, we remain positive as we believe that the
underlying fundamentals and business opportunities in our markets are strong.”
18Q&A
19Appendix
20Significant need to improve infrastructure
Road density in Russia and Kazakhstan is low Rail density is low too
Road density (km road per 100 sq. km land area)1) Rail density (km railway per 1,000 sq. km of land area)2)
122
192
180
172
96
129 132
75
61
53
67
43 24
20
17
23
14 7
6 5 5 6
4
Canada
USA
Finland
France
Poland
Russia
China
UK
Germany
Sweden
Kazakhstan
USA
Czech Rep.
Canada
Finland
France
Poland
Russia
China
Germany
Sweden
Kazakhstan
Slovakia
Sources: 1) World Bank 2) Global Competitiveness Report 2019
21Strategic
Nationalobjectives
Projects
Demography
[USD 49 bln] 2%
Environment Roads
14%
[USD 64 bln] [USD 75 bln]
National
Projects USD 175 bln
[USD 400 bln] 20% 63%
Healthcare Infrastructure
[USD 27 bln] [USD 100 bln]
Housing, trade,
digital economy
and others
[USD 90 bln]
Roads Railways Waterways Airports
Source: Russian Government Information Bulletin, February 2019.
Note: based on a USD/RUB rate of 63.5 22Pent-up demand
Import of construction equipment to Russia (units)
Young market – sales of high-quality construction equipment only took off 2006/2007
21 009 20 573
Import of high-quality brands 18 627
gains momentum 17 489
13 525 13 568 Market starts to recover
after 2014-2015 economic
downturn 11 766 11 725
10 310
8 004 8 426
Mainly local machines of
lower quality
4 436 4 354
3 573
2 655
1 685 1 649
1 131
2003 2004 2005 2006 2007 2008 2009 2010 2011 2012 2013 2014 2015 2016 2017 2018 2019 LTM
Import of construction equipment to Russia (units)
Source: Russian import statistics (until April 2020) compiled by Volvo CE.
Note: Excluding Chinese brands, bulldozers, rigid dump trucks and forestry machines. 23Pent-up demand
Germany - Europe’s largest truck market
Heavy truck registrations in Germany (units)
80 000 115
67 797 70 264
70 000 66 441 68 450 110
65 280
60 218 61 940
60 000 58 574 105
55 167 55 215
52 972
48 827
50 000 100
40 322
40 000 95
30 000 90
20 000 85
10 000 80
0 75
2008 2009 2010 2011 2012 2013 2014 2015 2016 2017 2018 2019 LTM
Heavy truck registrations Average truck toll mileage index*
Source: Germany registrations data compiled by Volvo Trucks (until June 2020). Federal Statistical Office Germany (Destatis).
* Truck toll mileage index is a fixed base index that traces the development of the mileage of heavy trucks (with four or more axles) on German federal motorways and is calculated from digital process data from the truck toll collection system. 24Worksite Applications_2_Machine Performance 271114
You can also read