Kesko investor presentation - June 2017
←
→
Page content transcription
If your browser does not render page correctly, please read the page content below
Kesko investor presentation

June 2017
K Group the Third Biggest Retail Operator in Northern Europe

• K Group’s retail sales €13.2bn (pro forma 2016)

• K Group formed by Kesko and 1,088 K-retailer entrepreneurs

• Operations in nine countries

• 45,000 trading sector professionals, over 30,000 in Finland

• Significant social impact in Finland

• Kesko shares listed on Nasdaq Helsinki with €4.5 bn market
  capitalisation and close to 42,000 shareholders (5/2017)
2
The Core of Kesko’s Strategy is Profitable Growth in Three
Strategic Areas
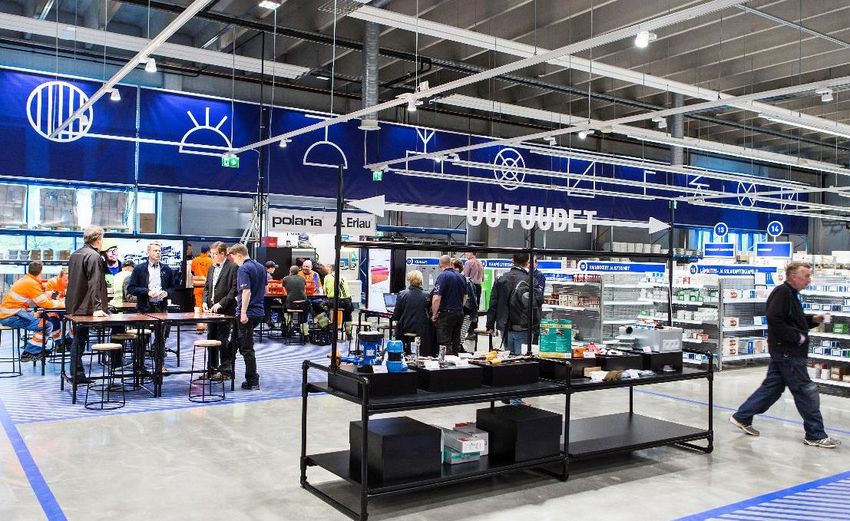
    Grocery trade              Building and technical trade   Car trade

    Retail sales €6.7bn*       Retail sales €5.6bn*           Retail sales €0.9bn*
    1,400 stores in Finland    700 stores in 9 countries      VW, Audi, Seat, Porsche
                                                              and MAN trucks
    #2 in the Finnish retail   #1 in Northern Europe
    market                                                    #1 in Finland
    #1 in Finnish food
    service business
                                     *Pro forma 2016
3
Net Sales and Comparable Operating Profit by Division

                     Net sales 2016                                  Comparable operating profit 2016
          €849 million                                                  €29.5 million
                         8%                                                             10%

€4,100 million 40%       €10,180                                                        €272.9
                                      52% €5,236 million      €97.9 million 32%                   58% €175.9 million
                         million                                                        million

                                              Grocery trade
                                              Building and technical trade
                                              Car trade

4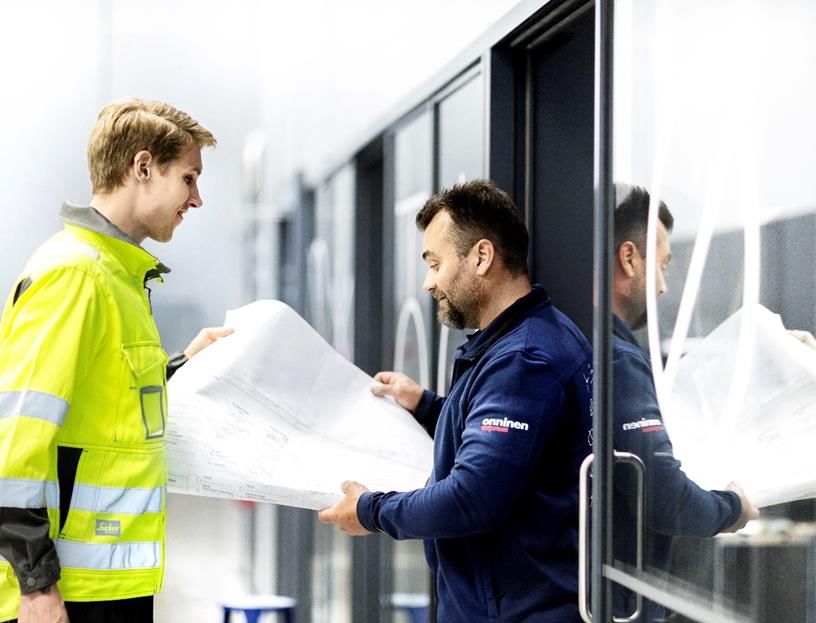
Global Megatrends Identified to Effectively Anticipate and
Respond to Future Challenges and Opportunities

         Global         Digital    Urbanization,    Consumers'       Corporate
       economy                                                                      Climate
                      revolution   single person     knowledge     responsibility
    - international                                                                 change
                                    households     and power has    and strong
       operators                    and ageing        increased       brands
    challenge local                 population
      companies

5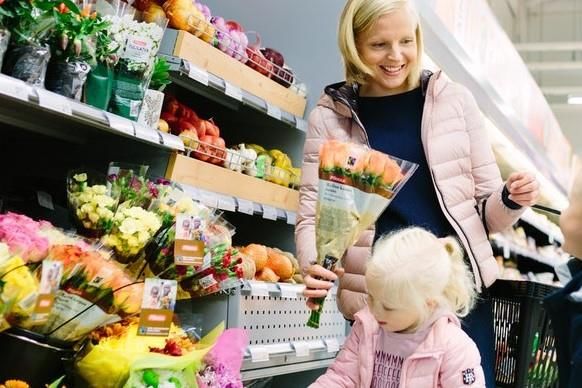
Growth Strategy Implementation is Progressing

                                                                                                                                                     Real estate
                                                                                                                                      Agricultural arrangement
                                                                                                                        Chain of      trade: sale of in the Baltics
                                                                                                                        Health,       K-maatalous
                                                                                                       Machinery
                                                                                                                        Beauty &
                                                                                      Acquisition of   trade: sale of
                                                                                                                        Wellbeing
                                                                        Divestment    AutoCarrera      Yamarin boats,   stores with
                                                                        of K-ruoka,                    45% interest     Oriola
                                                          Acquisition
                                                                        Russia                         in Baltic
                                            Acquisition   of Onninen
                                                                                                       subsidiaries
                                            of Suomen
                             Kesko Senukai Lähikauppa
                 Real estate arrangement
                 arrangement in the Baltics
    Divestment
                 in Finland
    of Anttila

                       ONE UNIFIED                  THE CUSTOMER AND QUALITY – IN EVERYTHING WE DO

6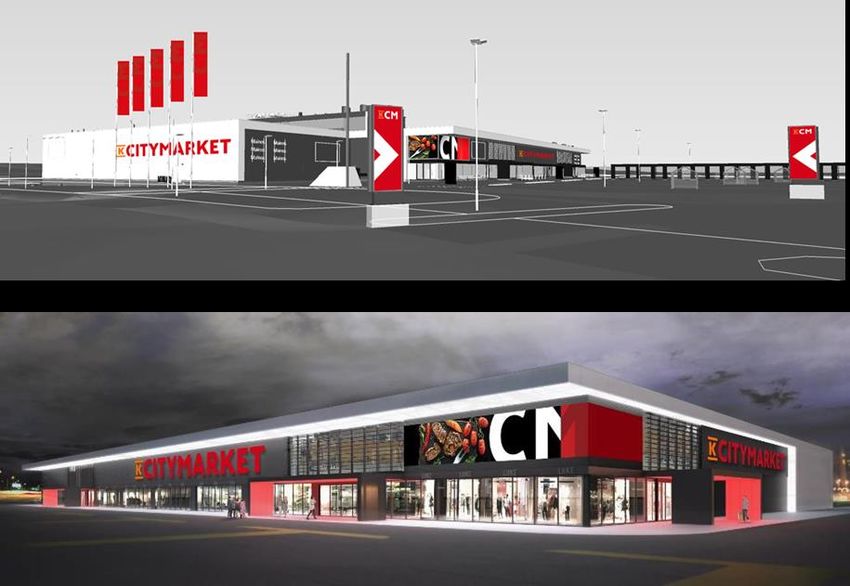
New Digital Services by Divisions

      Grocery Trade    Building and Technical Trade   Car Trade

7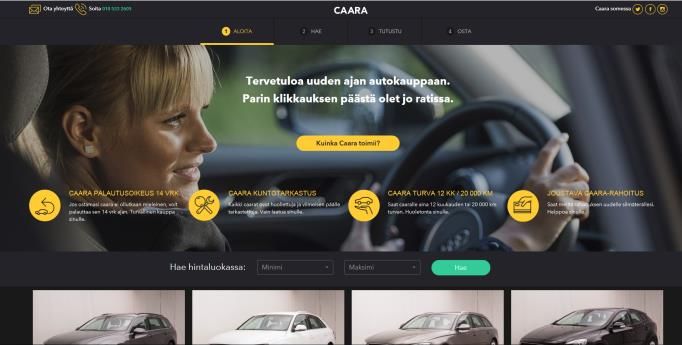
Kesko is the World’s Most Sustainable Retail Operator*

• Kesko’s responsibility programme contains both short-term and long-
  term objectives with six themes

• Case: 100% renewable energy
    • All electricity purchased by Kesko in Finland is renewable since
      2017. The amount of electricity purchased will be app. 540 GWh,
      accounting for app. 1% of all electricity consumed in Finland.
    • K-Group also increases own renewable energy production and is
      Finland’s biggest producer and user of solar power.
    • The transfer to renewable electricity also supports the K-Group’s
      commitment to the Paris Climate Agreement’s targets and the UN
      Sustainable Development Goal 7 ‘Affordable and clean energy’ and
      Goal 13 ’Climate action’.                                           *The Global 100 list, Corporate Knights Inc.
8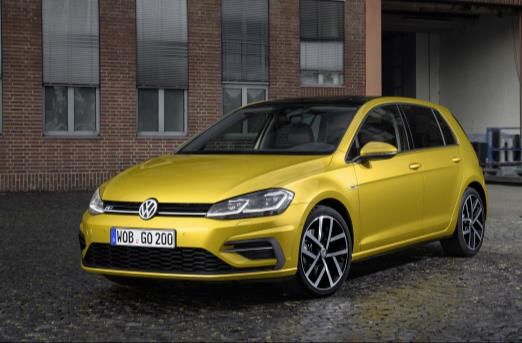
Grocery Trade

Grocery Trade Megatrends

     Population    Urbanisation   More individual      Level of      Corporate      Digitalisation
       ageing     and growth of    consumption      requirements   responsibility
                  single-person       habits          and price
                   households                        awareness

10
Cornerstones of Grocery Trade Strategy
The most customer-oriented and inspiring food stores
Finland’s widest and most comprehensive food store network
The best digital solutions in the trading sector
Retailers guaranteeing quality
Strong renewal: chain brands and marketing
11Grocery Trade Division
2016
2%
13%
Net sales €5,236m
Operating profit* €176m 12%
Net sales 2016
Operating margin* 3.4%
ROCE* 21.3%
73%
* comparable
In 2016, the Finnish grocery trade market was worth app. €16.8bn (incl. VAT). Finland SLK Kespro Russia
12Retail Sales and Number of Stores of the Grocery Trade
Retail sales pro forma # stores at Concept
2016 €m, VAT 0% 31.5.2017
1,503+575=2,077 81 Hypermarket
1,764 228 Supermarket
* 1,870 830 Neighbourhood store
Neste K and others 171 160 Service station
* 2016 sales include K-Market, Siwa and Valintatalo chains’ sales
13Building and Technical Trade
Megatrends Strengthen B2B Growth

      Building and      Consumers      Increasing        Rising       Omni-channel
       renovation      increasingly     need for      standard of       customer
      increasingly   often outsource   renovation        living       experience is
        technical,      building to     building     increases the    coming more
       regulation     professionals                 use of services    important
        increases

15
Cornerstones of the Building and Technical Trade Strategy
New building and technical trade entity - better services and achievement of synergies
For B2B customers, unique entity of products and services in terms of extensiveness
For B2C customers, easiest shopping and the most comprehensive total solutions
Biggest growth potential in Finland, the Baltics and Scandinavia
Strengthening of online trade and strong development of digital services
16Building and Technical Trade Division
2016 Agricultural and
machinery trade
Net sales €4,100m
Furniture trade
Operating profit* €98m Sports trade Building and technical
trade business
Operating margin* 2.4% Retail sales 2016
(pro forma)
ROCE* 9.8%
* comparable
17
17B2B Customers B2C Customers
• Largest customer groups are contractors and • Renovators or builders with a DIY project
construction companies, 80% of sales
• Consumers with a need for a special DIY product
• Building materials, HEPAC* and electricals account
for 75% of sales • Main product lines are building materials, home
furnishing, decoration and tools
* HEPAC=heating, plumming and air conditioning
18Operations in 9 Countries
Market share 2016
Finland • K-rauta and Onninen clear #1 in Finland
Sweden
• Sweden as the biggest market in Nordics offers promising
Norway
growth opportunities
Estonia
Latvia
• Byggmakker #3 in Norway and Onninen strong in electricals
Lithuania
Poland • Kesko Senukai #1 in Baltics and Belarus
Russia
Belarus • K-rauta has strong presence in St. Petersburg and Moscow
0 10 20 30 40 50
Building & home improvement Onninen % • Onninen well positioned in Poland
19Car Trade
Megatrends Impacting Car Trade

     Car sharing and   Autonomous   Limitations in   Electric cars   User-friendly
       short-time        driving    emissions and                    multi-channel
         leasing                       car use                         services

21
Cornerstones of the Car Trade Strategy
Increasing business in cooperation with Volkswagen Group
Increasing service business independent of principals
Developing the multi-channel customer experience
22Car Trade Division
2016
Net sales €849m 27%
Operating profit* €29m
50%
2016
Operating margin* 3.5%
14%
ROCE* 23.8%
8%
New car retailing Used car retailing
* comparable
After sales retailing Importing / sales to dealers
23Financials and Outlook
Kesko’s Financial Objectives

• Return on capital employed, target: 14%

• Return on equity, target: 12%

• Interest-bearing net debt/EBITDA, target: less than 2.5

• Kesko's dividend policy: At least 50% of comparable earnings per share distributed as dividends, taking into
  account the Company's financial position and operating strategy

25
Enhancing Cash Flow Generation
•    Further growth in net sales and operating margin in strategic growth areas

•    Synergy benefits
       •   Suomen Lähikauppa progressed better than expected, full annual impact above €30m from 2018
       •   Onninen progressed as expected, full annual impact of €30m from 2020

•    Executing the €50m cost savings program, full impact in 2017

•    Capital expenditure in 2015-2017 c. €750m, annual capex level below €200m after 2017 (excl. acquisitions)
       •   In grocery trade less store site capex needs after 2017
       •   Reduced capex per store need in building and technical trade

•    Target to improve NWC efficiency by €50m

•    Potential further business and real estate divestments
26
Profitable Growth – Key Value Driver
€m
12000
+17.3%
+9.3% +3.3% +7.8% +2.4% -3.8%
10000
+3.9% -2.6% -4.3%
-11.9%
8000
6000
4000
2000
0
2007 2008 2009 2010 2011 2012 2013 2014 2015 2016
Finland Other countries
27
27Operating Margin – Targeting Further Growth
€m %
400 4
350
3.4
300 3.1 3
2.9 2.8 2.7
250 2.6 2.6
2.3 2.4
200 2
1.8
150
100 1
50
0 0
2007 2008 2009 2010 2011 2012 2013 2014 2015 2016
Comparable operating profit Comparable operating margin
28Annual Capex Level Below €200m After 2017
(Excl. acquisitions)
€m
800
700
600
500
400
300
200
100
0
2006 2007 2008 2009 2010 2011 2012 2013 2014 2015 2016
Capital expenditure in store sites Acquisitions Other capital expenditure
29Target to Enhance Cash Flow Generation
€m
500
31 217
300
379 438 382 414
244 304 276
100 216 170
137
-85 -46
-100 -152 -182
-240
-441 -391
-300 -501
-500
-700
2007 2008 2009 2010 2011 2012 2013 2014 2015 2016
CF from operating activities CF from investing activities
30
30Steady Growth in ROCE
Comparable
%
16 Target
14%
14.0
12 13.1
11.7 11.9
9.8 9.9
8 9.0
4
0
2010 2011 2012 2013 2014 2015 2016
31Good Dividend Distribution to be Continued
€
3
2.50
2.21
2.01 2.00
2 1.78 1.84
1.68 1.65 1.70
1.60
1.44 1.47 1.50
1.40
1.30
1.20 1.20
1.00
1 0.90
0.71
0
2007 2008 2009 2010 2011 2012 2013 2014 2015 2016
Comparable EPS DPS
32Outlook Estimates for the outlook of Kesko Group's net sales and comparable operating profit are given for the 12-month period following the reporting period (4/2017-3/2018) in comparison with the 12 months preceding the end of the reporting period (4/2016-3/2017). The general economic situation and the expected trend in consumer demand vary in Kesko’s different operating countries. In Finland, the trading sector is expected to grow. In the Finnish grocery trade, intense competition is expected to continue. The market for the Finnish building and technical trade is expected to grow. In Sweden and Norway, the market is expected to grow but at a somewhat slower rate. The trend in the Russian market is expected to remain modest. In the Baltic countries, the market is expected to grow. Kesko Group's net sales for the next 12-month period are expected to remain at the level of the preceding 12 months. The net sales expectation takes account of the divestment of the K-maatalous business expected no later than the third quarter of 2017, the divestment of the Russian grocery trade in November 2016, as well as the transfer of the stores included in the acquisition of Suomen Lähikauppa to retailers and store closures. The comparable net sales for the next 12-month period are expected to exceed the level of the preceding 12 months. The comparable operating profit for the next 12-month period is expected to exceed the level of the preceding 12 months. 33
Growth Strategy Implementation Continues

• Increasingly unified K Group focusing on growth areas

• Integrations and synergies of acquisitions

• Capture the significant growth potential in the building and technical trade profitably

• Continued improvement of cost effectiveness

• Improvement of customer experience in both stores and digital channels

34
Investor Calendar and Channels

             July 27:               October 25:             Monthly:
     Interim Report H1/2017   Interim Report 9M/2017       Sales figures

www.kesko.fi/en/investor           IR@kesko.fi         Twitter.com/Kesko_IR

35
Appendix: Interim Report Q1/2017
Highlights

•    Net sales increased in all divisions and profitability remained at a good level despite renewal projects

•    Extensive chain renewal in grocery trade is progressing well

•    Building and technical trade division is growing in B2B trade, operating profit continued to improve

•    Car trade sales and profit strengthened, Porsche is growing strongly

•    Continued focus on growth areas, withdrawal from machinery trade and divestment of K-maatalous

•    Kesko and Oriola are building a new kind of health and wellbeing chain in Finland

37
Key Performance Indicators

                                                 Q1/2017    Q1/2016
 Net sales, €m                                     2,597      2,013
 Net sales growth, %                                +29          -3

 Operating profit*, €m                              28.7       32.3

 Operating margin*, %                                 1.1       1.6
 Profit before tax*, €m                             33.6       34.5
 Earnings/share*, €                                 0.29       0.26
 Return on capital employed*, %, rolling 12 mo       11.2      12.4
 Return on equity*, %, rolling 12 mo                 9.6        8.7

 * Comparable

38
Net Sales by Division Q1/2017
Car trade
€245m 9%
Growth 8.9%, comparably +3.4%*
Grocery trade
43% €2,597m 48% €1,243m
Growth 13.6%, comparably +0.1%
Building and technical trade
€1,112m
Growth 59.9%, comparably +5.9%
39Net Sales by Quarter
Q1/2017 growth 29.0%, comparably +2.4%
€m 2015 2016 2017
3,000
2,792 2,765
2,597 2,610
2,500
2,227 2,203 2,166
2,082 2,013
2,000
1,500
1,000
500
0
Q1 Q2 Q3 Q4
40Operating Profit by Quarter
Comparable
€m
100 98 2015 2016 2017
82
80 76 79
63
60 59
40
32
27 29
20
0
Q1 Q2 Q3 Q4
41Return on Capital Employed by Division Q1/2017
Comparable, rolling 12 mo
%
30
23.3
20.7
20
11.2
10 9.2
0
Grocery trade Building and technical trade Car trade Group total
42Strong Financial Position
31.3.2017 31.3.2016
Equity ratio, % 47 55
Liquid assets, €m 365 746
Interest-bearing net debt, €m 226 -311
Cash flow from operating activities, Q1, €m -57 -96
Cash flow from investing activities, Q1, €m -34 -53
43UUSI KUVA Grocery Trade
Grocery Trade

• K Group’s grocery sales +15.8%, comparably excluding
  Suomen Lähikauppa +0.2%

• Profitability at a good level thanks to growth, efficiency
  measures and divestment of Russian operations

• Suomen Lähikauppa’s profit impact negative owing to
  seasonal fluctuations and extensive change programme

• Renewal measures progressing as planned in all chains

45
New K-Market Chain – Finland’s Most Comprehensive
Neighbourhood Store Network
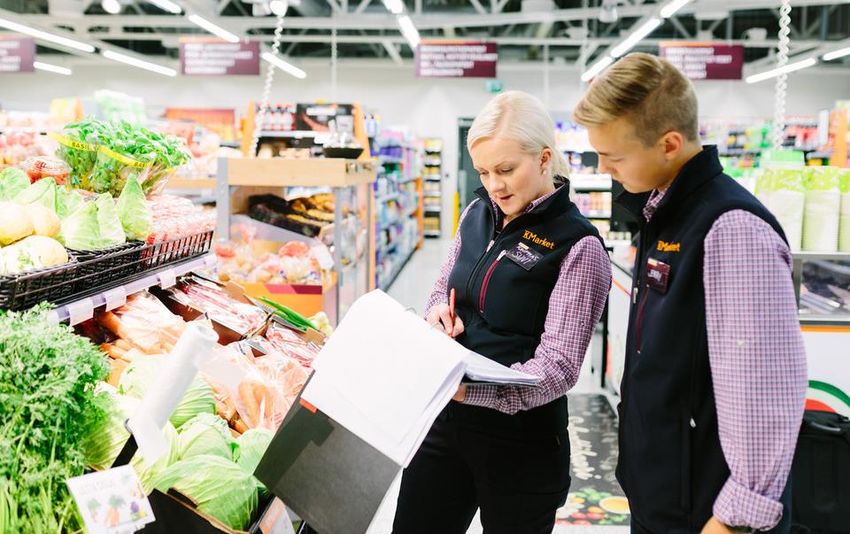
• Over 800 K-Markets provide a solid platform for the
  implementation of neighbourhood market strategy

• 407 Siwas and Valintatalos converted into K-Markets
  and 57 of them transferred to retailers
     • Sales and customer flows increased by over 10%
     • Purchasing and logistics operations completely
       integrated

• By the end of 2018, all stores transferred to retailers

• Annual synergy level over €30 million as of 2018

46
Net Sales
Q1/2017 growth 13.6%, comparably +0.1%
€m
1,500
1,243
1,094
1,000
500
0
Q1/2016 Q1/2017
47Operating Profit
Comparable
€m
40
31.3
30
26.4
20
10
0
Q1/2016 Q1/2017
48Building and Technical Trade
Building and Technical Trade • Net sales growth 59.9%, in local currencies excluding Onninen 5.9% • Strong sales growth in B2B trade continued • Good position in growing markets • Comparable operating profit increased despite renewal projects 50
Integration of Onninen into Kesko Progressing Well

• Strongest B2B sales entity in the market

• Onninen’s sales growth 12% and operating profit €2.5
  million (€-3.0 million, pro forma 2016)

• B2B business organised into a single entity

• Reorganisation programmes are progressing in
  Poland and Sweden

• Synergies being realised as planned, annual level of
  €30 million as of 2020

51
New K-Rauta Has Got Off to a Good Start

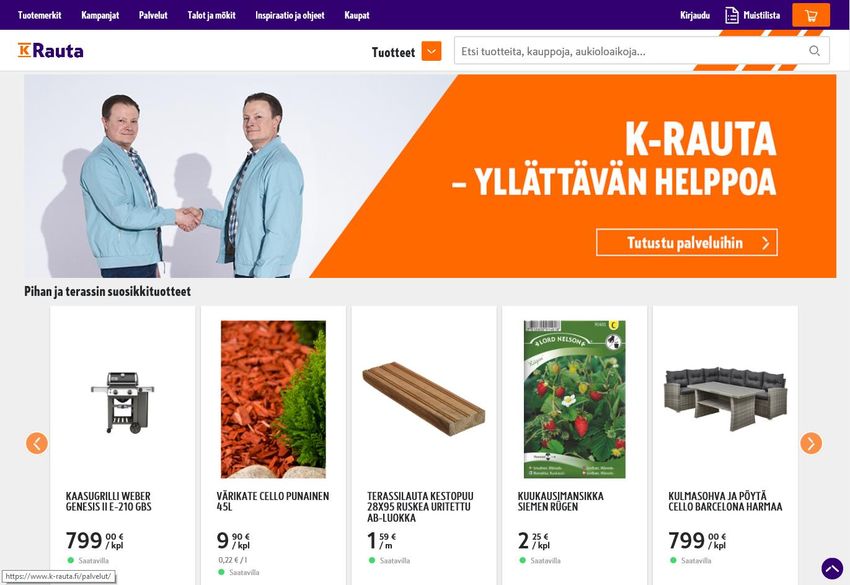
• K-Rauta and Rautia combined into new K-Rauta chain

• Finland’s largest and most diversified network of
  building and home improvement stores at 139 locations

• Launch of renewed k-rauta.fi online store

• Emphasis on the best customer experience of the
  sector both offline and online

• K-Rauta brand to be renewed in all operating countries

52
Net Sales
Q1/2017 growth 59.9%, comparably +5.9%
   €m
1,500

                                          1,112

1,000

               695

 500

     0
             Q1/2016                     Q1/2017

53
Operating Profit
Comparable
€m
10
8
6
4
3.0
2
0.3
0
Q1/2016 Q1/2017
54Car Trade
Car Trade

 • Car trade net sales are growing and profitability at a
   good level

     • Strong growth in first time registrations of vans
       +49% (market +30%)

     • Long delivery times have affected first time
       registrations of passenger cars; situation will improve
       as new models become available

 • Integration of Porsche is progressing well,
   +29% increase in customer orders

 • 10% increase in overall order books                           Henri Kontinen, #1 in the ATP tennis doubles ranking,
                                                                 appointed Porsche Brand Ambassador in Finland

56
Net Sales
Q1/2017 growth 8.9%, comparably +3.4%
€m
300
245
225
200
100
0
Q1/2016 Q1/2017
57Operating Profit
Comparable
€m
15
10.0
10 9.4
5
0
Q1/2016 Q1/2017
58You can also read


