Investor & Analyst Presentation - December 2018 Dr. Cornelius Patt, CEO Andreas Grandinger, CFO
←
→
Page content transcription
If your browser does not render page correctly, please read the page content below
Investor & Analyst Presentation
December 2018

Dr. Cornelius Patt, CEO
Andreas Grandinger, CFO
Safe Harbor Statement

This document includes supplemental financial measures that are or may be non-GAAP financial measures. These supplemental
financial measures should not be viewed in isolation as alternatives to measures of zooplus’ financial condition, results of
operations or cash flows as presented in accordance with IFRS in its Consolidated Financial Statements. Other companies that
report or describe similarly titled financial measures may calculate them differently.

This document contains statements related to our future business and financial performance and future events or developments
involving zooplus that may constitute forward-looking statements. We may also make forward-looking statements in other
reports, in presentations, in material delivered to stockholders and in press releases. In addition, our representatives may from
time to time make oral forward-looking statements. Such statements are based on the current expectations and certain
assumptions of zooplus’ management, and are, therefore, subject to certain risks and uncertainties. A variety of factors, many of
which are beyond zooplus’ control, affect zooplus’ operations, performance, business strategy and results and could cause the
actual results, performance or achievements of zooplus to be materially different from any future results, performance or
achievements that may be expressed or implied by such forward-looking statements or anticipated on the basis of historical
trends. Further information about risks and uncertainties affecting zooplus is included throughout our most recent annual and
interim reports, which are available on the zooplus website, www.zooplus.de. Should one or more of these risks or uncertainties
materialize, or should underlying assumptions prove incorrect, actual results, performance or achievements of zooplus may vary
materially from those described in the relevant forward-looking statement as being expected, anticipated, intended, planned,
believed, sought, estimated or projected. zooplus neither intends, nor assumes any obligation, to update or revise these forward-
looking statements in light of developments which differ from those anticipated.

Due to rounding, numbers presented throughout this and other documents may not add up precisely to the totals provided and
percentages may not precisely reflect the absolute figures.

                                                                                  Investor & Analyst Presentation – December 2018 | page 2
European pet supplies market is a very attractive
market

Pet supplies market in Europe 2008-2020e (gross sales € bn)
                                     CAGR +3% p.a.
                                                                           29         » Ownership of pets is on the
                                                                 26                     rise in Europe
                                                       25   26
                                            23    24                                  » Humanization of pets drives
                           22      23                                                   spending
                   21
  20       20
                                                                                      » Market is resilient through
                                                                                        economic cycles
                                                                                      » Consumables recurring
                                                                                        revenue – subscription like
                                                                                      » No technology and fashion
                                                                                        obsolescence risk
                                                                                      » Low product return rates

 2008 2009 2010 2011 2012 2013 2014 2015 2016 2017                    …   2020e

                                                                            Investor & Analyst Presentation – December 2018 | page 3
Source: Euromonitor 2016 and zooplus estimation
The online share is expected to continue to grow
far beyond 2020

Current online share and long-term hypothesis (€ bn)

  Total
market             25                      26                       29                                   > 30
(gross)

Offline
              95-96%                   92-90%                   80-85%                                  < 50%
 share

                                                                                                                            Online market
                                                                                                        > 50%                opportunity
                                                                                                                                   > 15
Online                                                          15-20%
 share           4-5%                   8-10%
                2014                     2017                    2020e                              Long-term 1

 Long-term growth potential of online should leave enough growth for zooplus after 2020
1 zooplus estimation; assuming successful shift of pet food grocery segment to online   Investor & Analyst Presentation – December 2018 | page 4
Sales continue to grow super linear – high retention
core of the growth path

                                                                              +233-255

                                                                                          1,344 –
                                                                                          1,366
                                                                 +202
                                                                                                       New customer
                                                                        1,111                          sales (1st year)
                                                   +198
                                                          909
                                     +168                                         9M:
                                                                                  95%1
                       +136                 711                                                        Repeat
                                                                 93%
                                                                 93%1                                  customer sales
          +88                 543
                                                   92%
                407                                94%1
   319                               94%
                                     93%1
                       91%
          85%
                                                                                          21% –        Sales growth
  30%           28%           33%           31%           28%           22%                23%         vs. PY
   2012         2013          2014          2015          2016          2017               2018e       1) in local currencies

                                                                  Investor & Analyst Presentation – December 2018 | page 5
zooplus reached No. 2 position in Europe in 2017
and is well on its way towards market leadership

Net sales and growth 2017 – European market (EUR bn)

1               1)
                             + 6%                                Online ~0.06            1.7 (+100 EUR m)

2                            +22%                                  1.1 (+202 EUR m)
                                                                                                            Strategic goals
                                                                                                            Close the gap towards the
                                                                                                            current number 1 in
3
               2)
                             +7%          Online ~0.05         1.0 (+65 EUR m)                              Europe
                                                                                                            Working towards market

4                    3)
                             +22% n/a                                                                       leadership in the total
                                                                                                            market (online and offline)

              Benefitting from all the advantages of size and market leadership
Source: Company data for 2017 figures; zooplus assumptions   1) Net sales estimated from gross sales 2) Includes services 3) amazon international growth rate
                                                                                                 Investor & Analyst Presentation – December 2018 | page 6
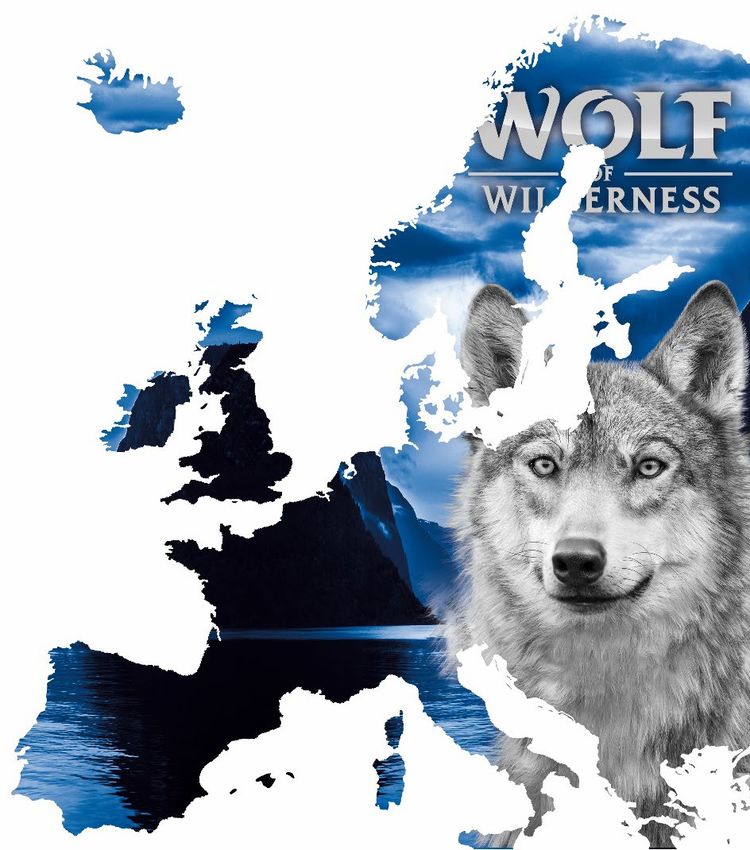
zooplus is the online market leader in all geographies of
Europe – double digit sales growth in all regions in 9M 2018

                                                                                                            DK, SE,
» Sales growth 9M 2018:                                                                                     FI, NO
  + 23% (+23% fx-adjusted)
                                                                                                     70m              +24%
                                                                                                      4.5%

                                                                                 +21%
                                                                96m            (fx-adj.)
                                                                2.4%
                                                                                              +21%                          80m          +39%
                                                                      UK, IE      124m                                      12.2%
                                                                                                                                    PL
                   Total market 2017                                               7.0%
                          23bn                                                 NL, BE, LU
                                                                                                   335m
Sales zooplus in                                                                                                           +16%
2017                                                                                                 6.2%                                62m         +39%
                                           Sales growth in
                                                                                                                                          4.5%
                          1,111m           9M 2018                                                             D,A,CH             HU             CZ, SK, HU, RO,
                                                                        187m                +22%
zooplus market             4.9%                                                                                                                  SI, HR, BG, TR,
                                                                                                                                                 GR, LV, LT, EE
share in 2017                                                             5.1%       FR, MC
                                                                                                            90m
                                                                                                                            +22%
                                                                                                             3.7%
                                                       66m        +27%                                                IT
                                                        3.9%
                                                             ES, PT

Source: zooplus sales, unaudited data, growth rates compared to 9M 2017;
market shares based on Euromonitor 2016 market data and zooplus estimation                           Investor & Analyst Presentation – December 2018 | page 7
Customer loyalty – the winning factor of the business
model – is at very high levels
Retention rates – Cohort analysis – Sales (€ m)
Ø 93%
1,111
Ø 93%1)
Ø 92%
2017 a
Ø 94%1)
Ø 94% 909 271
Ø 93%1)
2016 a
Ø 91% 711 253 86%
217
2015 a
Ø 85% 543 202 83%
167 86%
144
2014 a
Ø 79% 407 83%
174 145 88%
127 94% 119
319 2013 a
135 78%
105 90% 95 96% 91 97% 88
245 2012 a
2011 a 125 70%
87 91% 79 99% 78 99% 77 99% 77
100 62%
62 90% 56 99% 55 102% 56 100% 56 100% 56
2010 a+1
55 84% 46 98% 45 99% 44 104% 46 101% 46 101% 47Account value and customer account retention
increase with length of customer life
Projected sales per active account out of 2017 (in €)
345 360
331
295 312
285 291 290 Cumulated
270
244 sales per
account created
191 over a+10
years: € 1,730
a: year of
a a+1 a+2 a+3 a+4 a+5 a+6 a+7 a+8 a+9 a+10 acquisition = 2017
Account survival
100%1) 79% 81% 89% 93% 94% 95% 95% 96% 96% 95% rate2)
Share of remaining
100%1) 79% 64% 57% 53% 50% 47% 45% 43% 42% 40%
accounts3)
Sales per
191 192 173 163 154 144 140 142 144 144 142
account created
1) customers with at least one consecutive purchase after first transaction
2) Projected rate based on account retention rate of respective cohort
3) Average projected share of remaining accounts based on account survival rate Investor & Analyst Presentation – December 2018 | page 9Customer lifetime value is strongly positive and
justifies stronger investment focus
a+5 a+10
2017 projected projected
1,730
2017 net sales per
account in EUR (cum.)1 1,017
164
97
19
Customer acquisition CM cumulative 5 years CM cumulative 10 years
costs2 plus acquisition year plus acquisition year
1 Only accounts with repurchasing activity based on cohort specific retention rate (incl. fx-effects)
2 Traffic acquisition costs per new account with repurchasing activity
3 CM = contribution margin = net sales – all variable costs (excl. acquisition costs) = 9.5% Investor & Analyst Presentation – December 2018 | page 10Gross margin stabilization in Q2 2018 confirmed in
Q3 2018
Gross margin1
in % of sales
» Less customer and transactional
discounts
28.6%
» Reduction of non-profitable orders
28.3%
27.1% » Higher charges for shipping
− Changes in free-shipping
thresholds
− Charges for 2nd parcel in
an order
» Margin increase due to better
Q1 2018 Q2 2018 Q3 2018
sourcing
1 Sales – CoGS
Investor & Analyst Presentation – December 2018 | page 11Long-term gross margin decline halted
Gross margin1
in % of sales
37.4%
35.8%
32.3%
30.6%
28.7% 28.5% 28.0%
2012 2013 2014 2015 2016 2017 9M 2018
1Sales – CoGS; years prior to 2018 adjusted from published
external figures to new IFRS 15 Investor & Analyst Presentation – December 2018 | page 12Online private label business gains traction and
should grow to 20% share of food by 2020
12% 13% 4% 5% 1.3 1.5
Share of Share of Growth index
total food first order sales private label / food
Further significant increase in private label share until 2020
Figures for 2016 and 2017 Investor & Analyst Presentation – December 2018 | page 13zooplus investment mode will continue and further
improve zooplus’ market position
1 Competitive » Defending high loyalty of existing customers
pricing » Acquisition of new customers
2 Marketing » New customer acquisition for high customer lifetime value
costs » Increased investment into mobile
3 IT product » Improved product and user experience
development » Improved internal processes and efficiencies
4 » Close white spots in the distribution network
Logistics
» Increase capacity and speed up delivery to customers
5 » Expansion of private label share
Private label
» Development of new brands
Improved strategic position and driver for further growth
Investor & Analyst Presentation – December 2018 | page 14Cost ratio in 9M 2018 impacted by stronger
investment focus since H2 2017
Total margin & cost structure (in % of sales)
29.4% 28.6% Total margin1
28.9% 29.4% » Higher traffic acquisition
1.9%spend
Advertising/
1.7% 2.0% Marketing
» Logistics costs impacted by start-up
costs for new fulfillment centers
Logistics2
19.7% 19.8% » Admin costs impacted by higher
depreciation
1.0% 1.1% Payment
1.1%
IT/Admin/ (incl. 1.0% » Higher 1.0%
personnel costs in perspective
3.2% 3.2% depreciation & interest) of investment in people in IT and
3.3% 3.3% Personnel3 other key functions
9M 2017 9M 2018
1 Gross margin + other income on sales 3 All in, including LTI & SOP
2 Logistics costs reclassified to depreciation and interests according to IAS 17 Investor & Analyst Presentation – December 2018 | page 15Back on improved cost ratio path and
positive EBT in Q3 2018
Total margin & cost structure (in % of sales)
27.5% 28.9% 29.5% Total margin1
29.2% 30.1%
29.0% Advertising/
1.9% Marketing
2.0% 2.0% 1.9%
» Improved value per parcel with
positive impact on logistics costs
Logistics2
20.1% 20.3% 19.1%
» Further progress in routing
efficiencies in logistics network
1.0% 1.1% 1.1% Payment
IT/Admin/ (incl. 1.0% » Scale in IT/Admin, although
1.0%
3.0% 3.4% 3.3% depreciation & interest)
increasing depreciation
3.1% 3.5% 3.5% Personnel3
Q1 2018 Q2 2018 Q3 2018
- 1.7% -1.1% 0.5% EBT margin
1 Gross margin + other income on sales 3 All in, including LTI & SOP
2 Logistics costs reclassified to depreciation and interests according to IAS 17 Investor & Analyst Presentation – December 2018 | page 16Cost efficiency and cost control continue to be
major focus points
Total margin & cost structure (in % of sales)
38.0% 29.5% 29.5% Total margin1
38.8%
4.8% Advertising/
Marketing
29.9%
1.9% 29.0%
2.0%
2.2% 2.0%
24.1%
Logistics2
20.3% 19.1%
1.5%
3.8% 1.0% 1.1% Payment
3.2% 3.3% IT/Admin/ (incl.
4.7% depreciation & interest)
3.1% 3.5%
Personnel3
TY 2012 Q3 2017 Q3 2018
1 Gross margin + other income on sales 3 All in, including LTI & SOP
2 Logistics costs reclassified to depreciation and interests according to IAS 17 Investor & Analyst Presentation – December 2018 | page 17Comparison of cost structure – significant
advantage for zooplus
Cost ratio - selected competitors
48%
43% 41% 43%
40%
29%
Cost advantage for zooplus of more than 10%-points
Source: annual reports 2016 – Fressnapf 2015: all costs except for costs of goods sold, including depreciation and interest
Investor & Analyst Presentation – December 2018 | page 18Strong profitability of repeat customers business invested
to grow the business with long-term perspective
Repeat customer and new customer contribution (€ m)
Repeat customers New customers
(consecutive year’s sales) (sales in the year of acquisition)
Sales % of EBT EBT- Sales % of EBT EBT-
total z+ margin total z+ margin
2016 656 72% 23 + 4% 253 28% -5 - 2%
2017 840 76% 21 + 3% 271 24% - 17 - 6%
Reduction of profit margins in 2017 resulting from deliberate decision of stronger
investment focus to improve overall zooplus strategic position and long-term valuation
.
Investor & Analyst Presentation – December 2018 | page 19zooplus pan-European logistics network is a fully
integrated flexible network
» All centers managed as one
integrated pan-European
network
» All FCs operated by partners 2018
2009 2017
» Capex light approach 2017/18
2013
» SKU allocation, replenishment, 2016 2000/2011
order routing and packing 2015
2017
algorithms intellectual property
2015
of zooplus 2019e
2018
Fulfillment center (FC) Planned FC’s for 2018
Investor & Analyst Presentation – December 2018 | page 20zooplus logistics – significant expansion of pan-
European network in 9M 2018
Coventry (UK)
» Size of UK FC tripled in Q2 incurring
one-off costs and reduced efficiency
for transition period
Krosno (PL)
» New FC Poland started end of
September 2018 – 40,000 sqm
» New FC Spain started in September
2018 – closing of white spot in
network and strong improvement of
delivery speed to customers
Madrid (ES)
» New FC Spain operated by
4th FC partner – XPO Logistics
Investor & Analyst Presentation – December 2018 | page 21Distribution to the customer with the leading local
last mile providers
» Last mile distribution with
external partners (DSPs)
» zooplus operates approx. 60
relations of line hauls (trunk)
and direct DSP connections
2009
» At least two DSPs for every 2017
2017
2013
country offered for better 2016 2000/2011
customer service
2015 2017
» Management of parcel
allocation to FCs and DSPs by 2015
zooplus owned algorithms
» Focus on delivery speed and
efficiency
Fulfillment center (FC)
Hubs (DSP) - shown are selected relations from FC to Hub of DSPs
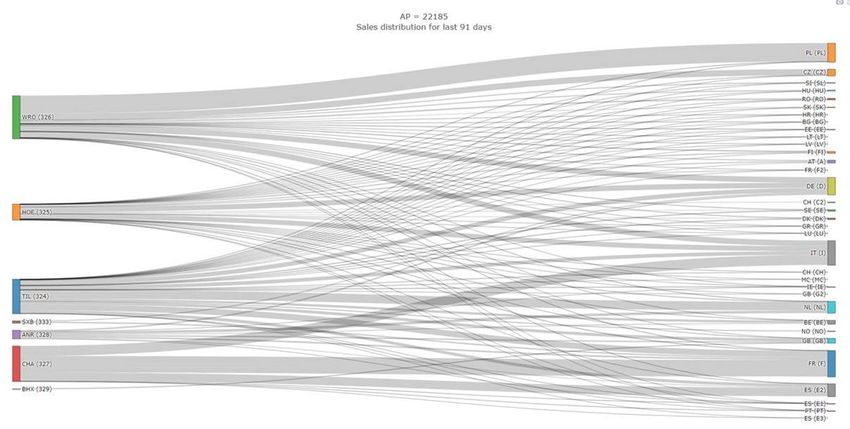
Investor & Analyst Presentation – December 2018 | page 22zooplus logistics system is an intelligent network solution
between fulfillment centers and destination countries
Example Cat‘s Best (cat litter): article flow between fulfillment centers and
country of destination for a period of three months
Fulfillment
center PL
WRO
DE Country of
HOE destination
IT
TIL
SXB NL
ANR GB
CHA FR
BHX ES
Criteria for choice of » No. of products in parcel » DSP chosen
logistics center1: » Top seller/long-tail » Available stock
1 selective
Investor & Analyst Presentation – December 2018 | page 23Operating cash flow continues to be positive – further
improvements in working capital
Cash flow (€ m)
9M 2018
20.4
Major focus on working capital and
operating cash flow improvements
14.3 with main drivers:
-6.1
» Inventory turn
» Payment days
3.1 % 2.5 %
Cash flow from Cash flow from Free cash flow
operating investing
activities activities
Investor & Analyst Presentation – December 2018 | page 24The planned growth should go with a positive
operating cash flow
Working capital development in % net sales
9.5% » Increase in inventory
turnover
8.1%
» More efficient
6.3% replenishment process
5.1% » Improvement in
payment days
Constant working capital in
2018 implies a further
reduction to around 4.2%
of sales, for 2019 to around
2014 2015 2016 2017 3.4% of sales
Investor & Analyst Presentation – December 2018 | page 25Sales and EBT guidance for full year 2018
Sales (€ m) EBT (€ m)
Guidance 2018e +21 to +23%
- 0.5 to + 0.5%
1,344 to 1,366 of net sales
+ 233 to + 255 vs. 2017
Profit guidance 2018 based on current FX levels.
Investor & Analyst Presentation – December 2018 | page 26You can also read