Market and Economic Review - Milford Asset Management
←
→
Page content transcription
If your browser does not render page correctly, please read the page content below

Milford KiwiSaver Plan Monthly Review
                                                                January 2018

Market and Economic Review
The 2017 calendar year was another excellent period for investors with most of the world’s major share
markets producing double digit returns. The benchmark NZX 50 Gross Index appreciated 22.0%, the ASX
200 Accumulation Index 11.8%, the Dow Jones Industrial Average Total Return Index 28.1%, the NASDAQ
Composite Total Return Index 29.6% and the MSCI World Net Total Return USD Index by 22.4%.

Milford's KiwiSaver funds delivered strong returns for the year, with the Active Growth Fund appreciating
15.6%, the Balanced Fund 13.3% and the Conservative Fund 8.6% (see page 4 for more detail on
performance). The double digit returns of the Active Growth and Balanced funds have been against a
backdrop of low inflation and interest rates, an uptick in global economic growth and high investor cash
levels globally.

Our stock selection has also contributed positively, with holdings in the NZX 50 Index's five best performing
companies in 2017 – a2 Milk, Tourism Holdings, Fisher & Paykel Healthcare, Air New Zealand and
Restaurant Brands – boosting the performance of Milford’s funds. In addition, Milford investors own 8.4%
of Serko, which was the best performing non-NZX 50 company with a total return of 655.2% in 2017.

As global share markets have had six consecutive years of positive returns, one may expect a meaningful
correction is due. However, for the following reasons we are cautiously optimistic for 2018;
• Global economic growth is trending upwards, with most countries participating in the upturn
• The improved economic outlook should boost company earnings
• Business investment, which is an important ingredient in any economic upturn, is finally picking up
• Takeover activity is expected to increase and there will be a limited number of IPOs, particularly on the
   NZX, to divert investor returns from existing investments
• Interest rates will increase but these increases are expected to be modest.

Although we are cautiously optimistic about the year ahead, we are fully aware that share markets have
corrections from time to time. We will continue to monitor economic and political developments daily as
the protection of investors’ capital, on a medium-term basis, is one of Milford’s main objectives.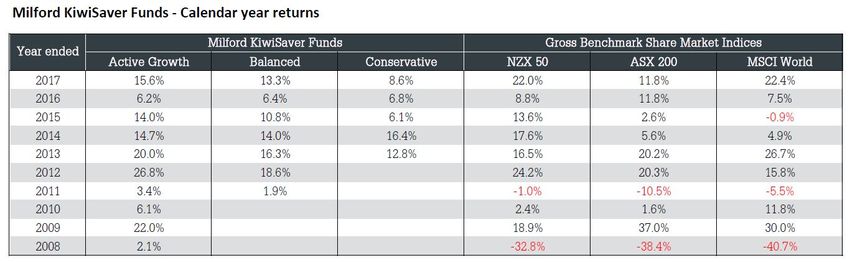
Milford KiwiSaver Plan Monthly Review as at 31 December 2017

Conservative Fund Portfolio Manager: Paul Morris                                                    Actual investment mix

The Fund returned 0.2% in December, bringing its one year return to 8.6%. December
saw mixed performance across asset classes. Shares contributed positively again                                                          Cash and Cash
(albeit more moderately than recent months), with only minimal return from corporate                                                     Equivalents 13.92%
bonds. Global government and corporate bond performance was mixed, with notable                                                          New Zealand Fixed
weakness in Australia and outperformance in NZ.                                                                                          Interest 29.23%
In 2017, the Fund benefited from ongoing extraordinary global monetary policy, lower                                                     International Fixed
than anticipated inflation and improving global economic growth. The expected                                                            Interest 42.55%
                                                                                                                                         New Zealand Equities
weakness in government bonds did not materialise, in turn supporting a global hunt
                                                                                                                                         2.36%
for yield which underpinned both corporate bonds and shares.                                                                             Australian Equities
Looking ahead at 2018, synchronised global economic growth increases the                                                                 1.79%
inflationary threat, while monetary policy support is likely to wane. The impact on                                                      International Equities
markets may be gradual, as global liquidity remains high, but given the Fund's                                                           5.23%
conservative risk profile, along with bond and share valuations, we continue to err on                                                   Listed Property 4.46%
the side of caution. To that end, we retain an overweight to cash and fixed interest                                                     Other* 0.46%
versus shares, compared to our long run neutral allocation, but with a limited interest
rate exposure and an increased average credit rating among our bond holdings.
Looking forward, near term returns should remain reasonable, but likely lower than the
last year.

Balanced Fund Portfolio Manager: Mark Riggall
The Fund returned 0.6% in December, bringing its one year return to 13.3%. December                                                      Cash and Cash
continued the year-long theme of buoyant markets. In the US, we saw the Trump                                                            Equivalents 11.79%
administration deliver tax reforms – a positive catalyst for US stocks. In Australia, we                                                 New Zealand Fixed
saw some major cross border merger action with a bid for Westfield Corporation from                                                      Interest 9.09%
French competitor, Unibail. Both of these events generated positive returns for the                                                      International Fixed
Fund in the month.                                                                                                                       Interest 20.99%
The Dynamic Fund, in particular, continued its run of strong returns, gaining 3.4%                                                       New Zealand Equities†
                                                                                                                                         8.88%
during the month. Given the continued strength in the global economy, it was unlikely
                                                                                                                                         Australian Equities
that the recent trend of lower market interest rates would continue and in December,                                                     11.91%
we saw a modest fall in global bond prices (bond prices move inversely to interest                                                       International Equities
rates). Despite this, Milford’s bond funds delivered positive returns in the month. The                                                  29.61%
NZ dollar was strong recently as it tends to be at this time of year and this was a mild                                                 Listed Property 7.12%
headwind to performance. The 2017 year has been characterised by strong global                                                           Other* 0.61%
markets and a distinct lack of volatility. Whilst the outlook for the global economy looks
good, this period of calm is unlikely to persist indefinitely. Therefore, we continue to
invest with caution - positioning the Fund with a mildly lower allocation to shares and
corporate bonds than its neutral position.

Active Growth Fund Portfolio Manager: Jonathan Windust
The Fund rose 1.7% in December to end up 15.6% for the year. It was another good                                                         Cash and Cash
month for share markets which benefited from good economic momentum, good                                                                Equivalents 9.63%
company earnings, low interest rates and tax cuts in the US.                                                                             New Zealand Fixed
Key company positives were Tourism Holdings (+19.8%), Trilogy (+21.5%) and Fletcher                                                      Interest 3.33%
Building (+9.5%). Trilogy rose following a takeover offer, Tourism Holdings as a                                                         International Fixed
beneficiary from lower US tax rates, and Fletcher Building in part due to share                                                          Interest 11.44%
purchases from the new CEO. During the month, we added to our holdings in Xero,                                                          New Zealand Equities‡
                                                                                                                                         28.30%
taking advantage of price declines due to selling as it was removed from the NZ share
                                                                                                                                         Australian Equities
market index. At month end, the Fund had approximately 75% invested in shares, with                                                      19.97%
a higher than average weight in global shares and lower than average weight towards                                                      International Equities
NZ shares.                                                                                                                               21.33%
The outlook for share markets in 2018 remains supported by good and robust economic                                                      Listed Property 5.54%
growth, positive company earnings prospects, low interest rates and plenty of liquidity.                                                 Other* 0.46%
The key risks for share markets are the prospect of further rate rises in the US, relatively
high company valuations and the NZ housing market. On balance, we believe share
markets will generate solid returns although we remain active within the Fund to
capture new opportunities and manage any downside risks.

 †Includes   unlisted equity holdings of 0.23% ‡Includes unlisted equity holdings of 2.27% *Other may include swaps and currency contracts.
Milford KiwiSaver Plan Monthly Review as at 31 December 2017
Fund Performance
Since Fund
Past month 1 year 3 years (p.a.) 5 years (p.a.) Unit price $ Fund size $
inception (p.a.)
Conservative Fund 0.22% 8.56% 7.14% 10.07% 10.36% 1.6546 41.7 M
Balanced Fund 0.56% 13.26% 10.15% 12.12% 10.78% 2.1404 190.7 M
Active Growth Fund 1.74% 15.58% 11.84% 14.02% 13.27% 3.3747 846.1 M
For details of how investment performance is calculated, and returns at each PIR please see www.milfordasset.com/funds-performance/view-performance#tab-performance.
Performance figures are after total Fund charges* have been deducted and at 0% PIR.
Please note past performance is not a guarantee of future returns.
*Total Fund charges do not include the $36 p.a. Administration and Registry fee.
Inception dates for the Funds: Active Growth Fund: 1 October 2007^, Balanced Fund: 1 April 2010, Conservative Fund: 1 October 2012.
^The performance is based on the performance of the AonSaver AMT Milford Aggressive Fund until 31 March 2010 and the Milford Aggressive KiwiSaver Fund from 1 April 2010. The
investment policy of the Milford KiwiSaver Aggressive Fund replicates that of the AonSaver AMT Milford Aggressive Fund, in place since 1 October 2007. On 1 October 2011, this
Fund was renamed the Milford KiwiSaver Active Growth Fund.
Key Market Indices
Past month 1 year 3 years (p.a.) 5 years (p.a.) 7 years (p.a.)
S&P/NZX 50 Gross Index (with imputation credits) 2.63% 23.60% 16.12% 17.07% 15.73%
S&P/ASX 200 Accumulation Index (AUD) 1.81% 11.78% 8.63% 10.22% 8.32%
S&P/ASX 200 Accumulation Index (NZD) 1.21% 18.37% 10.41% 7.30% 5.63%
MSCI World Index (local currency)* 1.10% 18.47% 9.64% 13.28% 10.72%
MSCI World Index (NZD)* -2.20% 20.01% 12.76% 15.00% 11.06%
S&P/NZX 90-Day Bank Bill Rate 0.16% 2.02% 2.65% 2.79% 2.79%
*With net dividends reinvested
Top Securities Holdings (as a percentage of the Fund’s Net Asset Value)
Conservative Fund Balanced Fund Active Growth Fund
ASB Bank 5.25% 2026 2.03% iShares MSCI EAFE Index Fund 5.50% Vanguard Intl Select Excl Index Fund 3.91%
Westpac 4.695% 2026 1.79% Vanguard Intl Select Excl Index Fund 4.01% iShares MSCI EAFE Min Vol ETF 3.82%
ANZ Bank 5.28% 2049 1.69% Wellington Strategic Euro^ 1.17% Spark New Zealand 2.20%
QBE 6.115% 2042 1.47% ASB Bank 5.25% 2026 1.08% Contact Energy 1.61%
ASB Bank 6.65% 2024 1.46% Antipodes Global Fund^ 0.95% Tourism Holdings 1.57%
NAB Float 2023 1.32% Spark New Zealand 0.95% Air New Zealand 1.57%
Precinct Properties 4.42% 2024 1.23% Contact Energy 0.89% CYBG 8% 2049 1.56%
Genesis 5.7% 2022 1.17% GMO Systematic Global Macro^ 0.89% iShares MSCI EAFE Index Fund 1.49%
ANZ Term Deposit 3.08% 06/18 1.09% Hawkes Bay Investors^ 0.87% Delegat Group 1.41%
IAG 5.15% 2043 1.09% Charter Hall Group 0.85% Chorus 1.40%
^Externally managed fund.
Milford staff have approximately $7.6 million invested in the Milford KiwiSaver Plan as at the end of December 2017.Milford KiwiSaver Plan Monthly Review
January 2018
Long-term KiwiSaver Returns
One of Milford’s KiwiSaver objectives is to deliver superior investment returns on a long-term basis without
taking too much risk. This can be achieved by having well diversified portfolios and adopting strategies
that can be used to protect portfolios from share market downturns.
The following calendar year returns table demonstrates that Milford delivered positive returns in 2008 and
2011 when share markets had negative returns.
The three Milford KiwiSaver funds have had the following returns since inception;
• The Active Growth Fund, which began investing on 1 October 2007 and has funds under management
(FUM) of $846m at the end of December 2017, has returned 13.3% per annum since inception
• The Balanced Fund, which has FUM of $191m, has returned 10.8% since inception on 1 April 2010
• The $42m Conservative Fund has returned 10.4% per annum since inception on 1 October 2012.
Two of the most important requirements of effective portfolio managers is to have a high level of cash and
defensive assets when markets fall and have the courage to reinvest back in the market after prices have
declined. The figures in the accompanying table demonstrate that Milford’s portfolio managers have been
effective as far as these strategies are concerned over the past decade. Our aim is to continue to achieve
these objectives in the years ahead.
Level 17, 41 Shortland Street, Auckland
PO Box 960, Shortland Street, Auckland 1140
Free phone 0800 662 346
milfordasset.com
Disclaimer: The Milford Monthly Review has been prepared by Milford Funds Limited. It is based on information believed to be accurate and reliable although no guarantee can be
given that this is the case. No reproduction of any material either in part or in full is permitted without prior permission. For more information abut the Funds please refer to the Product
Disclosure Statement or the latest Quarterly Fund Update.You can also read